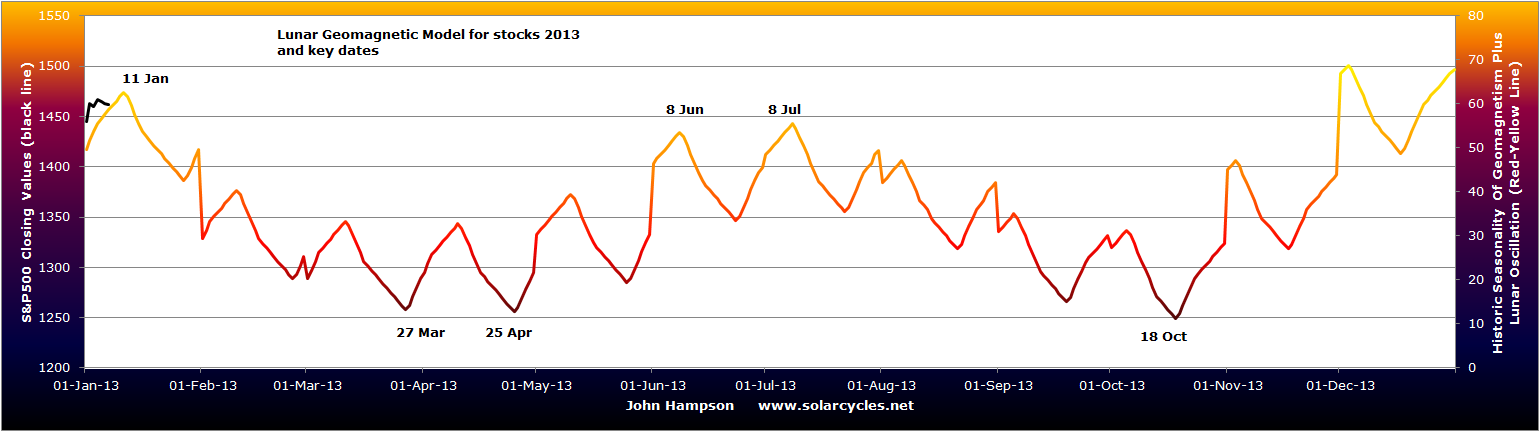
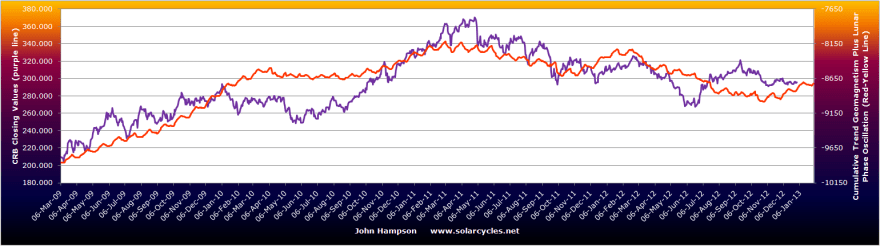
Here is the lunar geomagnetic model for the stock market for 2013:
 This combines the seasonality of geomagnetism with lunar phase oscillation. Both phenomena influence human sentiment and therefore market performance. The caveat is that some years are more ‘seasonal’ than others, and that lunar phase oscillation doesn’t work all the time, with lunar inversions also occurring. Nonetheless, the key dates are noted with a potential peak this coming Friday, a March-April low, a June-July peak and an October low.
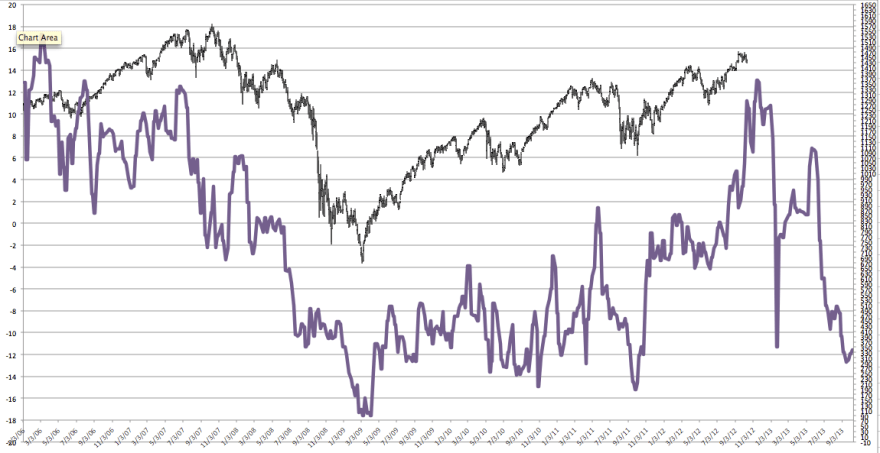
Now take a look at Eurodollar COT as a lead indicator (by 1 year) for equities:
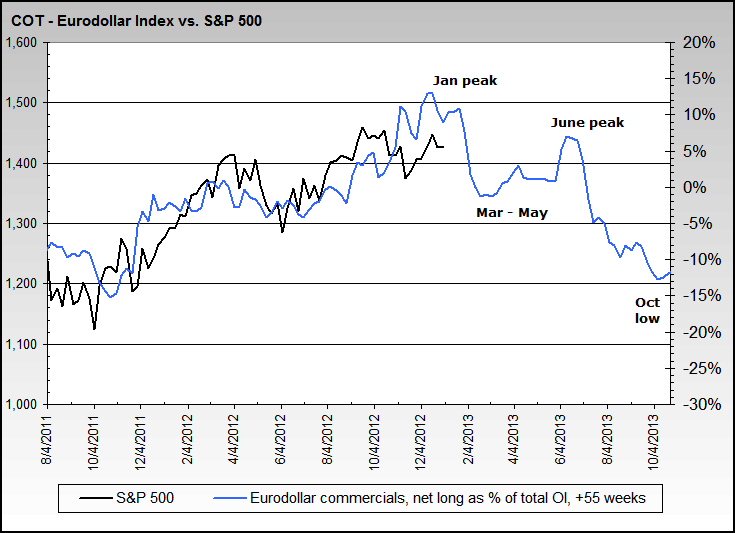
Source: NowAndFutures
There is a clear alignment with my model above: Jan and June peaks, March and Oct lows.
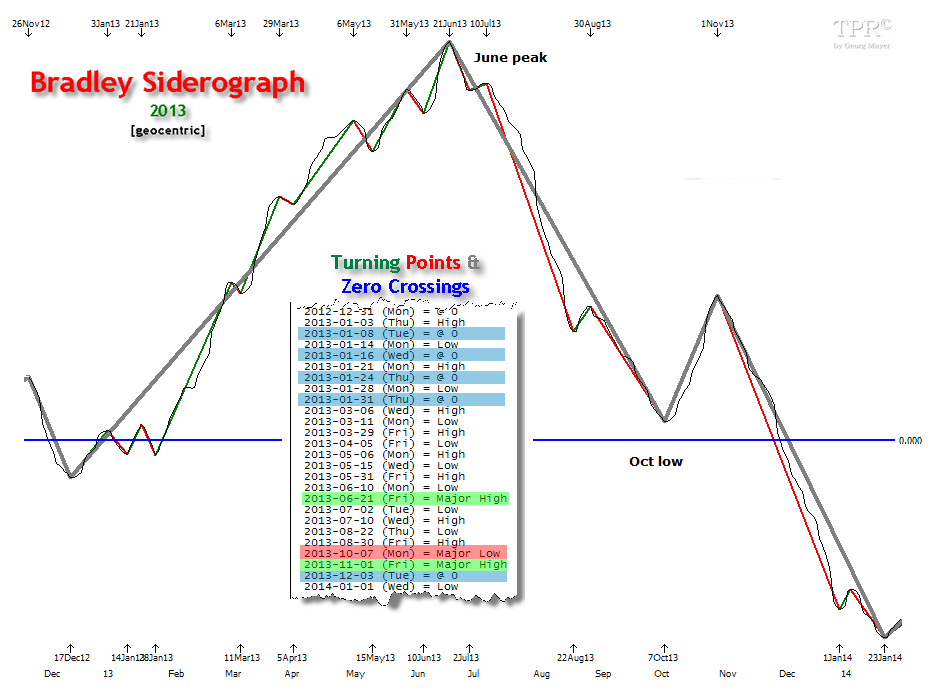
I have found Bradley turns too hit and miss to be a part of my regular toolkit, but for those hits when they occur, I like to keep it on the radar each year. Bradley turns are based on the planets, and it should be noted that whilst chart maps are built on them each year, the turn dates can be either lows or highs so do not actually indicate a path for the market, only trend change points. With that caveat, here is a siderograph for 2013:

Source: Time-Price-Research-Astrofin Blogspot
A June peak and an October low again, but this time no low around March, just upward into June.
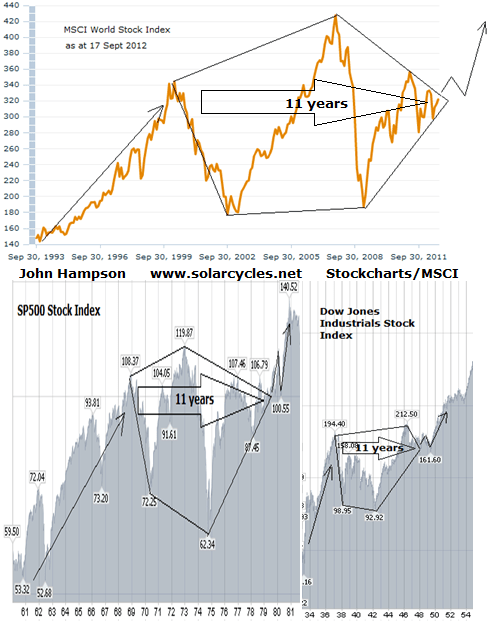
The 45 year cycle was brought up in the comments on my last post. I would argue that this is in fact 4 solar cycles, and suggested this when I reproduced this Dow Jones spectrogram in 2012 showing actual cycles in the Dow Jones. The peaks show real cycles around 11, 33 and 44 years, all approximations and multiples of the solar cycle:

Source: Sergey Tarassov
What perked my interest however was that in Dec 2012 I had shown a chart using MCRI’s tool that revealed 1967 to be the closest mirror from history for US stocks with a 90% correlation, and I now realise this is 45 years ago, which adds weight to the potency of the 45 year or 4 solar cycle repetition in time. The next chart therefore shows what happens next in 1968 with potential connotations for 2013:
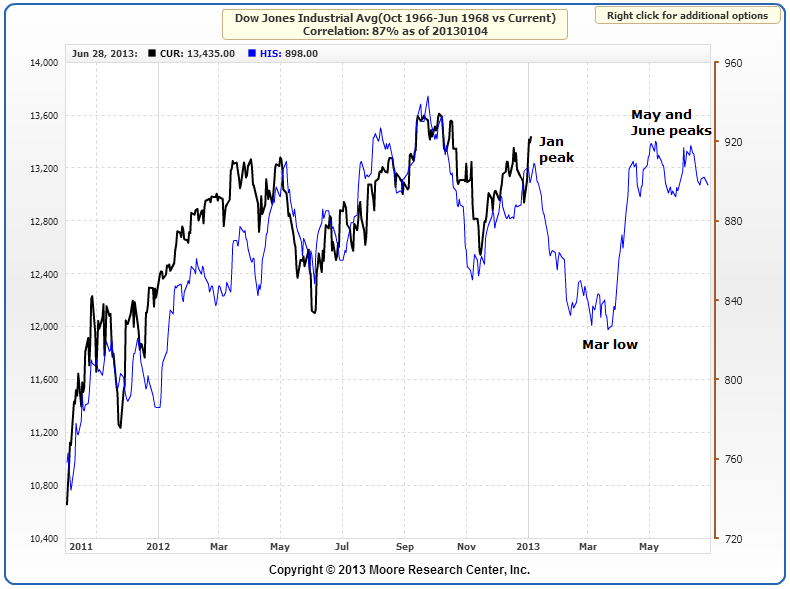
Source: MRCI
Interestingly, similar peaks and troughs pop up: Jan high, March low, June peak.
Here’s one more. Presidential seasonality in the year after US elections looks like this:
 Source: SeasonalCharts
Spring low, Summer high, Autumn/Fall low. That’s five models in impressive alignment. But before we get too carried away, I suggest there is likely to be some repetition in the underlying for this range of models, namely common seasonality. By my research, the seasonality of geomagnetism is behind the seasonality of the stock market (see Seasonality section of my Trading The Sun PDF). The majority of years play out similar to the seasonal model. Therefore that overall theme of a Jan high, spring low, summer recovery and bottom around October time, is fairly common looking back at stock market years in history. But sometimes we get an atypical year. Geomagnetism may not follow the usual roadmap or technical and fundamental factors may blow the market off course. One potential such factor is that we enter 2013 with an overall pick up in economic data together with recent technical breakouts in certain key markets, both of which could inspire stocks to perform beyond January. Also recall that cyclical stocks as a leading indicator suggest a peak around March and a mid-year low – quite the opposite to the above:
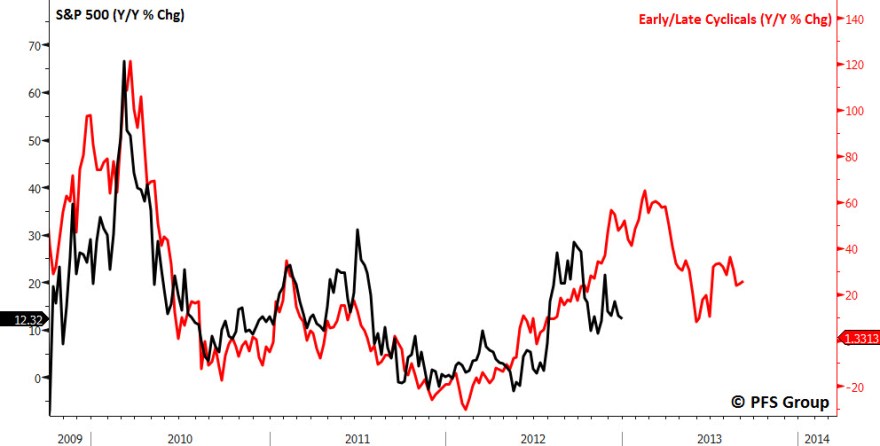 Source: PFS Group
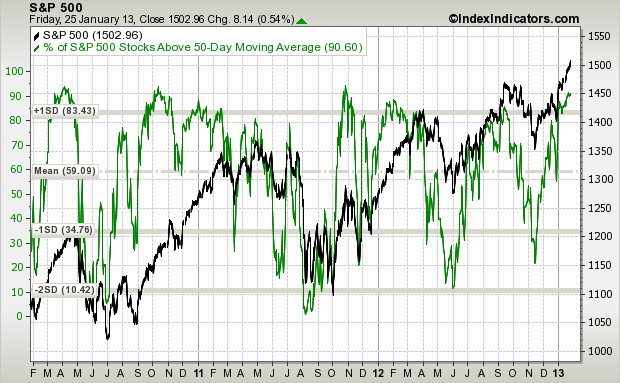
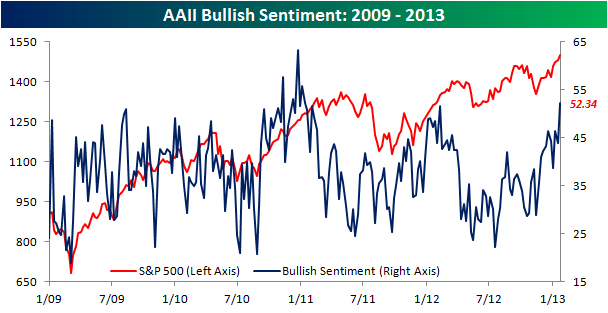
However, we do currently see evidence of overbought and overbullish extremes in certain pro-risk markets, which could provide the backdrop to a January high. Look at the excessive optimism across the different US stock market sectors, with one obvious exception in gold miners:
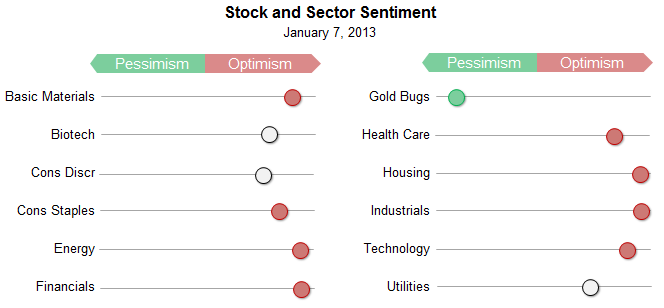 Source: Sentimentrader
Furthermore, economic surprises for the US appear to be rolling over, which could also drag back equities (although the lead time on that has historically varied):
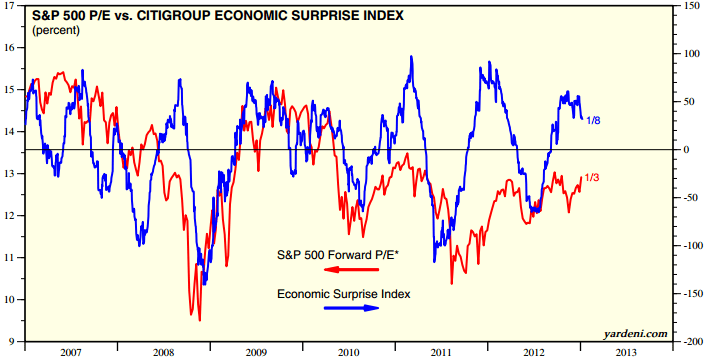 Source: Ed Yardeni
In H2 2012 I was on the look out for cyclical stocks bull topping indicators, including: a topping range process lasting several months whilst internals degrade; divergences in breadth and/or leading indicators; a spike in yields and inflation. We didn’t see them, so I remained long equities. Now, in January 2013, if stocks are topping, then they can only be at the beginning of a topping process, because we still do not particularly see those characteristics. That said, I am confident we will see a cyclical stocks bull top in 2013, based on secular/solar history, and it should occur by the latest at the solar peak (forecast for circa Sept 2013 currently). So a mutli-month topping process that began now and completed by mid-2013, would fit well.
Here is a typical example from the last cyclical bull top:
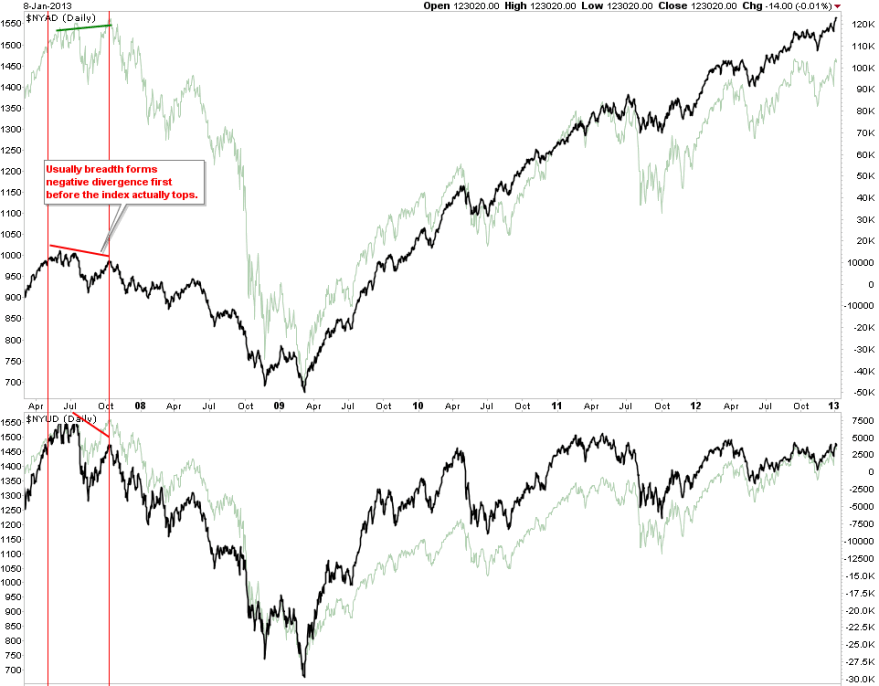 Source: Cobra/Stockcharts
Stocks made a high then a marginal new high several months later, whilst breadth diverged. There were two opportunities to exit stock longs, but the clues for the cyclical top were only in evidence by the second opportunity: the marginal new high.
So here’s a hypothesis. Stocks make a top in January 2013, as per the aligned models, followed by a pullback within an overall topping range process, then a marginal new high around June which bears the divergences of a cyclical bull top. Were this to come good, then that could imply that the first opportunity to exit stock longs would be imminent, possibly Friday of this week. One factor that could play into this is US earnings, which began yesterday with Alcoa. The season really gets going next week, and a ‘sell’ theme could potentially play out on an overall disappointing beat rate or outlook.
An alternative scenario would be that stocks continue to advance into March, as per the cyclical stocks model, with support from recent improvement in economic data, before the topping process begins and lasts through to the Autumn/Fall.
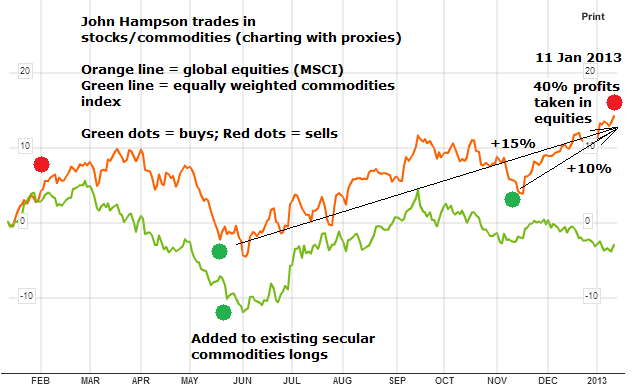
So what to do? I am going to mull this over but if stocks can rise further into bull/bought extremes by the end of this week, I may sell a chunk of long positions. Understand though that as things stand with my equity longs in tact, my bigger pro-risk weighting is to commodities. A concern I have is that if I exit equities I am very much dependent on commodities making a final secular push – a push which one would have to say is currently absent. So let’s have a look at commodities.
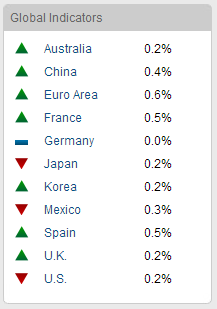
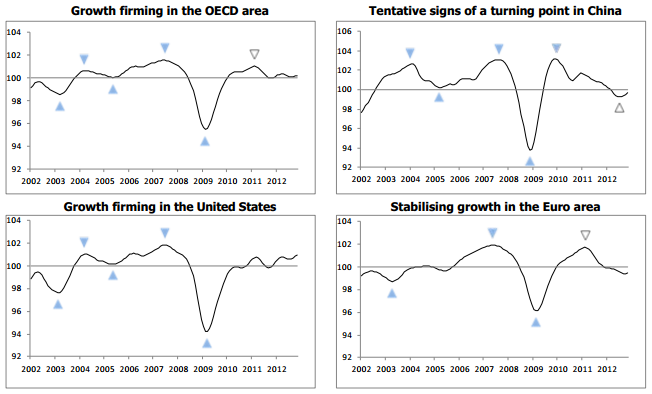
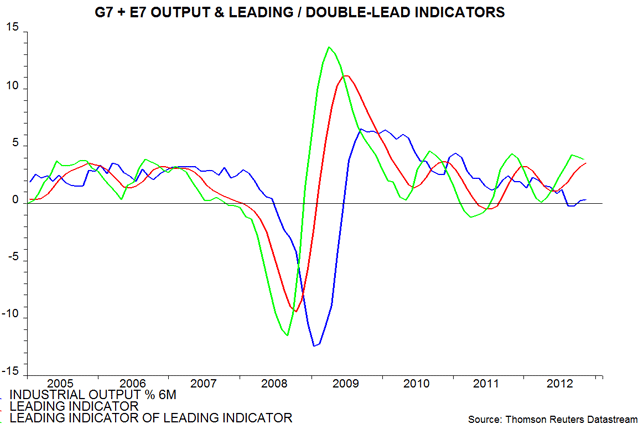
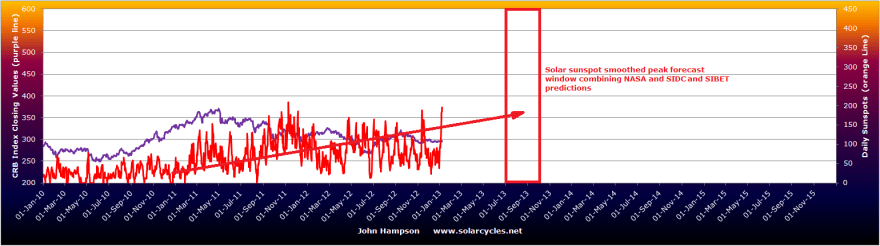
As previously noted, many commodities are currently suffering extremes of overbearish sentiment. That sets them up for a potential rally. Supporting this is economic improvement in China – the biggest consumer in commodities. Plus inflation expectations have risen of late, and treasuries have begun to experience outflows, both of which should inspire more money into commodities. All that said, commodities as a class remain without momentum at the moment, despite Gann forecasting acceleration would begin as of November 2012, and solar/secular history also suggesting commodities should accelerate over the course of the 12 months into the solar peak. Here is the current combined solar peak forecast – note that a pick up in sunspots over the last week has helped give the overall solar oscillation more of an uptrend look:
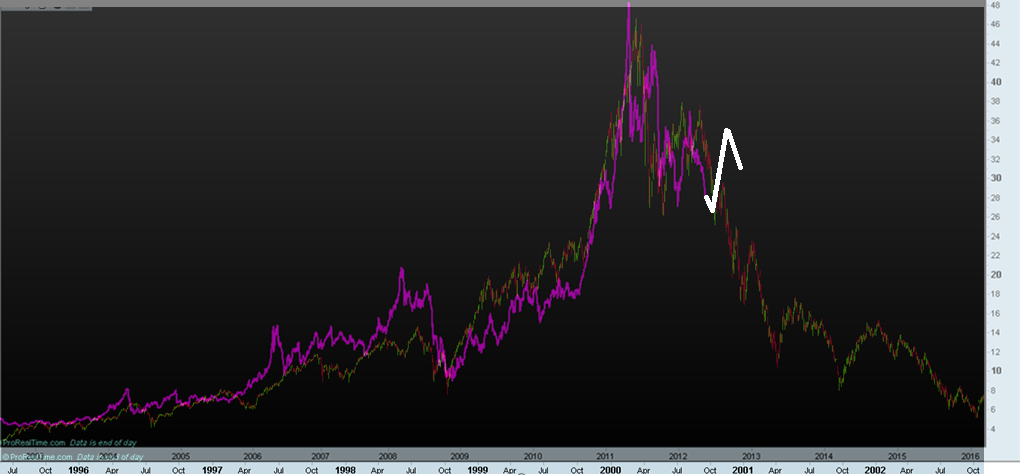
 In short, commodities should accelerate without delay, and start to outperform stocks. Precious metals should be the leading class. A long term look at the Dow-gold ratio reveals that equities are historically cheap compared to precious metals. Long precious metals at this point is therefore a play on a parabolic finale to extreme overvaluation. That may be a dangerous game, but history has fairly reliably delivered such a parabolic finale to a secular bull. There was some question last year over whether silver had in fact made that secular parabolic peak, by comparing it to the Nasdaq bubble:

Source: Profitimes
I have added in white what happened since – and in the bulls’ favour it broke free from the analogy and did not collapse into the start of 2013. Gold made no such parabolic but remains range bound over the last year, neither confirming the bull or bear case. In short, I still maintain precious metals will go on to make a parabolic finale ahead this year, along with commodities as a whole, but right now it remains a position of faith. As we are in a multi-year transtion period from secular commodities and treasuries bulls and secular equities bear to the opposite in each, with equities cheap compared to treasuries and commodities, and commodities lacking in momentum, I have concerns about leaving myself heavily weighted to commodities making their finale, until we see that acceleration begin to occur. However, we may potentially be knocking on the door of that development:
 Source: Chris Kimble
This is what I am going to chew over today and tomorrow. If you have anything to add to this, please step forward in the comments below, as I welcome your input.

 Source: Bespoke
 Source: PFS Group
 However, of course that resistance is another reason why stocks could take a breather now before making such action. If the overthrow occurs, then Laslo Birinyi’s work models it at around 1600, and Will Preston gets 1580. That would make a marginal secular nominal high for the SP500 secular stocks bear and there is some allure in that to fooling investors once again that we are in a new long term bull market before a cyclical bear actually occurs. It’s a target clearly within reach now either in a continued advance to Spring, or a pullback here and then a final high around June time.
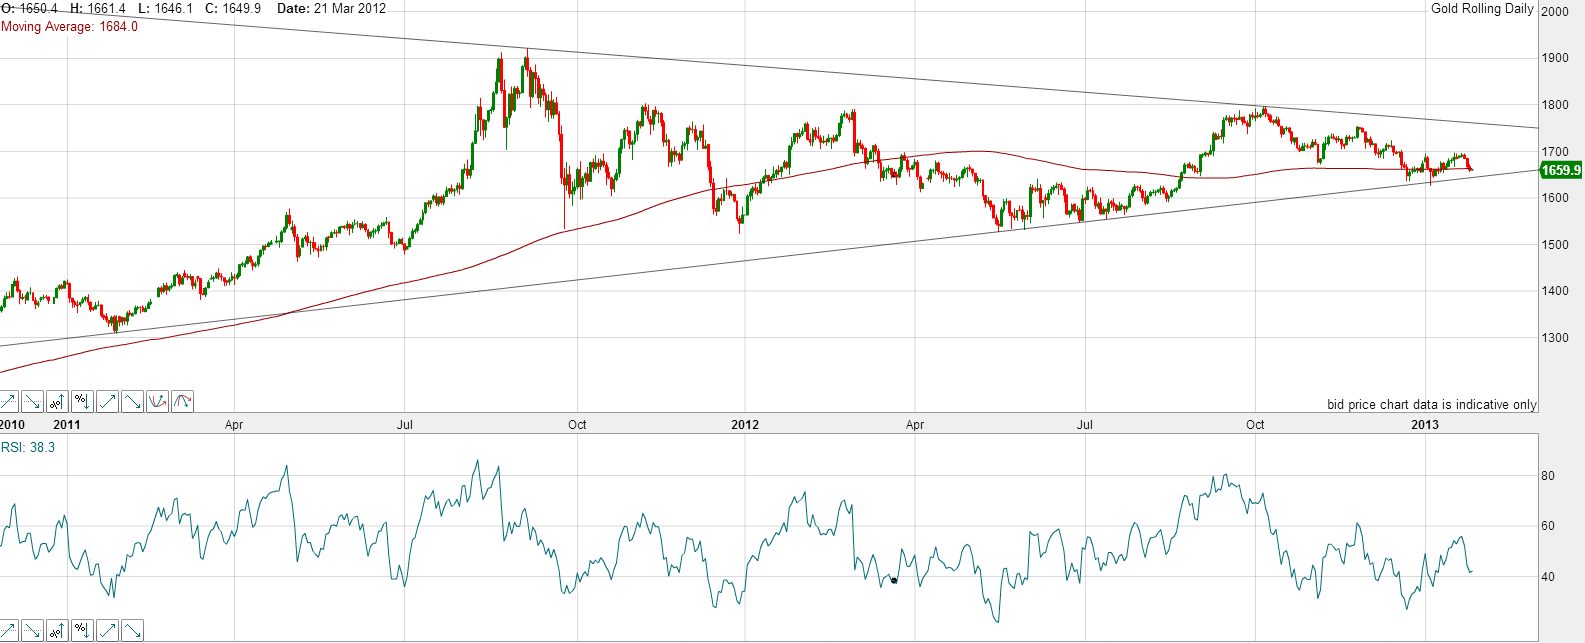 I believe this is all part of the last wash out of weak hands before the secular finale, in a patience-testing coil. To aid gold’s case, a pick up in inflation would put real interest rates further negative. As oil has made a decent up move recently, we could be at the start of such a process. But we still need that momentum move into wider commodities, and for commodities to start to outperform equities, for an acceleration in inflation and a scamper to hedge in precious metals.