
October ended with new marginal highs on the SP500, Dow and Nasdaq. The bottom line is: my analysis doesn’t change. Here’s why.
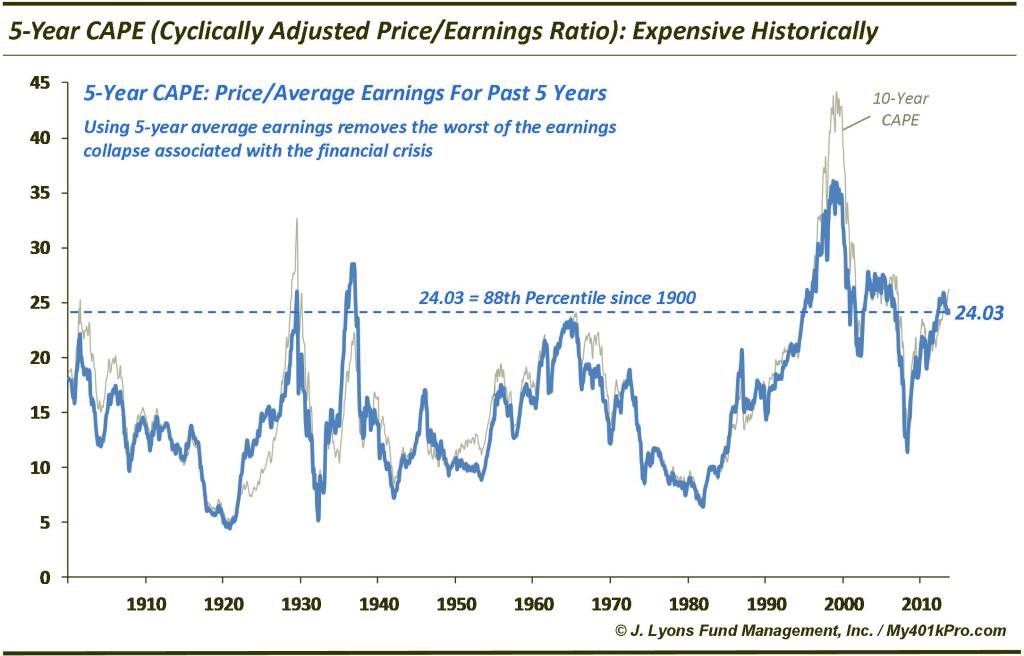
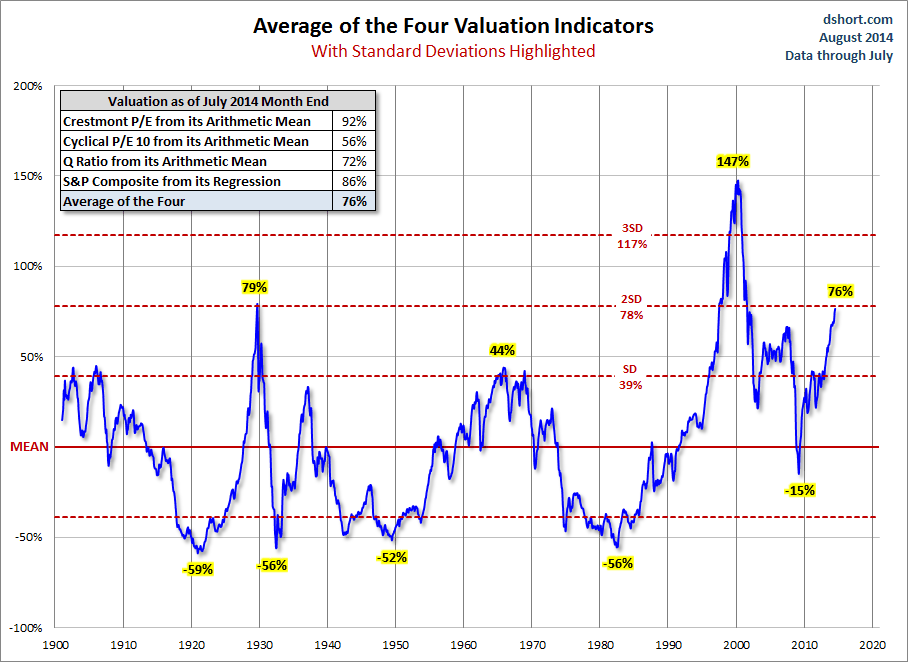
There are too many stock market topping indicators for this not to be a bull market peak. I refer you to this list:

We can add to this now that ECRI leading indicators have turned negative, financial conditions are in decline and we have various additional negative divergences.
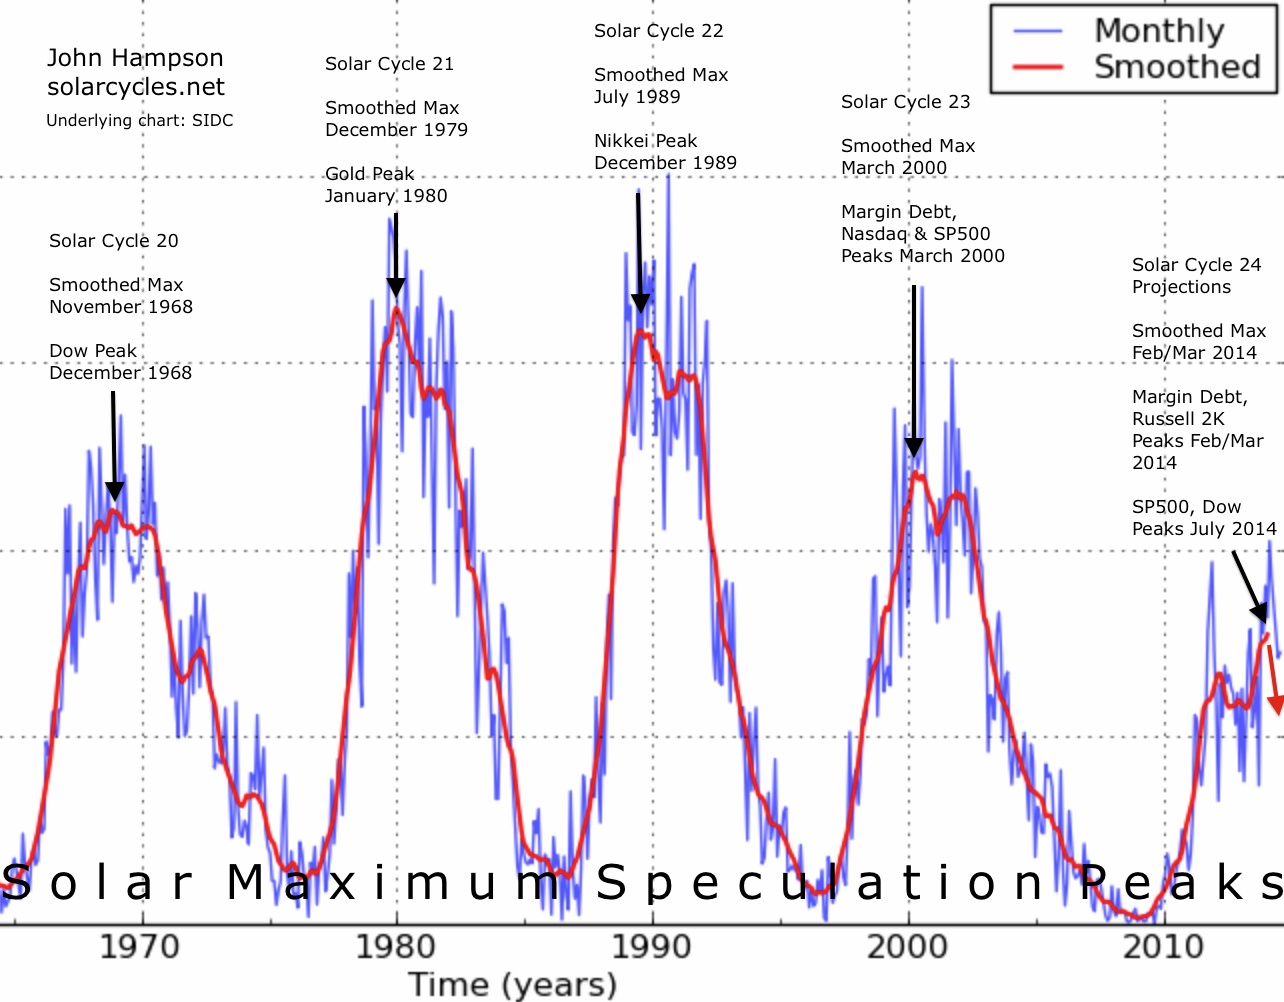
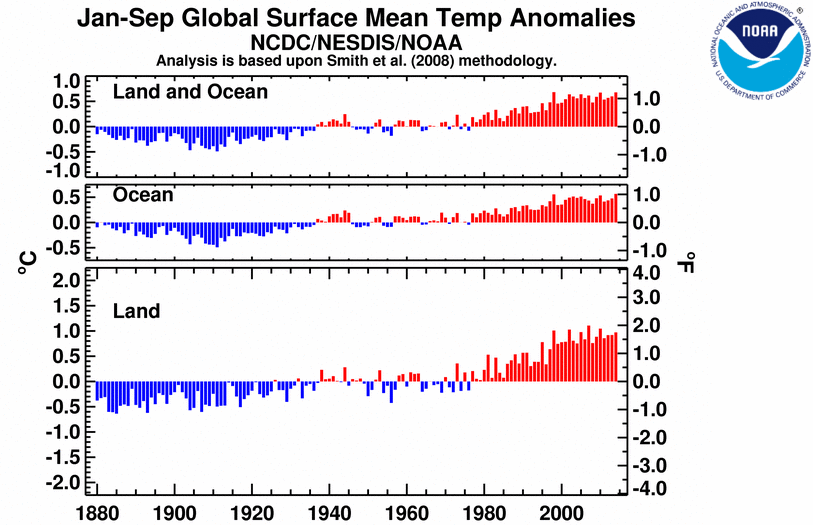
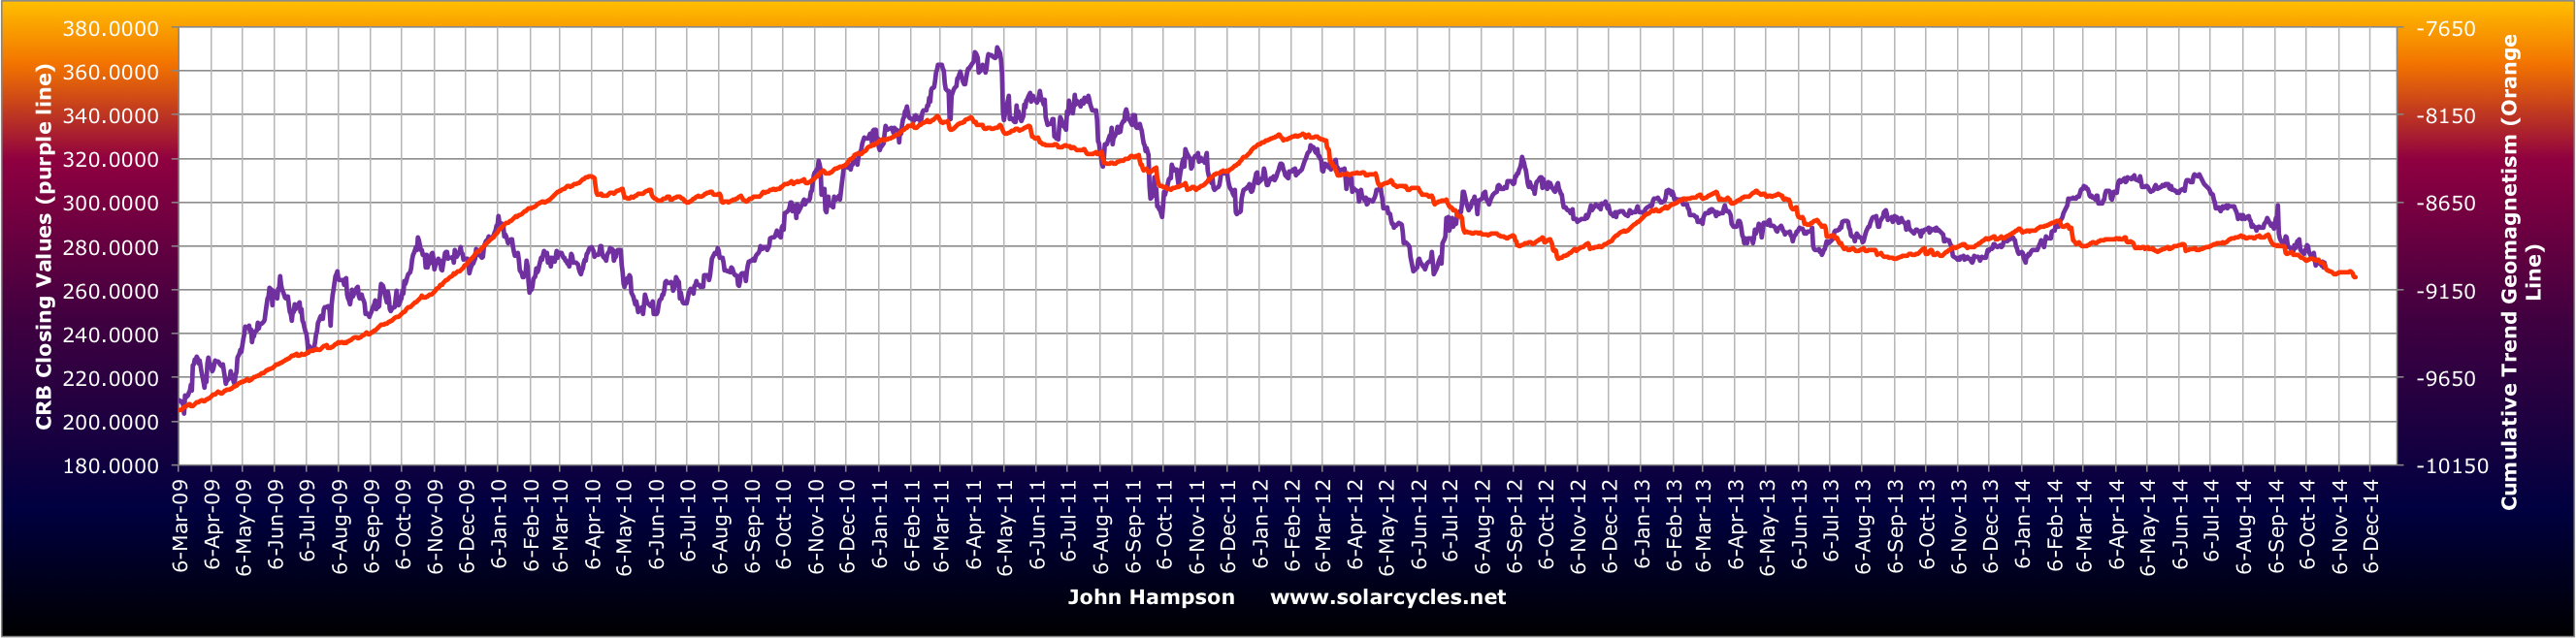
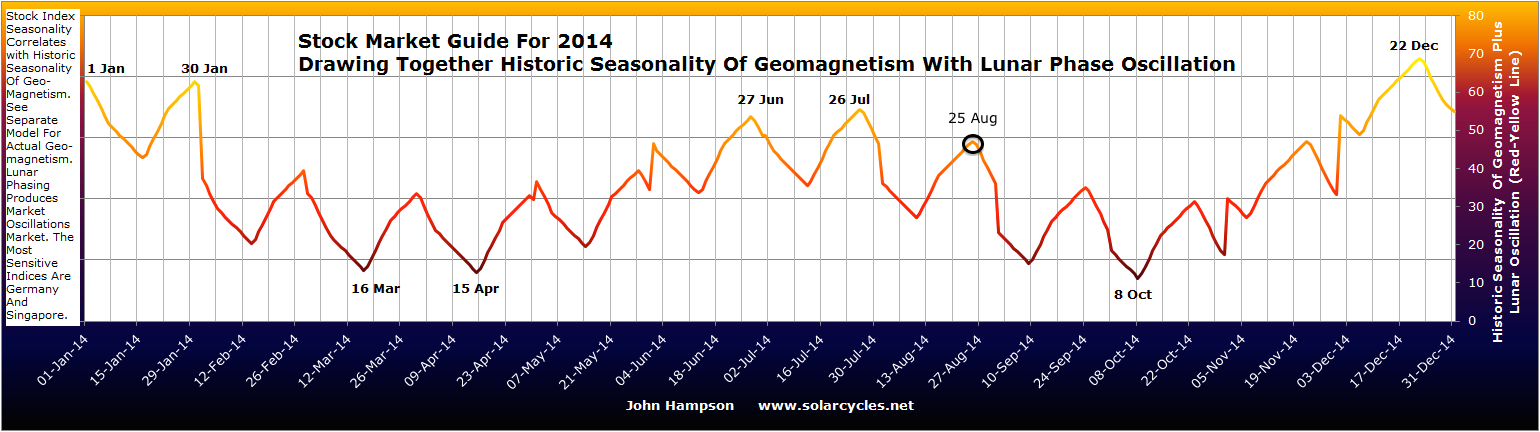
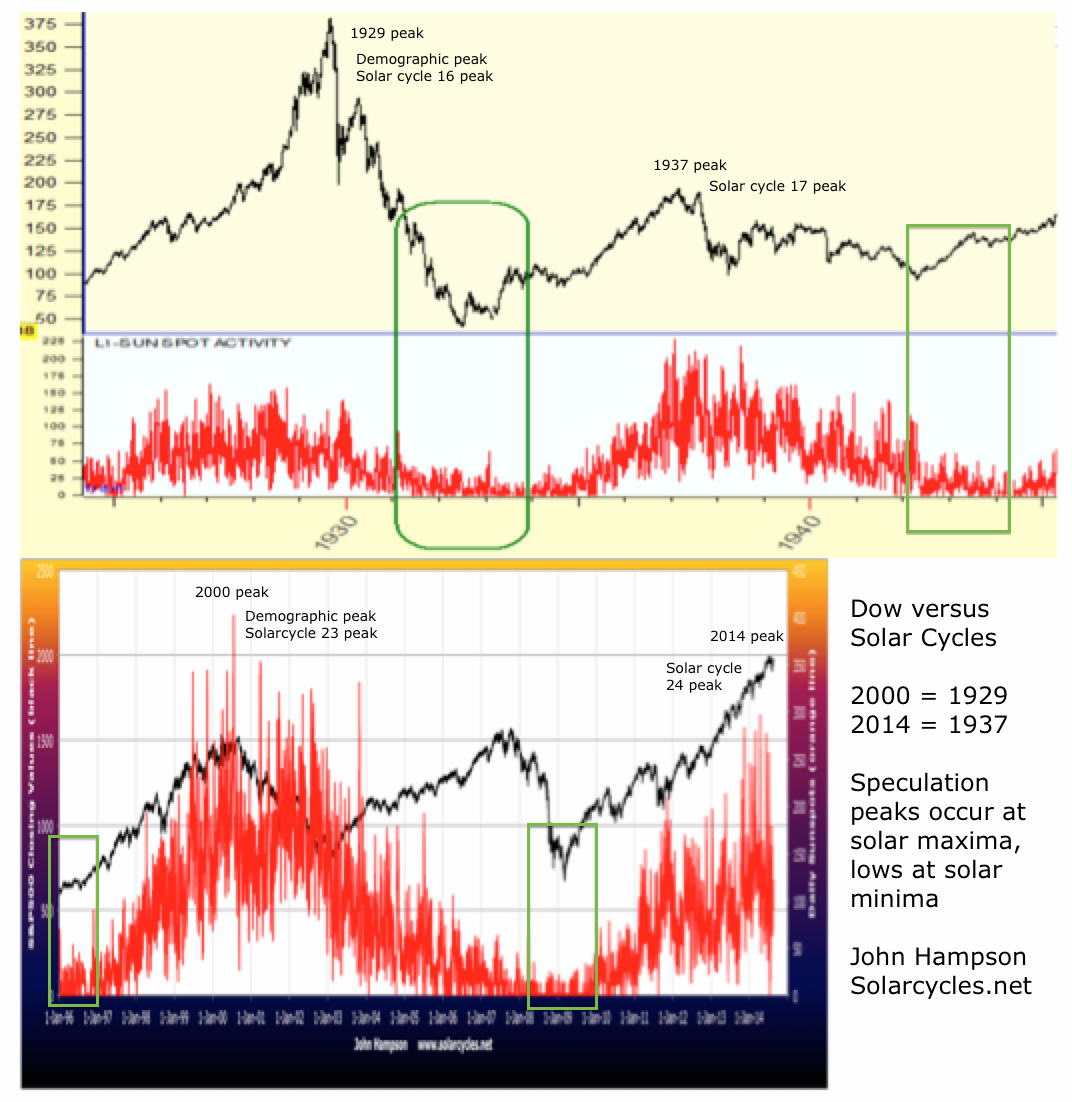
We can then cross-reference the list with the solar maximum for timing. Being able to refine with hindsight, the smoothed solar maximum looks likely to have been April 2014, with SIDC no longer running an alternative model with a higher high ahead. That puts the stock market on borrowed time since April.
 Source: Solen
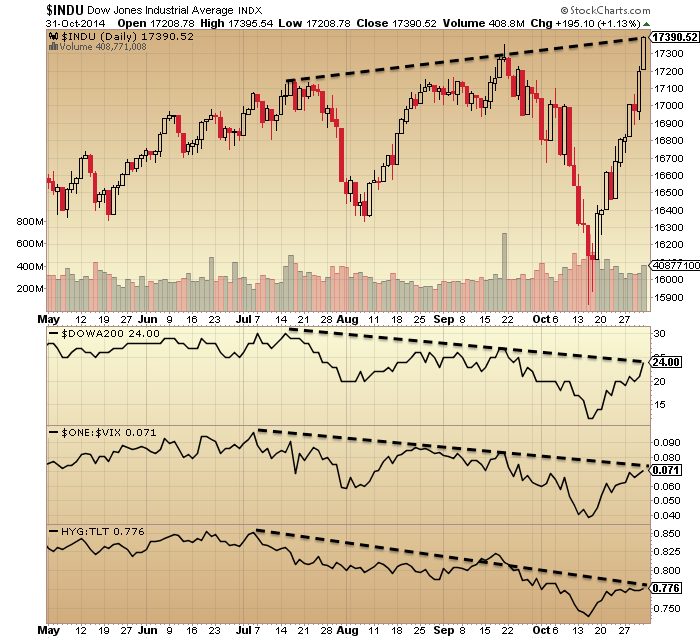
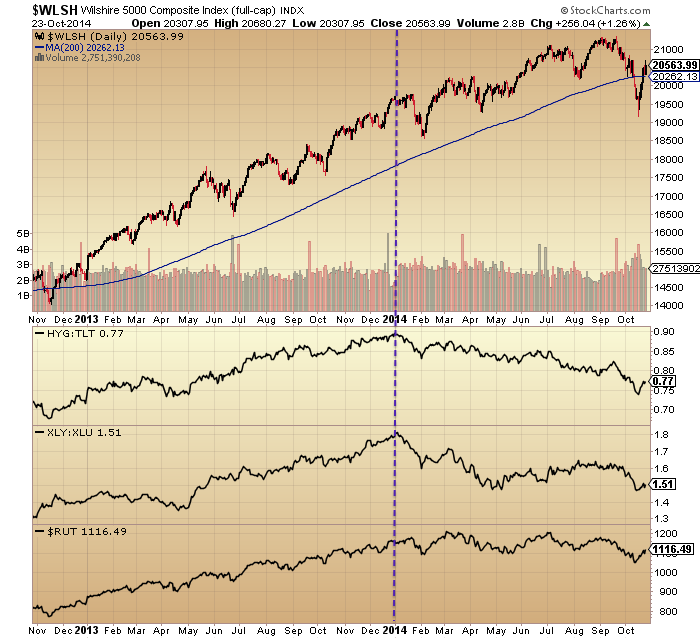
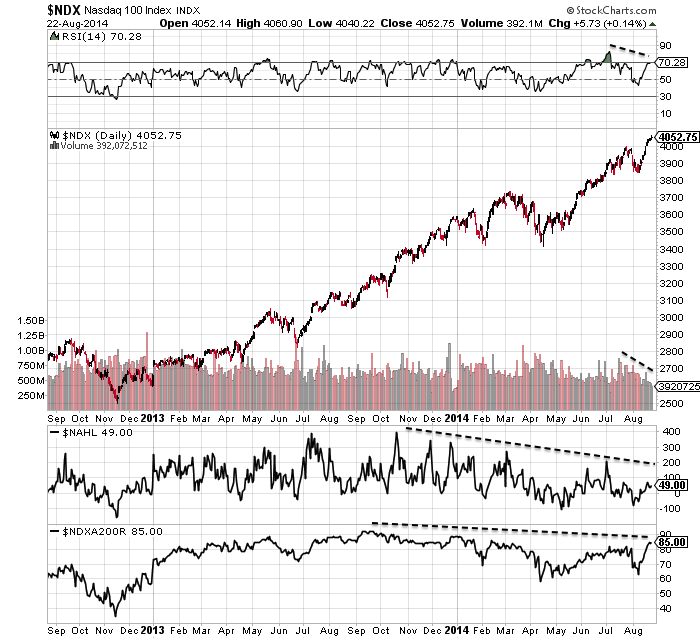
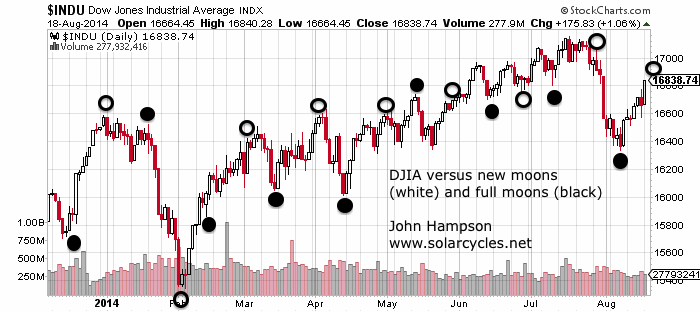
We have evidence the stock market topping process initiated 31 Dec 2013, with a persistent move to defensives since then.
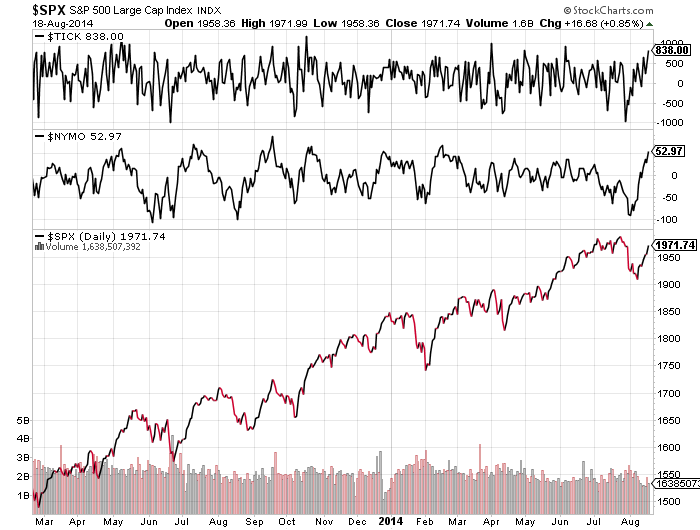
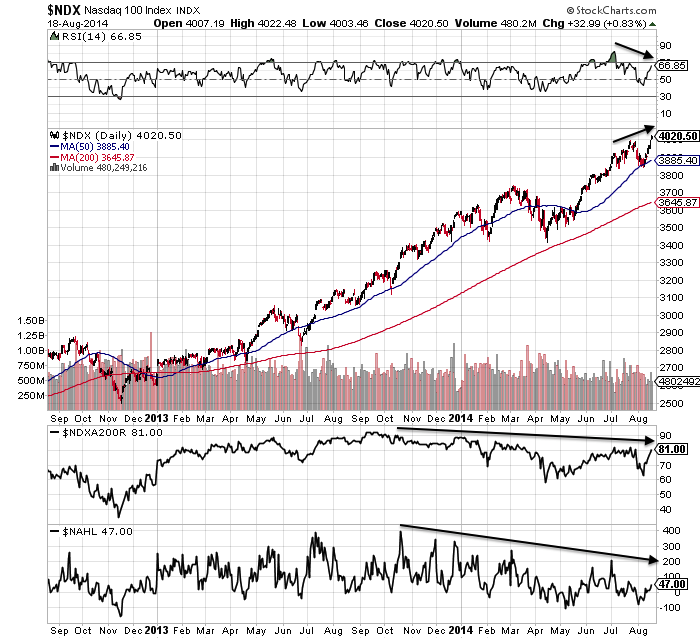
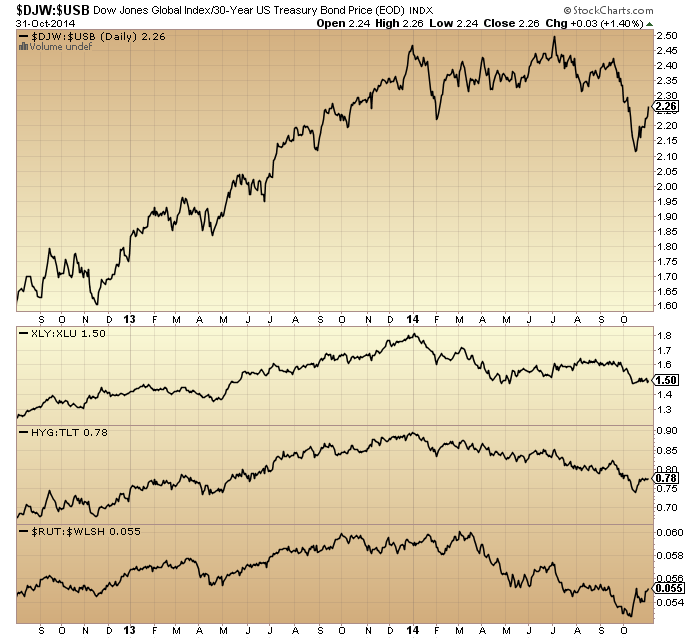 Source: Stockcharts
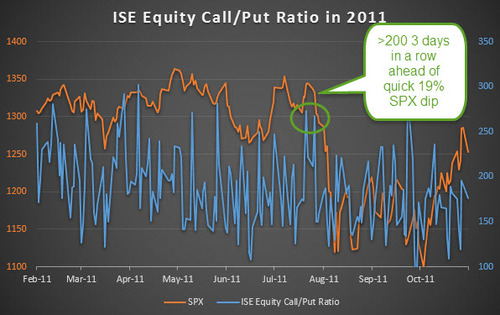
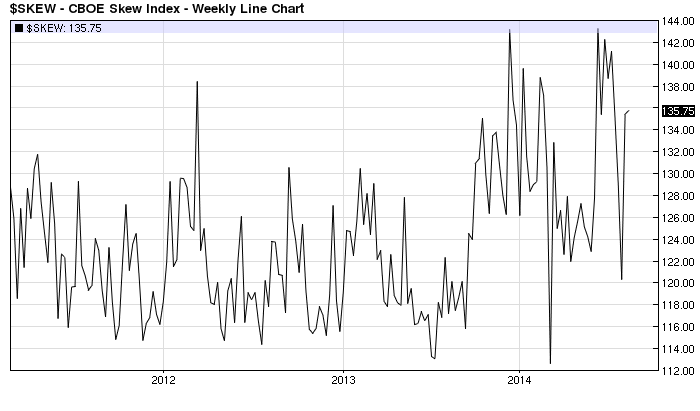
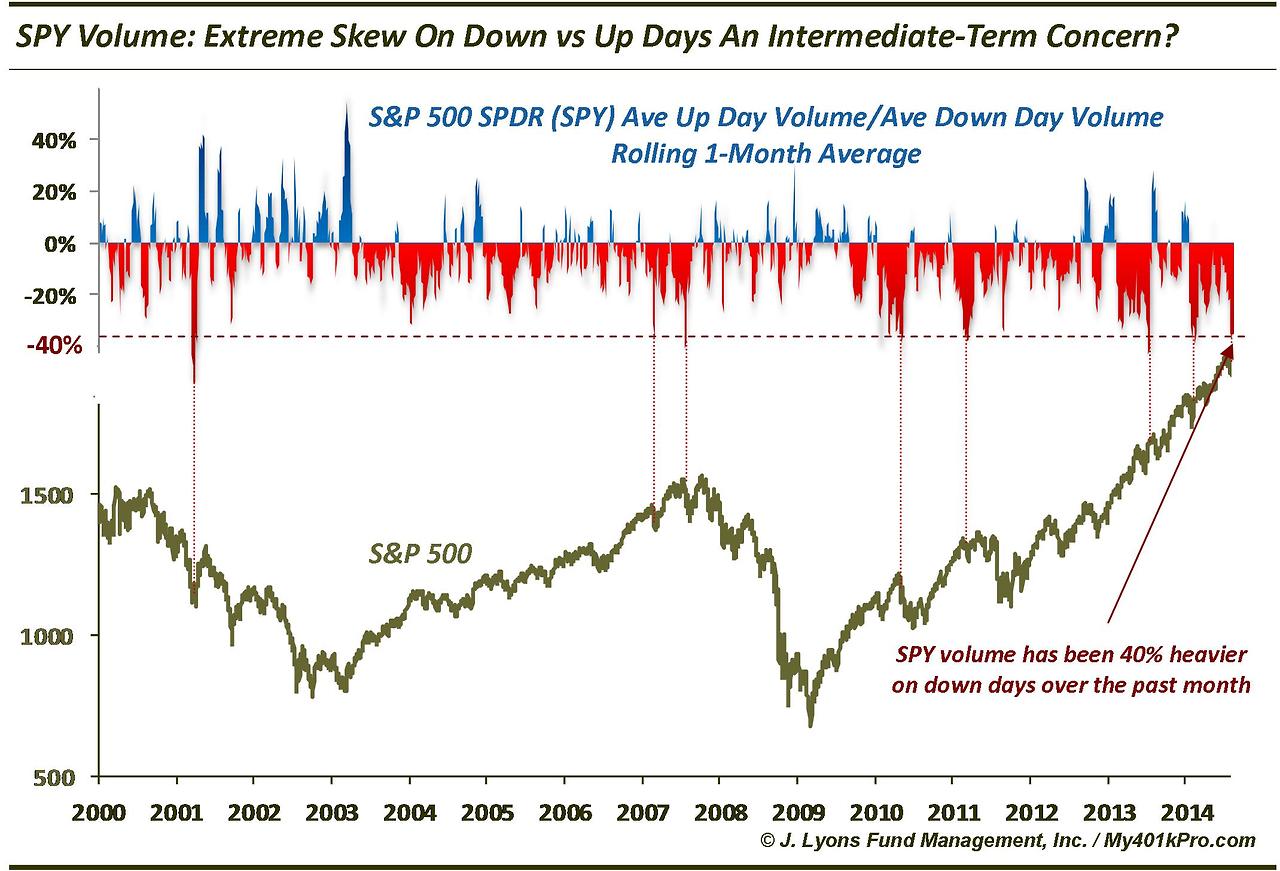
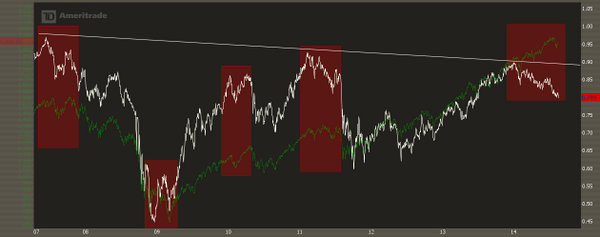
Plus dumb money flow took over from smart:
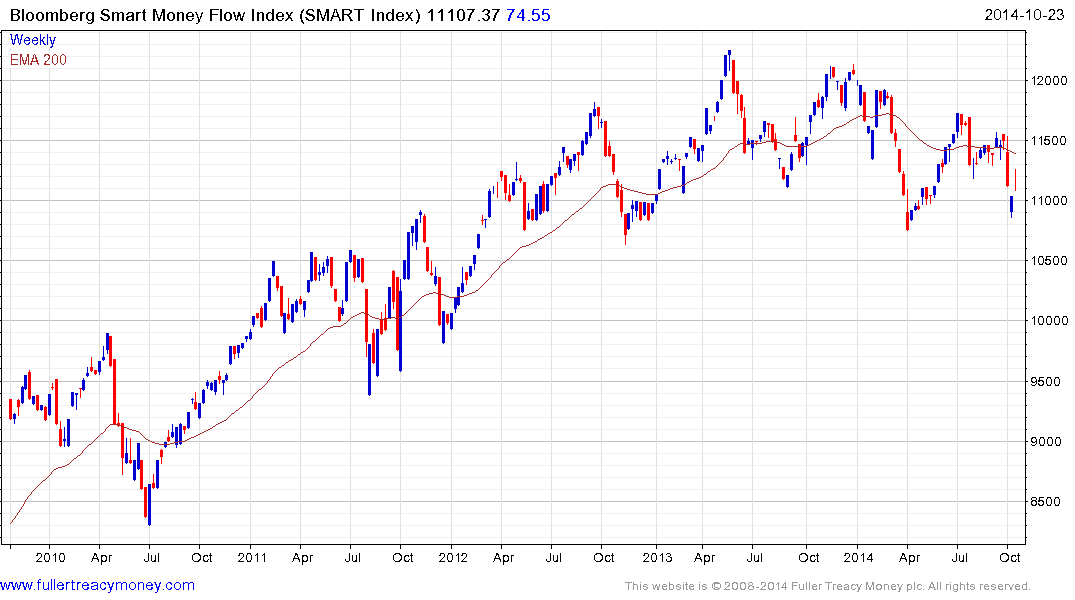 Source: Fullertreacymoney
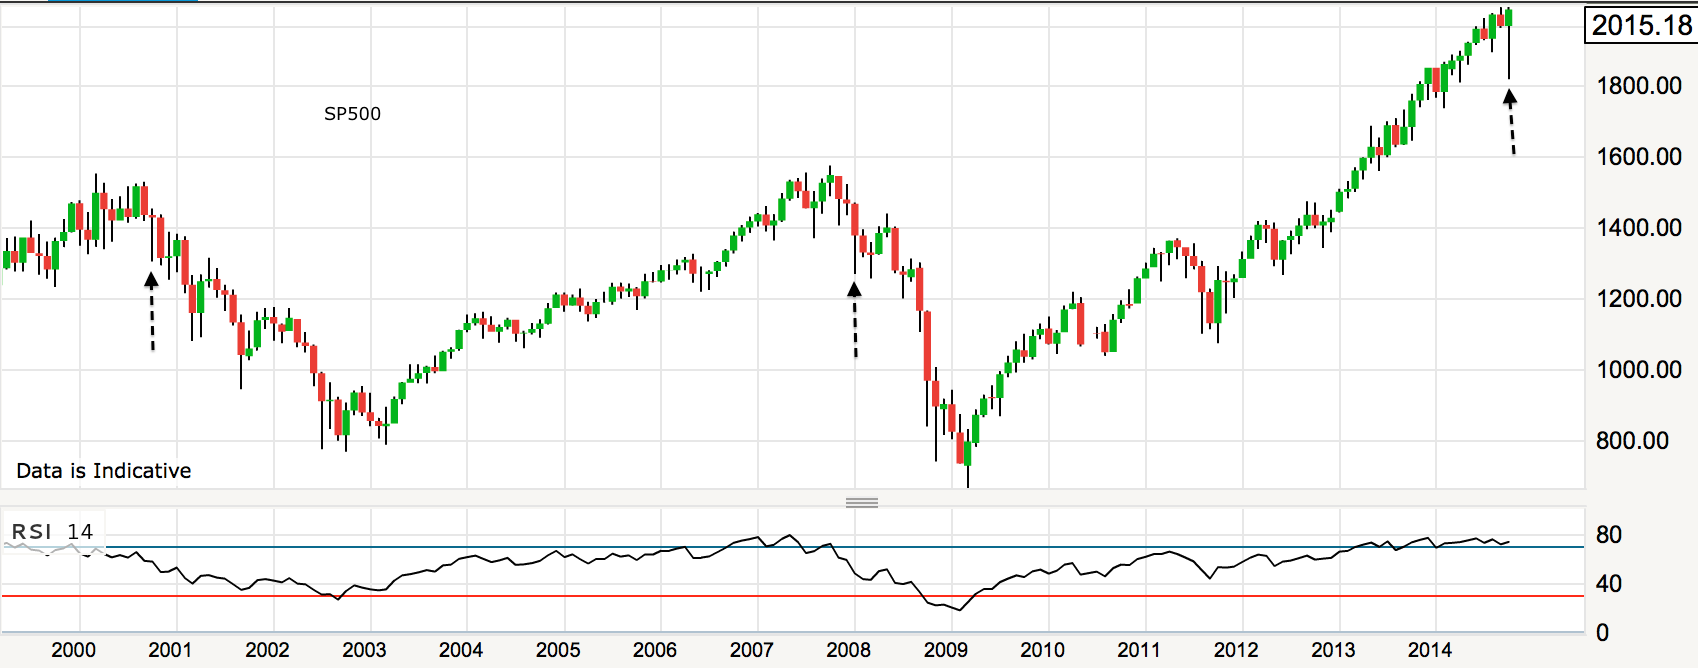
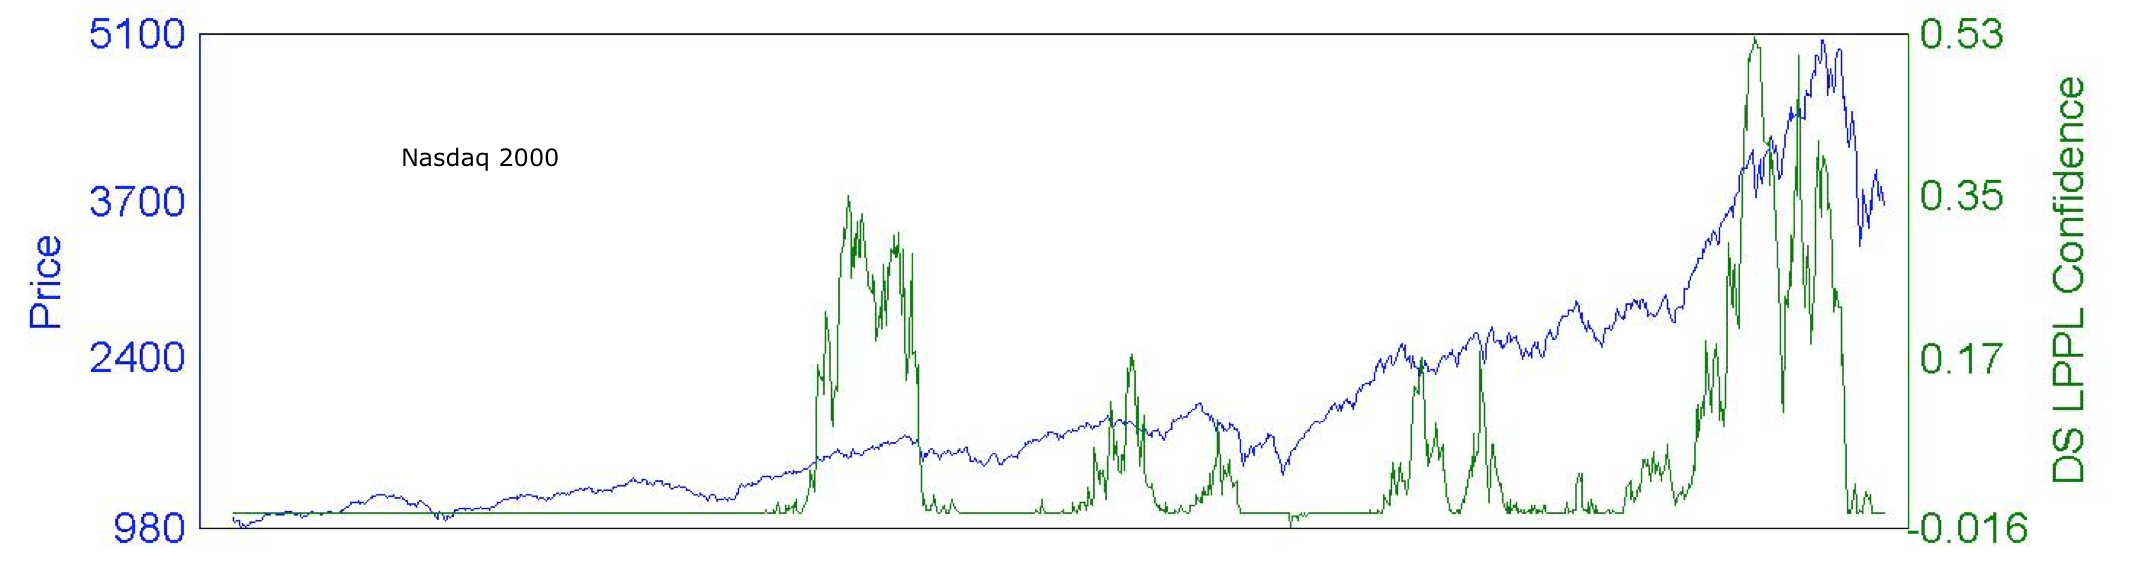
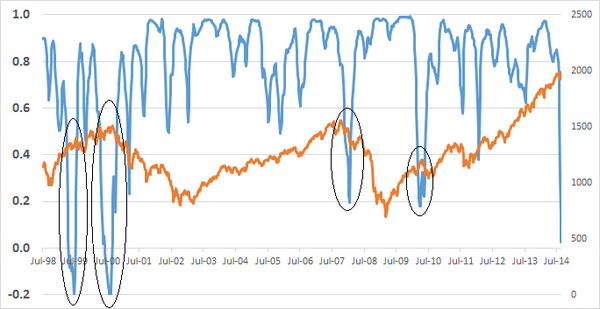
The stock market topping process appears to closely mirror the last solar/stocks peak of 2000, putting us right at the end of the process:

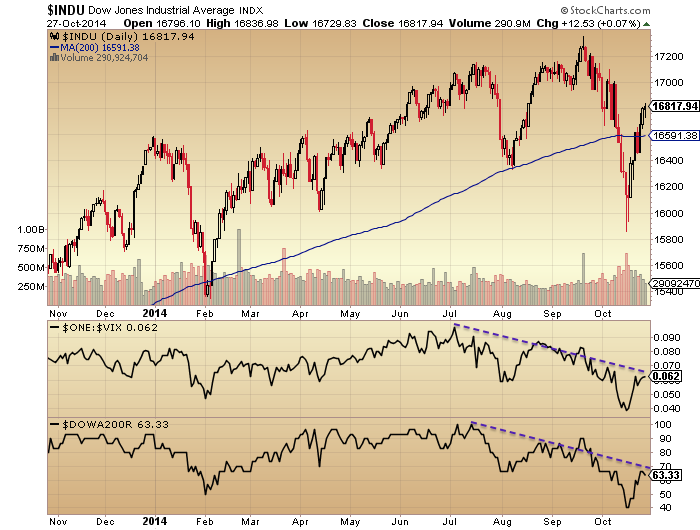
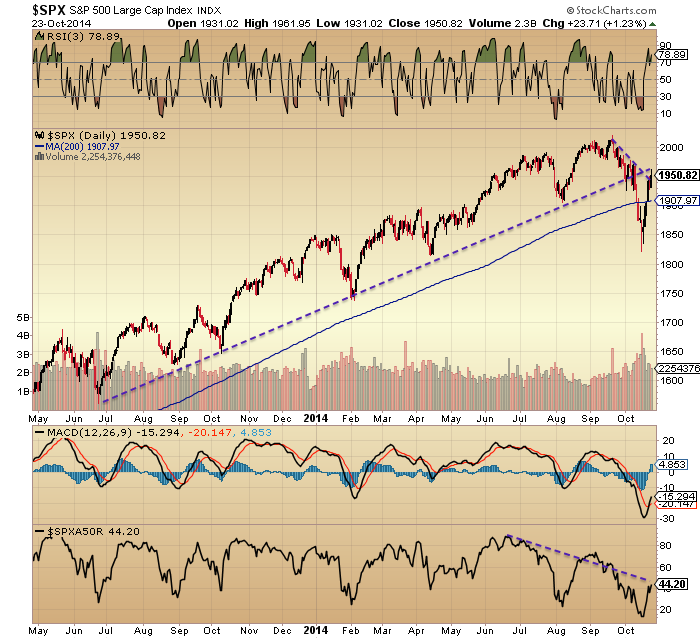
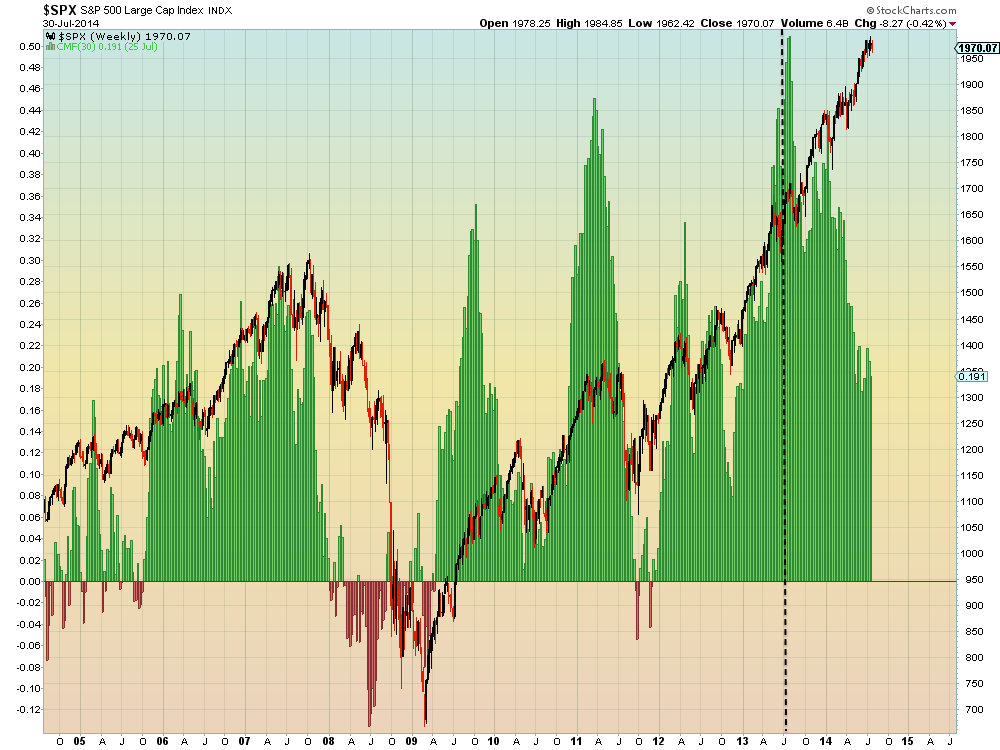
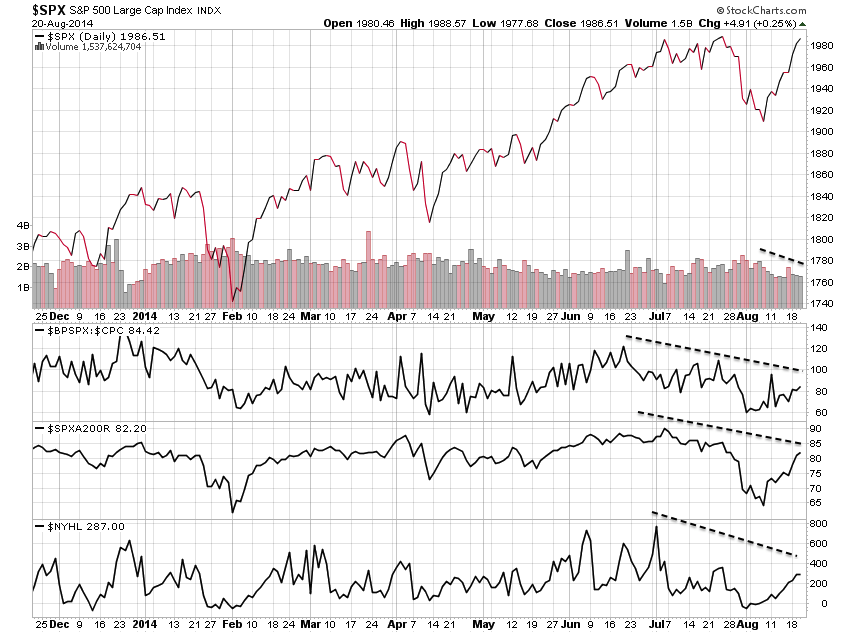
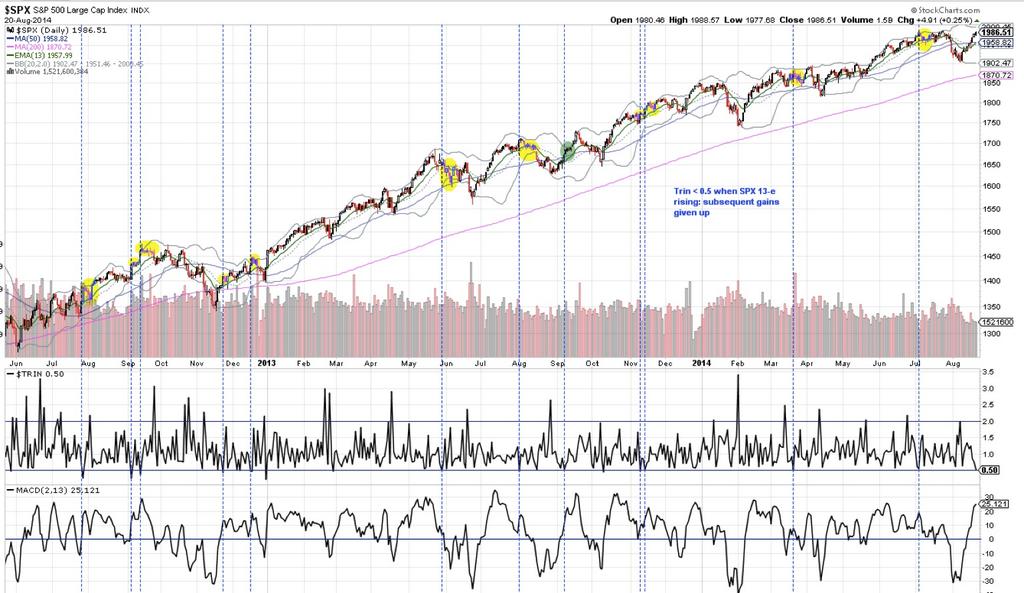
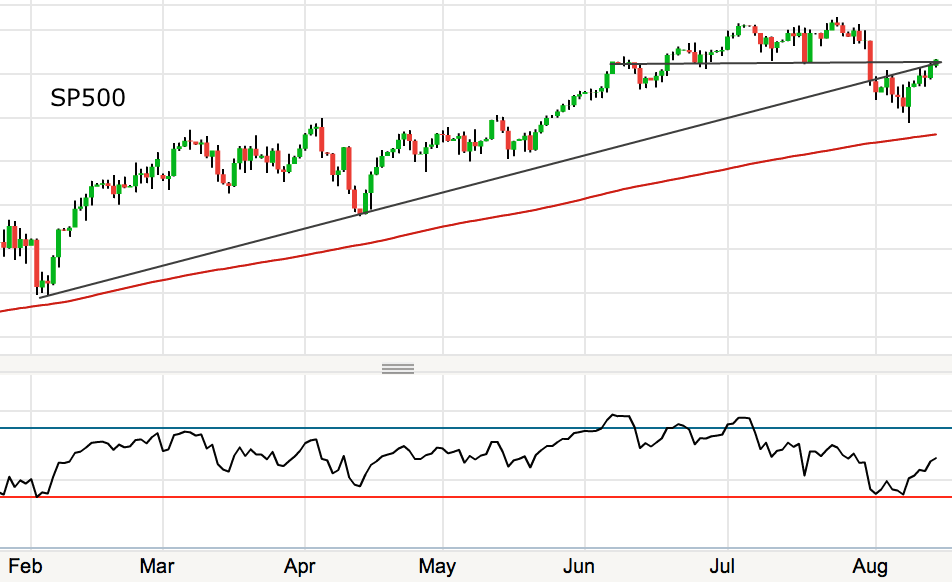
 The question mark is over the higher highs in price here in 2014. US large caps have now made yet another higher high in October. However, they do so on negative divergences, similar to 2011 or 2007’s peaking (just marginal highs on clear divergences).
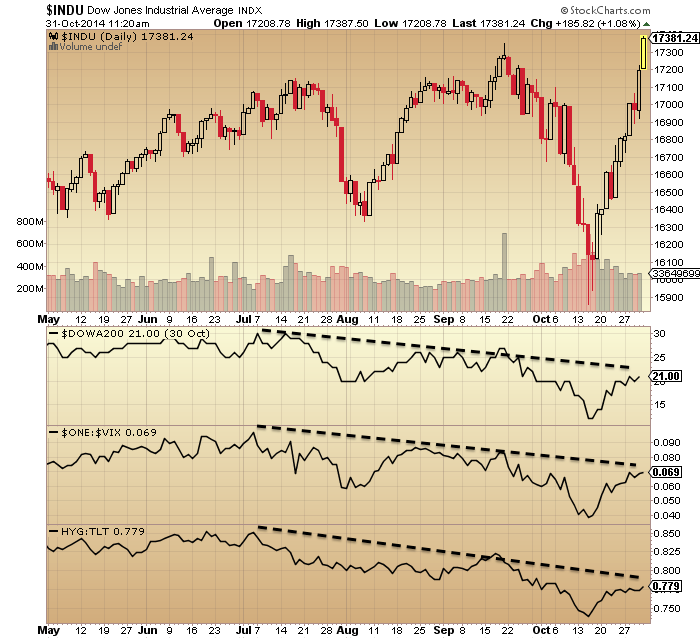
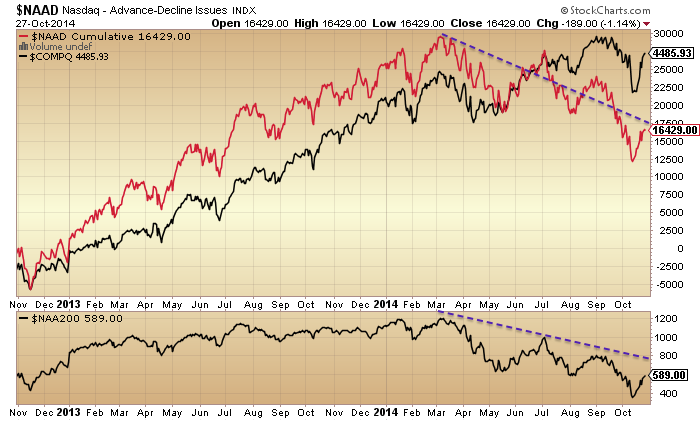
Indeed this powerful rally in price over the last two weeks is weak under the hood, with multiple further divergences:


 This rally ought to fail imminently, and this is backed up by overbought stats: Nymo hit over 80 on Friday for the second time in 5 days. Per Andrew Kassen, this twin-occurrence happened 9 times before, resulting in an 11% average fall, with 8 out of 9 of them turning down the day after this signal.
That means Friday’s gap up could turn out to be an exhaustion gap. But it’s fairly unequivocal: stocks ought to turn down at the start of this coming week, and being just several days from the full moon the pressure ought to be downward. We can draw into this picture the position in gold and miners, which appear to be capitulating on heavy volume:

Source: Dr.Cooper
The extremes reached echo the 2000 bottom:
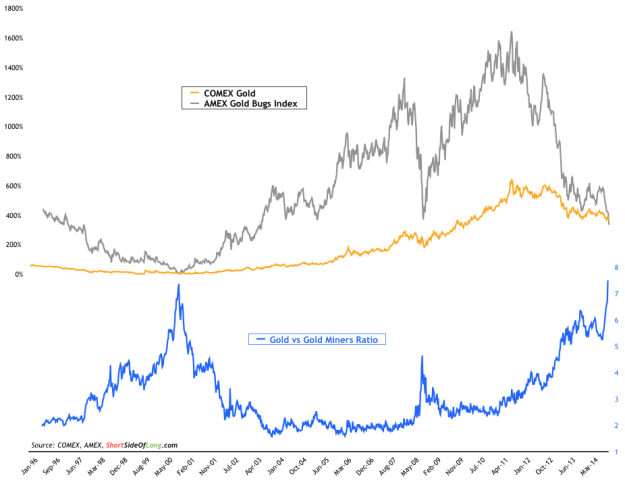
Source: ShortSideOfLong
I’m looking for a high volume intraday reversal candle on gold and miners to tie in with a peak in stocks.
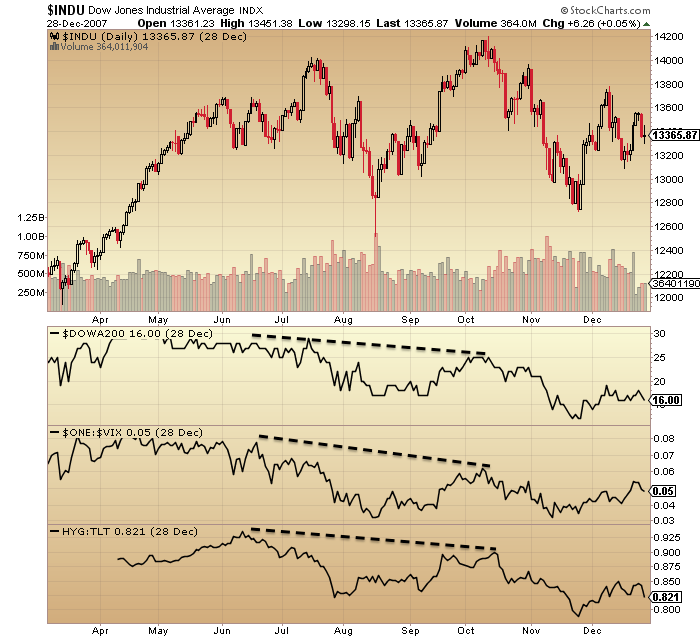
Also unequivocal is that November should be down, per the positioning in the topping process by multiple indicators. October 2014 is matched up with its counterparts in the last two major tops below:
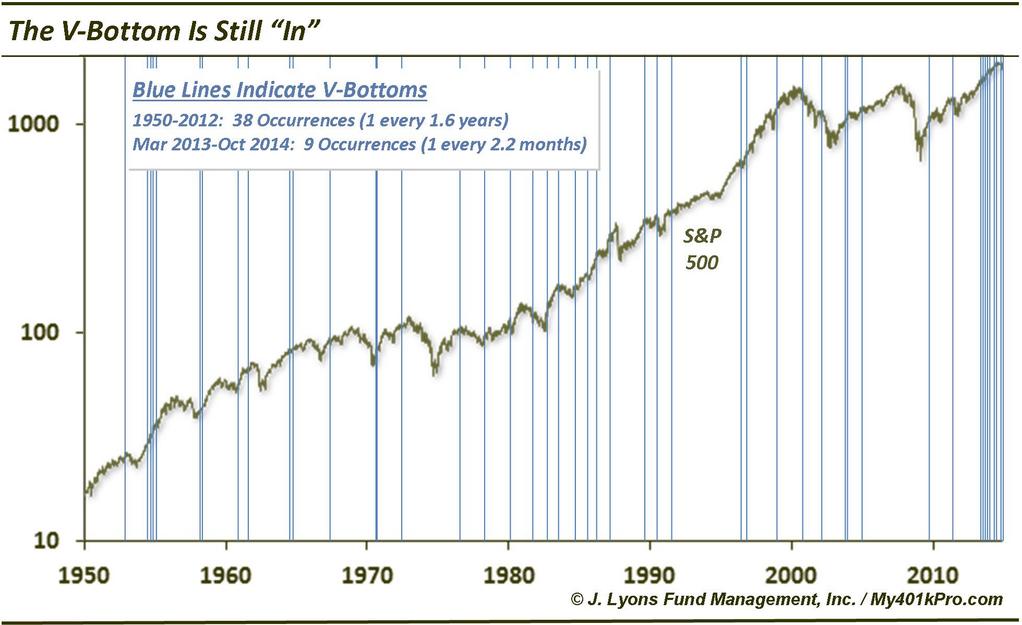
 The long tails look the same, but the candle tops do not. Things are different this time. Look at the clustering of V-bounces and of extreme lop-sided sentiment:
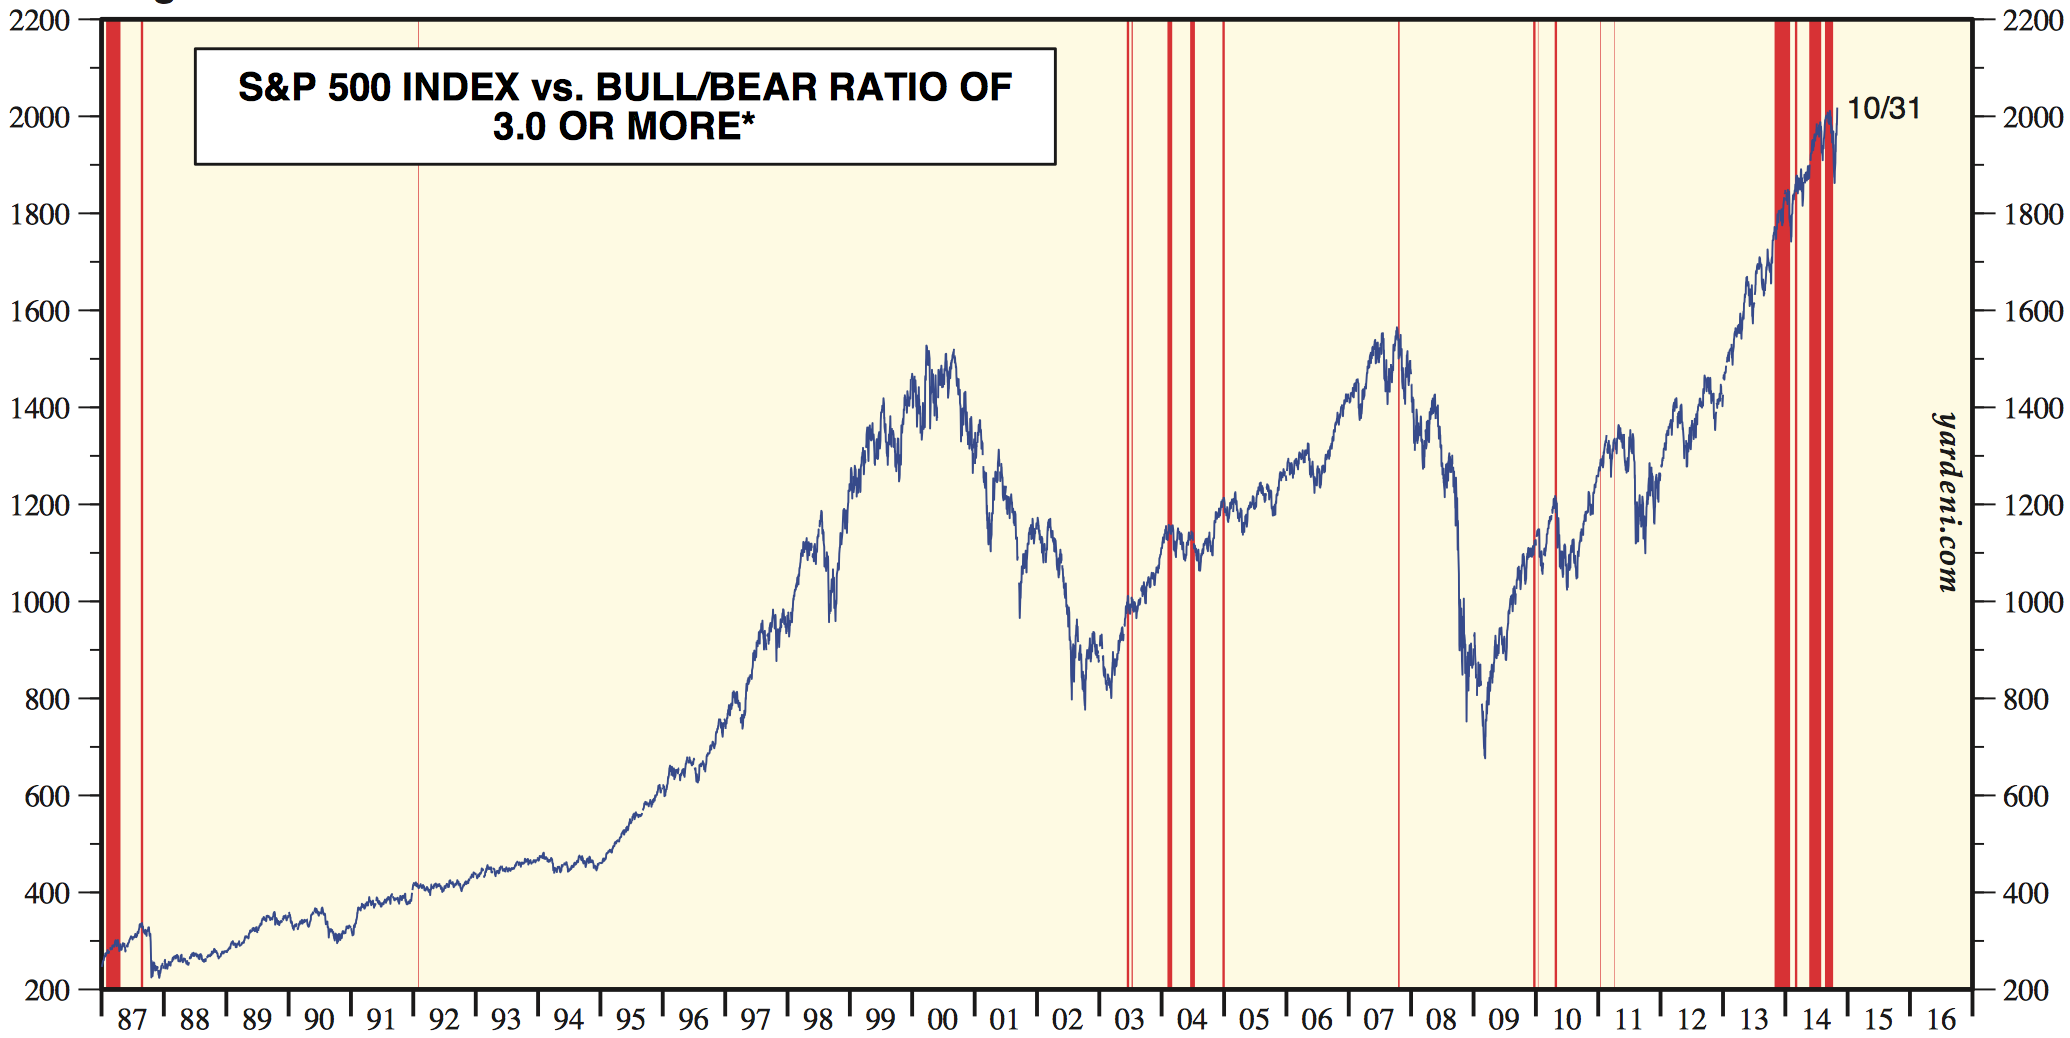
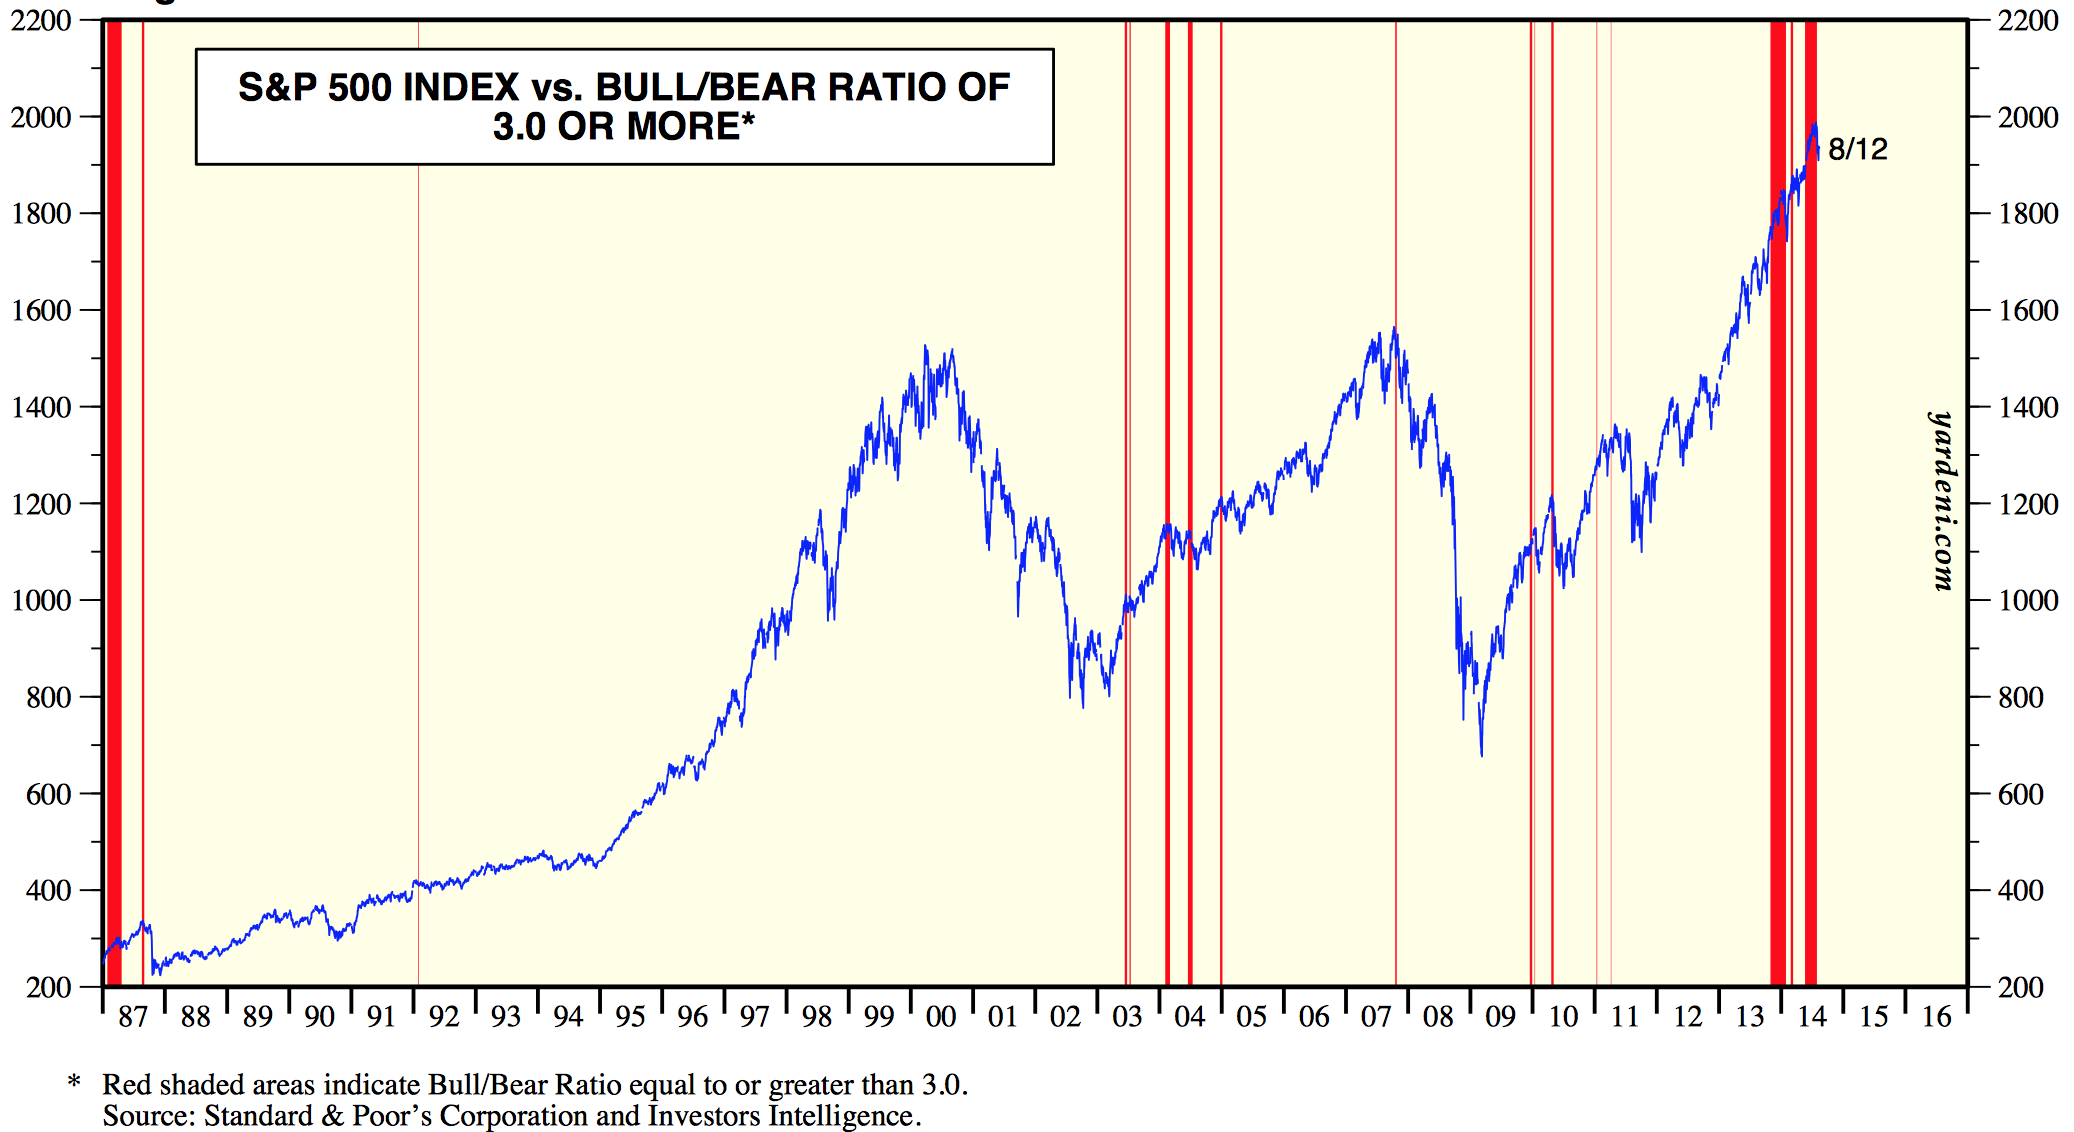
Source: Ed Yardeni
Unprecedented. It seems fairly certain that both are reflective of a mania but does it mean a stock market topping process won’t play out in the ‘usual’ way? It’s not easy to answer that without a historical precedent.
However, this brings us to the bull case which would advocate that central bank policies have caused this and postponed any bear market. Supporting this we have once again made new highs on large caps following a very strong buying-of-the dip, whilst seasonality is doubly positive from here into year end (geomagnetic, Presidential). The Japanese BOJ shocked the markets with increased QE and the Japanese pension fund announced increased purchases of Japanese equities. So is it a losing battle fighting such intervention and support? Could those 37 topping indicators shown above all be attributed to ZIRP and QE making equities the only home for a decent return, and therefore this time not actually signals for a market peak?
I just don’t believe that. If you don’t agree with me, then I’m fine with that: you’ll find plenty of bullish blogs to follow. Understand that I’m feeling the pain with a significant drawdown on my short positions, so it’s imperative that I try to be as objective as possible. Ultimately, this is about my money and my life. I go over and over the data and come to the same conclusions:
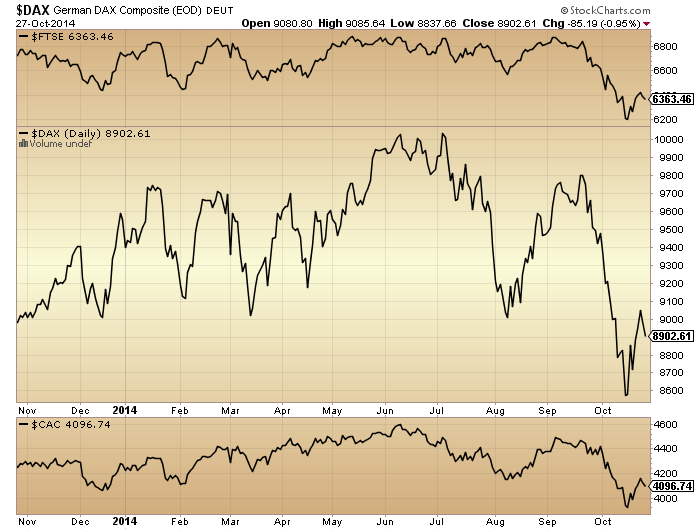
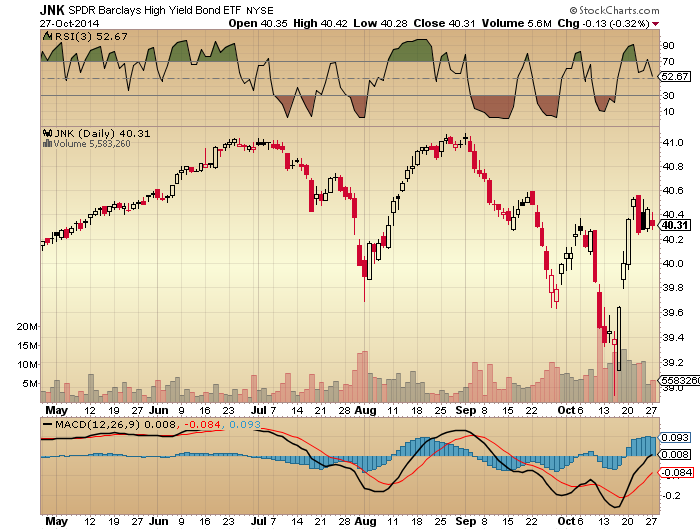
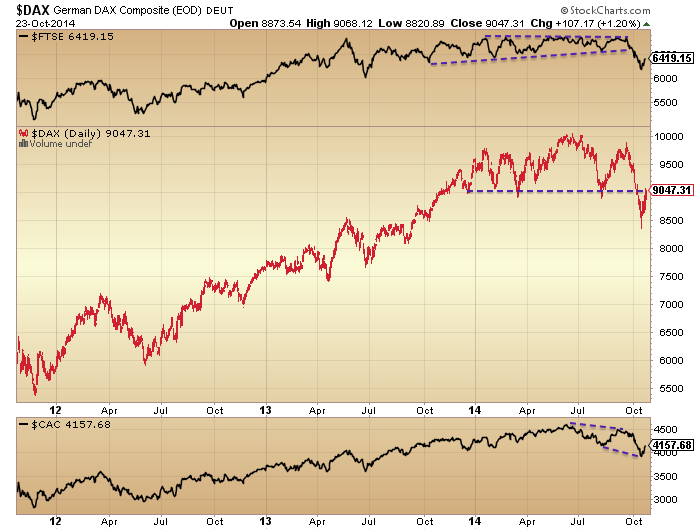
I see a large cluster of market topping indicators aligning with timing by solar maximum. I see multiple negative divergences on this last rally up. I see lower highs and lower lows on US small caps, European indices and junk bonds since July, making the price action in US large caps the anomaly that will be the last to resolve. I see a positioning by indicators right at the end of the topping process. I see a mantra for this mania of ‘central bank policy trumps all’.
Note: I would not want to be short Japanese equities here. I may go long this week with a stop if the Nikkei can hold its breakout. Japan is in a slight demographic tailwind window in contrast to the other majors, and the direct buying of stocks by the Government is notable.
But this doesn’t affect my view on US and European equities where I remain short, and gold where I remain long. By my analysis it’s fairly clear that a renewed turn-down in these stock indices and a capitulative low in precious metals should occur within the next few days and November should be a strong down month for stocks, as this is the only fit by indicators. If this doesn’t happen I will be stepping aside, closing positions and waiting. I am not being stubborn or wedded to a view, I just have such an overwhelming multi-angled bearish topping case that I think even if I was a total delusional, it has to be right.
So, it looks like we are making a megaphone top on the Dow and SP500. There is room for just a fraction higher into the top of the megaphone but the reversal ought to be close at hand. Nymo suggests as soon as Monday, so let’s see.


