
October ended with new marginal highs on the SP500, Dow and Nasdaq. The bottom line is: my analysis doesn’t change. Here’s why.
There are too many stock market topping indicators for this not to be a bull market peak. I refer you to this list:

We can add to this now that ECRI leading indicators have turned negative, financial conditions are in decline and we have various additional negative divergences.
We can then cross-reference the list with the solar maximum for timing. Being able to refine with hindsight, the smoothed solar maximum looks likely to have been April 2014, with SIDC no longer running an alternative model with a higher high ahead. That puts the stock market on borrowed time since April.
 Source: Solen
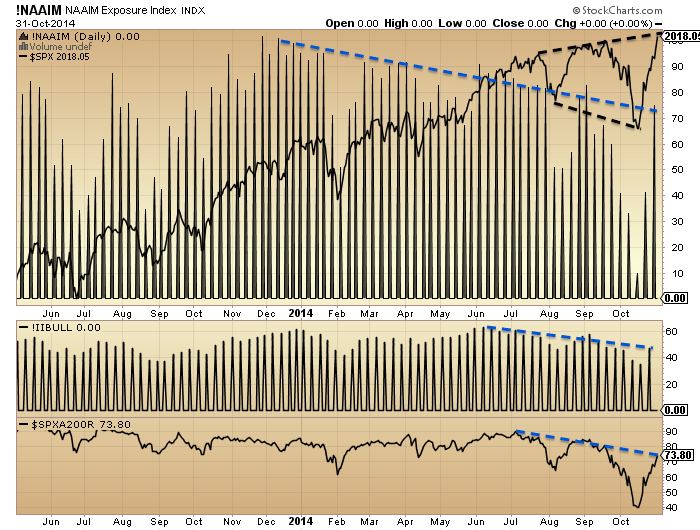
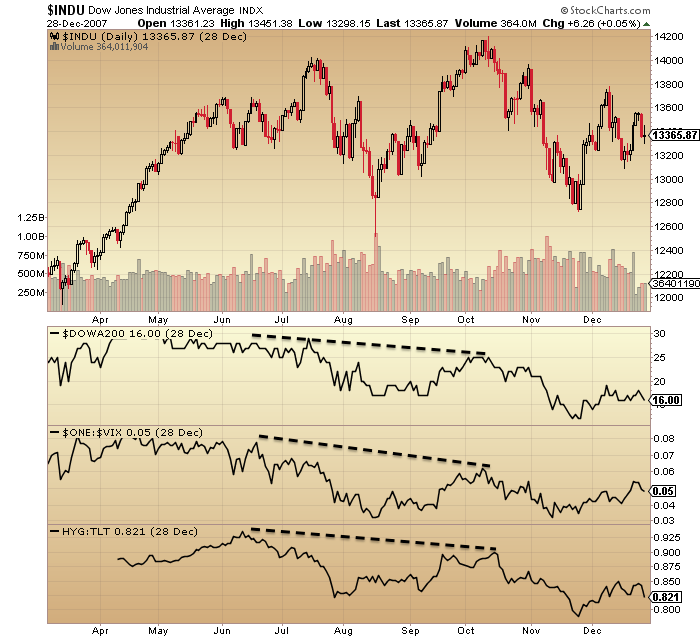
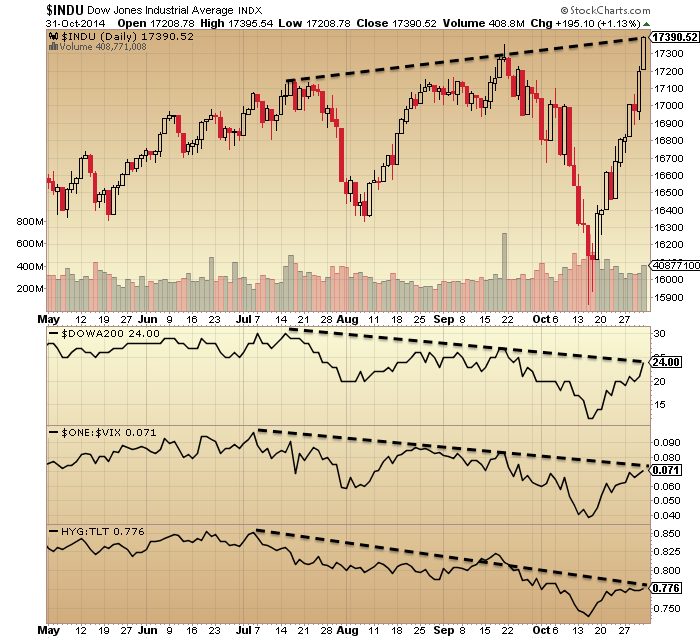
We have evidence the stock market topping process initiated 31 Dec 2013, with a persistent move to defensives since then.
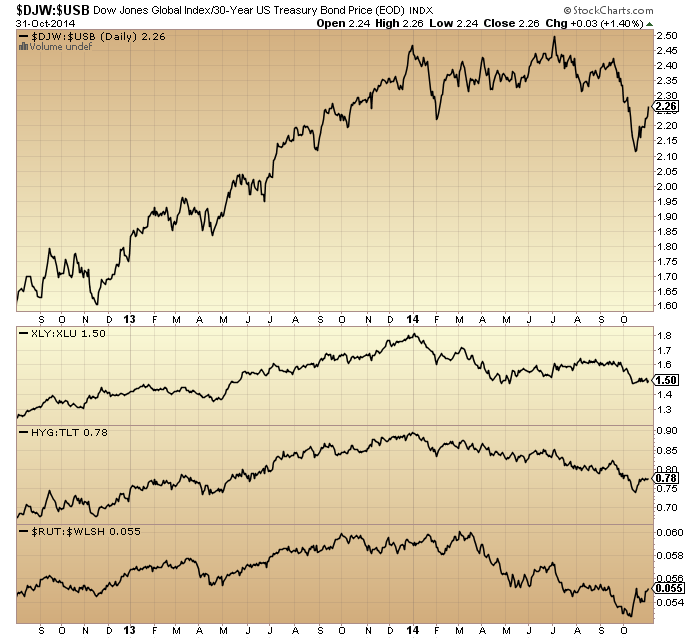 Source: Stockcharts
Plus dumb money flow took over from smart:
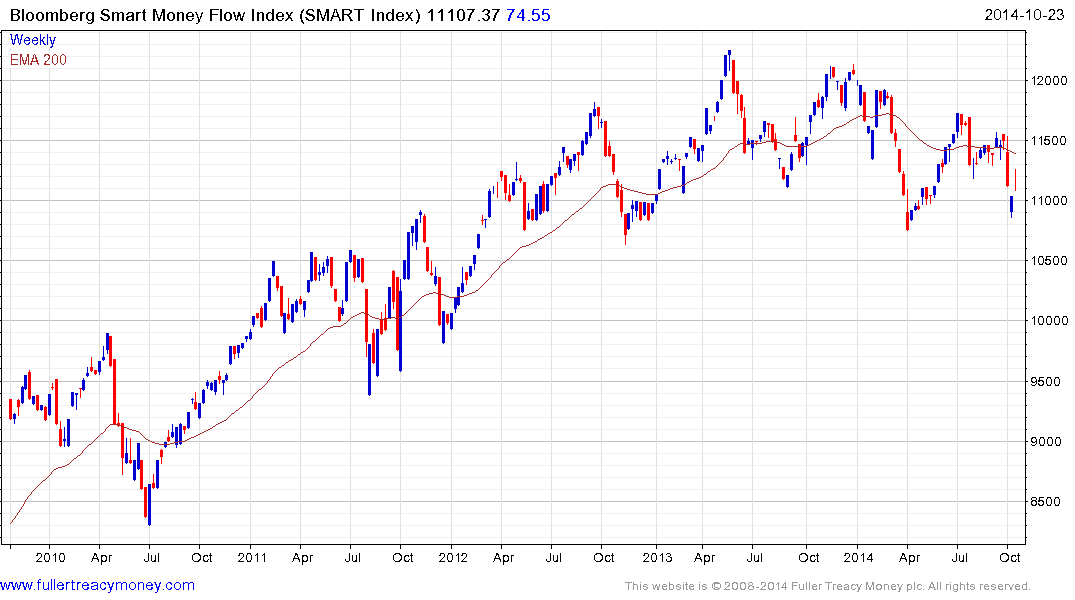 Source: Fullertreacymoney
The stock market topping process appears to closely mirror the last solar/stocks peak of 2000, putting us right at the end of the process:

 The question mark is over the higher highs in price here in 2014. US large caps have now made yet another higher high in October. However, they do so on negative divergences, similar to 2011 or 2007’s peaking (just marginal highs on clear divergences).
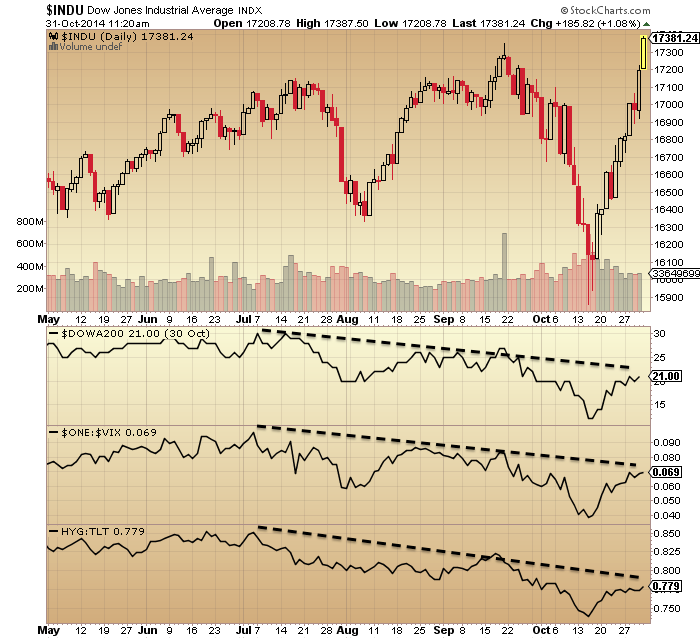
Indeed this powerful rally in price over the last two weeks is weak under the hood, with multiple further divergences:


 This rally ought to fail imminently, and this is backed up by overbought stats: Nymo hit over 80 on Friday for the second time in 5 days. Per Andrew Kassen, this twin-occurrence happened 9 times before, resulting in an 11% average fall, with 8 out of 9 of them turning down the day after this signal.
That means Friday’s gap up could turn out to be an exhaustion gap. But it’s fairly unequivocal: stocks ought to turn down at the start of this coming week, and being just several days from the full moon the pressure ought to be downward. We can draw into this picture the position in gold and miners, which appear to be capitulating on heavy volume:

Source: Dr.Cooper
The extremes reached echo the 2000 bottom:
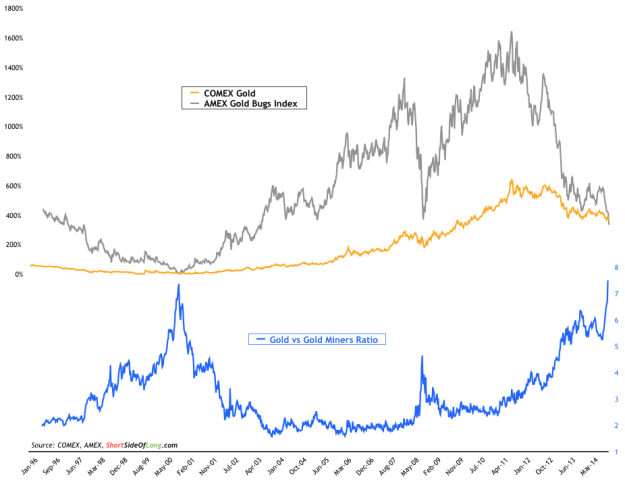
Source: ShortSideOfLong
I’m looking for a high volume intraday reversal candle on gold and miners to tie in with a peak in stocks.
Also unequivocal is that November should be down, per the positioning in the topping process by multiple indicators. October 2014 is matched up with its counterparts in the last two major tops below:
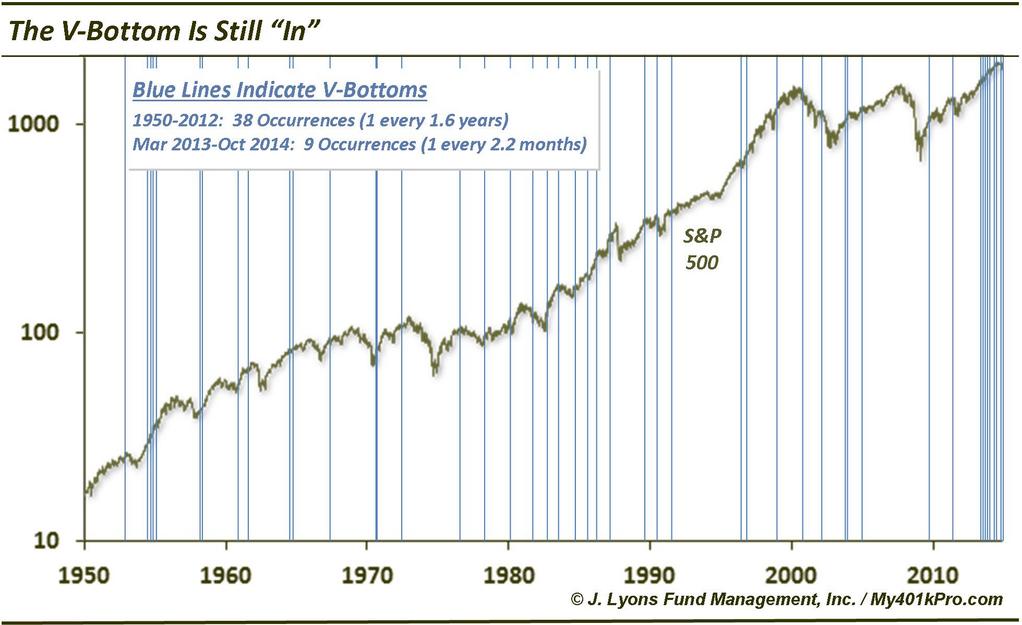
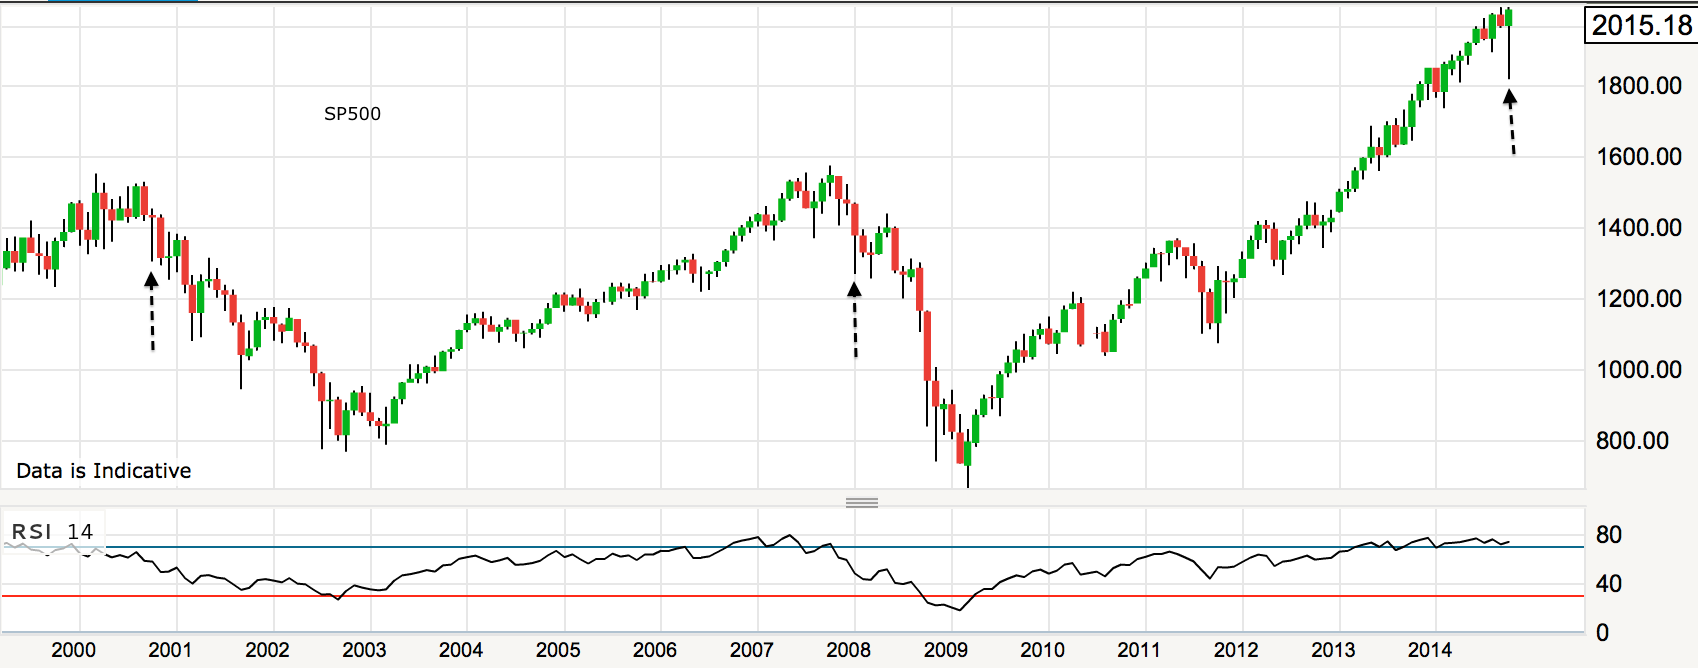 The long tails look the same, but the candle tops do not. Things are different this time. Look at the clustering of V-bounces and of extreme lop-sided sentiment:
Source: Ed Yardeni
Unprecedented. It seems fairly certain that both are reflective of a mania but does it mean a stock market topping process won’t play out in the ‘usual’ way? It’s not easy to answer that without a historical precedent.
However, this brings us to the bull case which would advocate that central bank policies have caused this and postponed any bear market. Supporting this we have once again made new highs on large caps following a very strong buying-of-the dip, whilst seasonality is doubly positive from here into year end (geomagnetic, Presidential). The Japanese BOJ shocked the markets with increased QE and the Japanese pension fund announced increased purchases of Japanese equities. So is it a losing battle fighting such intervention and support? Could those 37 topping indicators shown above all be attributed to ZIRP and QE making equities the only home for a decent return, and therefore this time not actually signals for a market peak?
I just don’t believe that. If you don’t agree with me, then I’m fine with that: you’ll find plenty of bullish blogs to follow. Understand that I’m feeling the pain with a significant drawdown on my short positions, so it’s imperative that I try to be as objective as possible. Ultimately, this is about my money and my life. I go over and over the data and come to the same conclusions:
I see a large cluster of market topping indicators aligning with timing by solar maximum. I see multiple negative divergences on this last rally up. I see lower highs and lower lows on US small caps, European indices and junk bonds since July, making the price action in US large caps the anomaly that will be the last to resolve. I see a positioning by indicators right at the end of the topping process. I see a mantra for this mania of ‘central bank policy trumps all’.
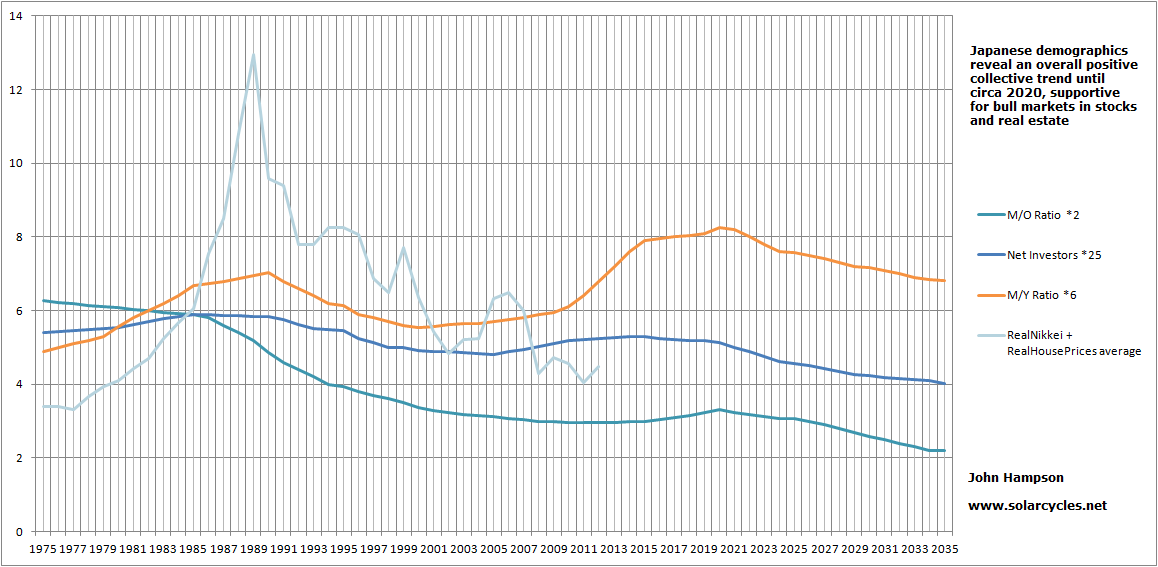
Note: I would not want to be short Japanese equities here. I may go long this week with a stop if the Nikkei can hold its breakout. Japan is in a slight demographic tailwind window in contrast to the other majors, and the direct buying of stocks by the Government is notable.
But this doesn’t affect my view on US and European equities where I remain short, and gold where I remain long. By my analysis it’s fairly clear that a renewed turn-down in these stock indices and a capitulative low in precious metals should occur within the next few days and November should be a strong down month for stocks, as this is the only fit by indicators. If this doesn’t happen I will be stepping aside, closing positions and waiting. I am not being stubborn or wedded to a view, I just have such an overwhelming multi-angled bearish topping case that I think even if I was a total delusional, it has to be right.
So, it looks like we are making a megaphone top on the Dow and SP500. There is room for just a fraction higher into the top of the megaphone but the reversal ought to be close at hand. Nymo suggests as soon as Monday, so let’s see.


First!
Thank you John!
The Dow closed above 17143 providing another buy signal yesterday and that warned of a move further to the upside. Especially when we fell right to the Bearish Reversal at 15960 and held. Exceeding Thursday’s high is a serious issue. We now must realize that exceeding the September high intraday will signal we just may be in store for an awesome Sling-Shot Move to the upside – that’s a run-away that takes out the lows and then runs through the highs.
http://armstrongeconomics.com/2014/10/31/dow-jones-omg-a-possible-sling-shot-move/
Here, NOV 1, MA says the Dow did NOT exceed and close above the Sept high, which it clearly did! And, he said the Sept high was 17042.90, which it wasn’t.
Do you think he means the futures? Confused…
http://armstrongeconomics.com/2014/11/01/analysis-v-funds-management/
John,
I am with you in pain. I have some put options that have been cut in half from last weeks nonsense. I have time and plenty of dry powder. I did not panic. I have been stalking this bear since January when I went to cash.
I have a friend that does cycle analysis and basically he has seen 4 topping set ups this year that have been erased by manipulative efforts. What is interesting is that the set ups are coming faster and faster. Clearly the central banks are aware of technical set ups. They think that if they can erase them it will be fine. In my view this is nature vs man. Nature always wins. I agree with you that November will be a strong down month. In fact I think it is going to scare the living crap out of most people.
I will be adding cash shorts along with my puts on Monday and Tuesday.
Best and thanks for your blog posts.
Great, thoroughly admirable post. Thank you
Went short big this past week. Will load up more with calls on SDS and VIX, and straight up TVIX and NGUT at the open.
Granted something might break, but I’m not sure we get much more than 20% before the end of this year, with a follow up decline of 60% more next year. It is playing out more like 2007-2008.
There is only three things that are “real money” in the present global economy, dollars, US treasuries, and gold. Aussi, NZ, Swiss Frank can not add much. With the shortage of the first two, some spill over into gold will happen.
So, is what Japan doing an act of war against China, or a well thought out collusion of Central Bankers?
Does a country that buys 20,000 tons of gold, really want its currency to be weak?
20,000 tons!! who? usa has largest reserves of 8000 tons (supposedly)
Depends on whether you count private holdings as reserves. If so, 20,000 is a fair estimate for China. Combined, the ESCB is the largest official holder by far.
well greedometer guy has been spot on with his recent short then long at 1828 and hes now gone short again with a 60-70% decline over next 18months prediction
Great post. So many negative indicators, but we still keep going up. Credit isn’t confirming this move either.
Yes on record USA and Germany are the official largest holders of Gold in reserve.
China only hold 1000 tonnes, but that data is 2009 figures, no official update for 5 years.
can we be sure about Germany? Didn’t they ask for their gold back from the US and there’s been a… ahem… “delay” in that process? How much of their gold had the US been holding? If the US has misappropriated it (that is, stolen it), then Germany may no longer be one of the largest holders.
There is rumours that an official figure for China gold reserves will be released showing it’s tripled it’s holdings to 3000 /4000 tonnes. Even if it repatriated it’s holding from the USA it will still only be the second largest holder after the USA.
An interesting and informative post, thanks.
I share your views, and many other commentators I respect (John Hussman notably) believe this is all part of the topping process.
Also, Martin Armstrong’s computer seems to have come down on the side of a dip/crash into mid-November, and then back up to the end of the year, and a bear beginning in earnest early next year.
I also think we just saw capitulation at last in the HUI, but to a level that provided support back in the early 2000s and again in 2008 (c.150)
http://finance.yahoo.com/echarts?s=HUI+Interactive#%22range%22%3A%22max%22%2C%22lineType%22%3A%22candlestick%22%2C%22indicators%22%3A%22rsi%22%3A%5B%22id%22%3A%22rsi14%22%2C%22name%22%3A%22rsi%22%2C%22params%22%3A%5B14%5D%2C%22lineType%22%3A%22line%22%2C%22color%22%3A%22%23cc4125%22%2C%22weight%22%3A1%5D%2C%22scale%22%3A%22linear%22
If you’re curious as to how the world escapes the coming deflationary collapse, have a look at these:
http://www.ecb.europa.eu/pub/pdf/other/20130910_zijlstra.en.pdf
and
https://twitter.com/_piripi_/status/479919327018102784
Traders will not likely benefit, only holders of the *real thing*
Regards.
John, thank you very much for your profound analysis.
As to the timing of the top, take a look at Chris Puplava’s actual article on financial sense. The monthly MACD is moving sideways and it has to cut its signal line to indicate the beginning of a bear market as it did in 2000 and 2007/8. I assume the NYMO indication will lead to a pullback. Depending on how deep this will be the monthly MACD will cut or won’t. Sometimes it appears that very simple things can tell the most and be the most reliable.
But you are right, for the European indices this signal has already flashed months ago.
The big take away lesson from John’s post today is that–for better or worse–what we trade is our BELIEFS; whatever they are.
Charles that is such a true and profound statement! Many people do not trade the market according to the price action they see on the screen. Instead they trade according to their beliefs some of which may be baseless.
It is okay to have a belief in what direction the market will go but the market price action needs to confirm that belief. Otherwise that just amounts to standing in front of a moving freight train.
After 18 months of consolidation, gold broke thru 1183 on Friday. The miners broke below the bottom rail of a bearish falling wedge on Friday. The carnage isn’t ending, it’s only beginning. The downward pressure in this sector is enormous and only going to get uglier. I think it’s pretty clear the BOJ will crush the yen, no matter the cost. And because gold tracks the yen so closely, the entire sector is in annihilation phase. The retail investor who believed gold would protect them from the inflation that never materialized or even government corruption has sadly been on the wrong side of the trade since 2011. They are the ones who will provide the constant selling.
The traditional business cycle needs to complete. That’s a year from now. Although Armstrong’s computers project a low in gold in the fall 2015, I’m not convinced it will be an investable sector even then. Maybe the 11 year cycle completed this move and we are actually in a bear market til 2020. Recall it took 20 years from the 1980 peak to wring out the excesses of the previous bull.
There is no honor among thieves. Just unbelievable what foreign central banks are doing… Follow the leader. Next up, what will/can the ECB do? There is suppose to be a meeting/announcement on Nov. 4. Watch carefully.
John, no one has worked harder or put forth such valid, solid arguments. Your effort is unparalleled. As long as the printing continues, and the policies blatantly state they will throw it into ETFs, they win. This will end one day, but not soon enuff. Please protect yourself.
I heard the same arguments in 2000 and 2008… Gold triumphed. This time different? I don’t think so.
WW, 2000 corresponds with the Gann’s MTF 60 YR and 30 year cycles. 1951 was a major top and 60 years later 2011 was also. 2000 was a major low as was 1970 and 1940, approximately. Gold is over due for a bear mkt rally, but nothing big til 2016. I do not understand why you are bullish on gold. Do you expect the economy to take off and inflation to roar? Possible, but seems unlikely. The most probable case for a gold rally would be a deflationary scare like 2008, followed by a big rally as the CB’s go crazy like Japan is doing now. It seems that would see a crash low like 2008.
you nailed it Alexa, gold follows the $/yen very close (inverse relationship). you would think with the large stimulus from BOJ, pressure on ECB to flat out QE and who knows what Yellen is doing, why is gold getting hammered?…take a close look at the $/yen.
Great post Alexa. I remember back in 2008 when stocks were dropping, Robert Prechter said that there is no such thing as a triple bottom, as they don’t hold up. Sure enough prices sliced down through that area. I would suggest that the triple bottom in gold at 1180 is not a sign of strength. And for sure gold has no business revisiting the 1180 again for a quadruple bottom. That is not a sign of strength, that is a sign of extreme weakness.
physical gold holders can hold basically forever, gold ETF holders will sell. GLD has 28 billion dollar worth of gold
Harvey Organ has been saying for years now that the vaults of GLD are empty and will become a crime scene. I tend to believe him.
Thank you, John, for another great post. And thank you for being the gentleman that you are in the way you run this blog.
Two comments/questions:
1) Part of your conviction that a top is in is due to the Solar Cycle having already peaked. As time goes on, we can be more and more sure that that peak is behind us. But is there still a small chance that the peak is in front, that it hasn’t yet happened? When will we know for certain, or say 99 percent certain, that the Solar Cycle has indeed peaked?
2) Just an FYI regarding gold: You’ve said EW was not your thing, but gold’s weekly chart has one of the clearest EW counts I’ve seen. If that count is correct, it’s likely there’s more downside, probably to below $1000 USD per ounce, maybe to as low as 800 or 700. We’re due for a bounce though. If we get it, gold should stay well below 1350 (above 1350 suggests a long term low is in) and then head lower after the bounce. Obviously, US Dollar strength is adding fuel to the fire of the gold bear market.
1. Not for some time. Same applies to stocks. Did the R2K peak back in March? 8 months later we can’t say for sure. Just trying to calculate the probabilities of both and cross-referencing them. I track SIDC, Solen, NOAA, IPS and pole switches – all are now aligned it’s in the past, so got some confidence there. Meanwhile, margin debt and R2K still haven’t exceeded their highs of around that time.
Thanks, John!
Oh, one other thing regarding gold: The large H&S top on the GDX weekly or monthly chart has a target of below $11. P&F chart suggests a target of $9. H&S and P&F targets don’t always get met, but I believe more than half do, so these two charts do not bode well for the miners longer term. (or maybe even shorter term, as fast as the miners have been dropping lately!)
“In general, a stronger dollar is likely to be both an economic and market positive. Since the late 1970s, the stock market has performed twice as well during dollar bull markets than during dollar bear markets.”
according to beautiful Liz Ann Sonders:
http://online.barrons.com/articles/SB52133021052493823286804580157982935225128
Heed to the continue strength of the king dollar? ….or is Wall Street just trying to get you to buy stocks everyday? You be your judge.
In the meantime, Japan switching from bonds to stocks (nothing new but a very timely hint) can cause portfolio mgr. to starting thinking ME TOO! QE is over and done but it will not stop all CBs to start planning for the next scheme to goose the economy. This is their job description.
I am holding on to all my long positions until price closes 2% below SPX 320 SMA. This is my line in the sand.
At last some sense. A 2% STOP.
actually, it’s a bit lower than that. The 320 SMA is down around 1850, so the stop would be 2 percent below that. That’s about 8 percent below Friday’s close.
Back testing 320 SMA to 2007-2009 period is very instructive and gave plenty of time or warming for the exit when its slope started to roll-over. Stick to a simple sell rule is my plan.
John’s work is very insightful but price has disagreed so far. I am watching intensely.
No rally can have perfect internal breadth. Negative divergences can be viewed as breadth indicators under repaired…time may heal a wound…not a reason to short until price fails again.
Everyone thinks strong dollar… but few seem able to connect the dots. The economy weakens under a strong dollar, US debts are more expensive to service under a strong dollar, US exports less under a strong dollar… the growing debts are still growing. The US has already shown its hand – debase or default. After Japan’s actions, the US and ECB will just have to debase all the more. The Fed will lose what credibility remains. When stocks roll over (strong dollar cuts into corporate profits making servicing of debt all the more expensive), the Fed will be forced to print more… then the crowd will wake up to realize the Fed’s QE did not work… did not make the economy stronger, make the debts go away, etc. This is when gold and the companies that produce it will shine. As John has laid out, this is a process and we’re in the very late stages. Those here that believe stocks will continue higher and that gold will continue down are the same types of people at the bottom in late 2000 and late 20008. They missed out and were skeptical the whole advance in gold. This time will be no different.
Fed to the rescue. They will not let the dollar rally unchecked for too long. What we have here are currency wars, the CB’s race to the bottom. It’s going to be an interesting few years ahead of us!
Really informative and comprehensive summary of current market conditions and especially useful for someone without a lot of prior education on the markets.
One thought backed up by back testing to 1995:
Picture the price moves of the SPY, QQQ, R2K, etc. as half bread and circuses and half as economic marker of value. It would make sense that the bread and circus aspect would dominate during certain times of the year which makes up what could be called seasonality. If you back test seasonality (bread and circuses) over any time frame and basically ride the seasonality chart during any year by going long exclusively during up slope seaonals and going short during down slope seasonals you will net low to mid double digit returns during any year, e.g. 2008 was 20%+. This seems may seem too good to be true but I backtested it 20 years
and have found consistent profits each and every year. “Equity Clock.com” has seaonals for every market including emerging markets and based upon my analysis this works on every market and every time frame.
Then, the secret sauce is to integrate the Lunar Edge into the picture (and if you want to get really fancy eliminate trading days around apogees where most of the waterfall declines occur, eliminate one trading day after lunar equatorial crossing into south up until day of extreme south lunar declination) and you have a very robust productive investing system that is immune to the economic cycle. The market is like a dolphin, it goes down, rises to the surface for air, and three to four times per year (April after taxes paid, mid October to early November, US thanksgiving day to early Dec., and few days before xmas to end of December) the dolphin jumps through hoops and rises into the air. So if seasonals coincide with lunar edge that is a strong indicator, if they conflict it is weak.
Instead of a long time period binary approach to the market where the market is either bullish or bearish and investing long or short based upon macro market cycles, I am in favor of a adaptive very short term binary approach where a combination of high probability factors in order of predictive value: seasonals, lunar edge (as outlined on home page), apogee weakness, southern declination weakness are all used together to ride the bull up and down all year long. Sure this will cause bruises and aches and pains in the beginning but the increase returns are worth it. It takes intestinal fortitude to implement but is immensely fascinating as it makes the market come alive in a way that places it in the context of electricity. The electricity of seasonal factors, christmas, holidays, major economic times like tax day and of the lunar dimensions.
Once again, thanks for this blog, and thanks to the many wonderful postings on the comments section.
Great post, Steve!
Question regarding declination: Are you using true declination or latitude? For example, if we look at where each one is today, November 2:
Declination is currently rising, crossing the 0 line tonight and peaks next weekend on November 9.
Latitude however is falling, it crosses the 0 line late Tuesday, November 4, and hits its extreme south position a week from Tuesday on November 11.
Which of these two are you using?
I use Nolle’s 2014 Lunar Declination Cycle Table avail. on his website. I use declination. Will look at Latitude which I hadn’t heard of. The Lunar Decl. is so useful though, I would say based upon hours of chart work that it is as predictive as moon phases Lunar Edge. Thank you for the info. on latitude.
thanks! Just checked his declination numbers and they match the declination graph that the Lunatic Trader software displays. (too bad, I liked seeing how the latitude matched the recent decline to 1820, but that would have been too easy, eh? 😉
Latitude is something different. I’ll have to think about why it’s so different from decl. They are almost 100 percent out of phase right now and they’ve been that way every month this year.
reason I’m asking is that I noticed the moon’s latitude last month perfectly timed the drop and the October 15 bottom, whereas declination was rising during the worst of the drop and peaked a couple days prior to the 1820 low.
The declination doesn’t work every time. N to S is usually weak, S to N is usually strong. Notice that the deep fall last month traced out exactly the seasonal chart pattern and preceded the lunar apogee by 5 trading days. Apogee’s have about 2/3 monthly decline starting one or two trading days before the apogee and continuing two trading days after apogee. Tho’ I would say Oct. sell off was mainly a seasonal factor.
we’ve got an apogee coming up the end of next week on Friday, November 14. So we can be alert for a decline starting on the 12th or 13th.
Yes, I would expect a low in Nov. to match up a few days before or after Nov 14 apogee, and seasonally middle of Nov. is weak.
Some more sense
Trading seasonal s……. rather than trying to SELL the TOP
Sell the top, just do it every month according to the seasonal chart. What I can’t figure out is how to use stop losses and not get whipsawed. The seasonals work so well and seem to fizzle out somewhat if stop losses are used, yet stop losses are essential. What I really would like to figure out is how to use technicals like MA, or MACD in conjuction with seasonals.
Perhaps you could use your seasonality stuff as a filter or bias on top of some other purely price-based entry mechanism e.g. candle patterns, MA crosses, whatever that is easier to use with stops.
According Ed Seykota, whipsaws are unavoidable:
Very impressive, Steve! Your post has true value. Thank you for sharing your seasonality ideas with us.
And many thanks to John once again for keeping the comment area an open board. Then I may have the opportunity to read Steve’s great post.
Steve S, from experience seasonals can add value but, as per my previous post, I’m concerned you’re using seasonals that aren’t calculated on a walk forward basis.
I am just searching for way to better buy and hold. Seasonals are one factor along with lunar edge, declinations, apogee. I back tested going long/short on spy over 20 years and seasonal entry exit worked. Future results may vary and this assume following strategy with no emotion. I am not sure what walk forward basis is. Also need help with combining these market timing with technical analysis.
Just my 2 cents. Over the last 20 years buy-and-hold beat trading in and out with the lunar edge (except in Singapore), and I suspect sell-and-hold will win the next 10 years, just my opinion. I also found the worst lunar runs (consecutive months where lunar edge didn’t work) were 5 or so, whilst occasionally we get a very atypical year in which the monthly seasonality doesn’t work. So in short, such a system (I’ve pondered such myself) would need great discipline and a long time frame to reveal its edge, as at some points you are going to get multi-month losses or even yearly losses.
It’s always a pleasure to read John’s article. Although I would never go short U.S stocks, I agree with John’s analysis that U.S stock markets are actually weak when compared with its own past. So, it’s not smart to be freakingly long U.S stocks either.
In my humble opinion, global perspective is important for any business in this world. And for trading business, it’s vital.
Let’s look at the global stock markets. They can be divided into three groups: the U.S markets, other industrial countries markets, and the emerging countries markets. Each part has a good index to value it: S&P 500, MSCI EAFA, and MSCI EM. (EAFA means developed countries except for the U.S and Canada. ) Technically, those three indices are comparable. The methods to make those indices are almost the same. And the last two are useful only as USD value indices. Needless to say, almost every global brand, or globally important company, is included in one of those indices: Samsung, Tencent in MSCI EM; BMW, Fast-retailing in MSCI EAFA; And many more, you name it.
We have a easy way to compare those indices (all in USD value): SPY:EFA, and SPY:EEM. If you draw charts for those two ratios, it’s crystal clear how bullish the U.S stocks have been since 2011. I don’t think any human being,or any central bank, or any governments group can manipulate those ratios. Sort of mission impossible. There must be some fundamental factors behind those spectacular trends.
The answer is, imho, QE is working in America. No other country is able to achieve its goal by QE, except for America. This is hard to explain. But I want to provide you guys some personal experience.
I was a big QE doubter and gold fan before I moved to America two and a half years ago. Then I was astonished by what I saw: every man, woman and their dog was busy to refinance their mortgages. ” Oh, boy!” I told myself, ” Don’t tell me what they save for their monthly payments is not real money.” It’s real, and free. As long as I truly believe there’s no free lunch in this world, I had to conclude that there’s someone else out of America voluntarily, or involuntarily, paid for American households’ free lunches for the next 30 years. I was even able to point out who those suckers were (and are): China, Russia, Japan, South Korea, Saudi, and many more, you name it.
In other words, be cautious to go short American’s economy, and stocks. If you really want to be short, there are many suckers in the list.
Such a damn weather day in New England. Best wishes to John and other cool folks. Neglect the weather, have a nice day!
We are having a perfect day in California. Bright sunshine, crisp air, and a high of 68 degrees. Going to barbeque some wild turkey and have some locally sourced wine.
It sounds pretty unfair for Boston area residents.
It’s still windy and snowy like hell.
“no other country is able to achieve its goal by QE, except for America”
Japan used QE too late
ECB has not used real QE
It’s an interesting point. The US economy has performed relatively better than most, so that accounts for some of the outperformance in stocks. But US stocks are now much more expensive than their counterparts, and the stats show the run up in price has been 80% multiple expansion not earnings. So I suggest in fact the mania has been at its greatest in the USA, rather than it being QE working (80% of US QE money is sat idle). The question then is why US stocks have been the biggest mania target, and I’d suggest it’s because the US central bank has been the most aggressive from the outset, so given the mantra for this mania of central bank policy trumps all, it makes sense that US stocks would be the most bid. Japan may now take over that distinction.
Followup 2 of deja vu Oct 2007, spx fibonnaci 2067. After looking at 4 year charts, I came up with different projection for DOW top by Thanksgiving. Sticking with spx 2060s, comp 4750s. DOW tops May ’11 12876, Dec ’13 16588. Incr/mn 116 results in Nov ’14 17860s.
I use MACD of CPC to generate intermediate buy/sell signals. Two buys early Aug and mid-Oct, but no sells since Dec 2013. Fridays drop to .77 puts us close, but I still expect to see at least a rounded top with two weeks of distribution.
Rounded top makes sense according to current news shows about BOJ/pension purchases. Probably a week or ten days to let this bullishness evaporate.
arthurk, would it be possible to post the chart of the CPC you use for signals? just curious to see what it would look like. tia.
Another great post, John. Thank you for your extraordinary efforts.
It seems that there is nearly universal belief that this central bank induced bubble will eventually end badly, we on this blog just have differences as to the timing of the fall/crash. In fact, no one really knows what will happen tomorrow or next year.
After a few gains and a few more losses from buying index puts, I am a little gun shy of continuing to try to time this top. I am contemplating a “strangle” strategy to be sure I am short when the big fall/crash actually occurs. I would buy an equal number of contracts of out-of-the-money puts and out-of-the-money calls on SPY (you may favor another index). If the crash occurs, the calls expire worthless and the puts rise exponentially. If the bubble continues to melt up, the calls will cushion the decline on the puts and will even rise exponentially if we get a further parabolic rise.
Of course, the risk is that the market goes sideways from now until the option expiration date and both put and call premiums decay toward zero. After a 10% decline and 10% recovery, is it very likely that we will just go sideways for an extended period? I don’t think so, but anything is possible. We appear to be at an inflection point right now, I just have no idea which way it will go. We are certainly overdue for a correction but I have been saying that for a while.
G/L to all trying to short this overvalued, overextended market. Maybe we should have a contest just for fun to see who can top-tick the S&P by year end. I’m guessing it will be 2040 on 11/5/14. Any other guesses?
if you have access to options analysis graphs and such, take a look at ratio spreads, also called back spreads. You could do some with calls and some with puts. There may be other spreads you could do that would have small outlay but large potential gain on a large move. My concern with buying both puts and calls is that we might not move enough in either direction for you to make any money. Since you’d be long both puts and calls, you’d be dealing with serious time decay.
If you don’t have access to options analysis software, thinkorswim has a great platform, you can open an account with them and not fund it, and still get access to their platform.
John, check out 7/1929….we had the same whipsaw pattern and V-shaped to new highs. This means another 2 months +17% rally before a crash — that crash comes with a small second chance as well.
In terms of solar activity, we had 98.5 on 12/1925, 93.5 on 4/1927, 91.4 on 6/1928 — so many early peaks like in this SC24. One might think — wow the final peak is behind us for a whole year from 6/1928 through 6/1929 — and so the top has to be NOW (6/1929). But nope, another 17% rally to 9/1929 peak. And then we did get another higher solar peak 108 on 12/1929 by which time the initial big crash is over. Thus, sun watchers are wrong on 6/1928 expecting an imminent crash but are also wrong to be waiting for the 108 datapoint where the initial crash is over. Can we ever get it right?
Sorry — just saying what I see, rather than what I want to believe. Market is a cruel master. I do realize that we never repeat exactly, but just trying to fit your current methodology into the framework if we had traded in 1929. Very happy if you can prove why you would not have shorted early in 1928-1929, because that will give us more confidence right now.
May I add lastly that 2M of rally is quite like in this Y3 Xmas rally seasonality as well, along with all the arguments of aversion to take gains for tax purposes…It is just 2 more months. The other indicators of valuation or solar activity have a longer timeframe, which I am sure will work eventually — why not from 1/2015? Lots of peaks occur around the turn of the year. 1969, 1973, 1990 — for good reason.
It’s a valid point. We don’t have much data on 1929 to compare. We know valuations became extreme, leverage rose right into the top, breadth diverged into the top, the Sornette bubble end flagged several times from late 1927 into the peak.
Here in 2014, valuations are equally extreme, breadth has diverged, leverage so far peaked out in Feb, Sornette bubble only flagged once properly (July/Sept for SP500/Tech) and is now at zero.
If the market is still bubbling then we should see leverage exceed Feb and the Sornette flag come again, so there are two criteria to check. Regarding market breadth, it peaked out at the same time as the solar peak circa May 1928, but the market rallied a further year on continually shrinking breadth before topping. A comparable long lead time between breadth peak and market peak was the run into 2000.
So would I have been short perhaps a year early prior to the 1929 top? Maybe. But here in 2014 we have 40 indicators to study. What would the picture have looked like armed with the same in 1928 (or retrospectively)? Who knows. Ultimately, why the market didn’t peak until a year after the solar max is going be a guess until we see something similar happen again. We just have to allow for the possibility.
But my arguments are we can see a topping process unfolding since the turn of 2014 and that we should be right at the end of that now, making further gains into 2015 unlikely. The way indicators, margin debt, R2K and European indices have developed support the topping process having begun 1 Jan and be concluding now.
John,
What about the Venezuela/Argentina argument?
What if you are absolutely correct about everything — the fundamentals, indicators, all of it — but instead of going down, the markets go UP?
The 2 best performing markets in 2014 by a long shot are Venezuela and Argentina.
What if central banks are turning this into a global banana republic? What if the real economy is a disaster of epic proportions, but the nominal price of assets like stocks goes ballistic to the upside? It’s happening right now in 2 of the worst economies in the world.
That is the big concern for bearish arguments. Not that the analysis is correct, but rather that the fluctuating value of currencies due to debt, QE, central banks has co-opted price discovery mechanisms.
I can’t rule it out. But both those countries have inflationary demographics, whilst the US, China and Europe have deflationary. The velocity of money in the US continues to decline despite the Fed’s best efforts.
Long gold, short stocks should still do nicely.
Thank you, John. I remain short but have cut my positions very significantly. The next few days are key to see if the SP500 will follow other indices to new highs. Every time we get a new high, I expect to see a new “second chance”, which then gives me some confidence not to be max short.
Interesting point John makes to long Nikki, due to the direct buying by Japanese gov.
Futures are strong 500 pts up 3.5%.
Might be a good hedge tomorrow.
I am in the camp with the bulls. There’s no doubt that this market is overvalued but standing in front of bulldozer is insane. Using short as a hedge to your long, that I can understand. I can’t see anyone making money shorting this year. There’s another leg up till next year, before any crash scenario would materialize. There’s too much momentum going on with major world indexes. I just can’t see a reason to do naked shorts.
the world has gone mad…Japan just confirmed what has been going on for years ie., that the Central Banks are literally buying “stocks” and not bonds (and hell, they aren’t even trying to hide it like our Fed did). anyhow, how does one bet against an unlimited amount of dollars that are available to buy stocks worldwide? serious question.
you don’t. don’t bet against it anyway. If they’re buying, the only trade in town is long IMO. This time is just might be different!
It’s not just the unlimited amount of dollars. It’s the ‘risk less’ nature of those dollars to the CBs.
very good point! They have zero risk! Free money for them, just print and buy whatever. So how much concern will they possibly have about whether they are getting a good value for their money? Anything they buy is good value when the money is free!
There is one point that you guys are missing about ‘riskless’ printing. Simply that we know from history that eventually currencies collapse if they are abused.
The Fed and the BOJ know these risks, but they are beholden to their political masters, so it will end badly, but not just yet, IMO we have the down cycle to come first (deflation), before currencies are at risk during the next 17-18 year growth cycle.
Stocks are fine for fair nominal performance during a currency collapse, but gold gives you the best real performance by far. Even better when the ECB is bidding trillions for limited supplies.
One buys physical gold and awaits the denouement.
You really have gone above and beyond looking for almost anything to justify your bearish view. But ‘C’ Dumb Money? The dumb money is short, I would have thought that was obvious.
A pullback is likely, but markets are heading higher into year end.
retail investors
http://fortune.com/2014/10/23/retail-investors/
i am sure there will be corrections but it is really tough to go against the market right now. it is not just CB money but pension funds and even insurance companies are all seeking higher yields. like what Jonathan have been saying, and where best to park your money – most likely in the stock markets and the most liquid will be the US. don’t forget, a lot of the Japan pension money (50% of $1.8 trillion) will not be put in the stock markets until early next year.
Narrative—“The pension fund is very big and heavily invested in bonds, so it makes sense to allocate more to equities, and that’s lifting investor sentiment across the globe.”
http://www.bloomberg.com/news/2014-11-02/dubai-jumps-most-in-week-as-global-stocks-rally-abu-dhabi-rises.html
Narrative—” After 33 years of a bond bull market, fund mgr. should join in to sell bond or risk losing their job”.
These narratives may be good enough to cause another round of short squeeze.
the yen just started trading and going nuts again. if/when the BOJ loses control of the JGB market,,,we have another Zimbabwe.
John, Thanks again for yet another interesting read. I respect the overall approach and attitude you bring to your research and the responses to the group. Most bloggers would have played the deus ex machina card by now, blaming CBs or proffering some convenient inversion narrative. Regardless of whether the scenario you paint eventuates history will provide a learning experience as to the efficacy, or lack thereof, of the plethora of indicators you present.
On the subject of central bank intervention (CBI), I used to believe it had a limited effect on markets but the sheer unrestrained scale of recent CBI obviously relieved me of that notion. As we all know the CBs are presently carrying out a grand experiment that boils down to ‘fake it till you make it’. That is, by intervening on a large scale can they reverse negative sentiment? They may see it in terms of fundamentals but that’s implicitly what they’re doing.
Why I think CBs are actively attempting to prevent crashes:
If one asserts solar cycles affect markets by affecting human psychology – influencing negative/positive sentiment – then economic conditions are led by psychological temperament rather than the other way round, though obviously within loose bounds set by economic fundamentals. It also follows that crashes are not the result of rational agents reacting to fundamentals but are caused by irrational emotional panic. Therefore it makes sense for CBs to prevent crashes if they can as they don’t reflect fundamentals and it’s likely the cost will be less than that borne by the economy of an actual crash.
Sornette has provided compelling evidence that crashes are predictable to an extent. Given this idea is coming from a physicist the CBs are likely to take notice – notwithstanding Greenspan’s initial scepticism. It suggests a crash can be circumvented by intervening at just the right time. “Just the right time” in Sornette’s case involves fitting a log periodic function to prices and forecasting a singularity. In John’s case it involves analyzing a plethora of indicators that point in the same direction (including Sornette’s of course).
So, all a CB has to do is wait, “for just the right time” and if the market subsequently starts to tank, intervene massively. These days their job is made a lot easier by one of the main HFT strategies that aggressively follows very short term momentum. Think of it as “humming” as it trades so quickly. If the CB whacks the price upwards, a hoard competing HF machines flip with it in unison thus causing those very sharp upward moves we’re currently witnessing.
To conclude, the market may very well have topped and your indicators may very well be telling the truth but I suspect there is unlikely to be a crash.
John (nth). Thanks very much for a very lucid alternative scenario.
Lots of food for thought. It will be very interesting to see what the CBs experiments outcome is.
Lets hope the average person can survive the results.
Next high 12-17 November. 95% accurate
https://twitter.com/tradingtweetPRO
HI, thanks for your input. Can you elaborate on your analysis and explain the 95 % accuracy rate please ? Many thanks.Joseph
China just released this
CHINA STIMULUS HAS CREATED RISKS, HIGH LEVERAGE RATIO: DAILY
HIGH DEBT RATIO, HIGH LEVERAGE ENDANGERS CHINA’S GROWTH: DAILY
To me it looks like no more easy money from them.
Sorry about capitals, it’s how it was presented, pasted from news squawk
Thank you John. It would be remiss of me to not acknowledge your continued generosity in producing these articles.
I also hope that you remain strong in your conviction because to date your research still stands. The R2k has failed thus far to make new highs as has neither the DAX and as we know those two indices are where the bubble took place.
I remain convinced that we are on verge of a horrendous decline that will take out the October lows and be followed by panic.
At the end of the day it is a confidence game and the Central Banks are doing exactly what is required to destroy confidence.
Best of luck to you John
We are now entering month 72 of SC24, the same month that the Dow topped in 1929 during SC16 (arguably the most similar solar cycle to the current one). Now is the very start of the solar-driven speculation peak window that I’ve been mentioning during the last two years, and which is based on the timing of previous solar cycles, concentrating on the weak ones. But this window extends out into 2017, with the weak-cycle average during autumn 2015.
In 1929 during weak SC16, the Dow topped about a year and a half after the smoothed sunspot (SSN) peak, but very close to the highest mean monthly sunspot number (International Sunspot Number ISN) – that was right at the final drop-off from the sunspot plateau. At the moment, we are only 7 months post the SSN peak, implying that sunspot activity could easily continue for another year or so.
Looking at SC19 as an example of a strong cycle, Dow speculation increased into the start of the mean monthly sunspot plateau, but then declined into the SSN peak (early 1958) before going on to significant new highs until the plateau drop-off (late 1959). So, speculation can continue to increase after the SSN peak. In fact, it usually does, and especially during weak solar cycles such as the current one.
The SSN peak, taken on its own, is not a reliable indicator of speculative market tops.
The end of the mean monthly number plateau is probably more reliable, but it is up and down like a yo-yo and very difficult to predict. A typical timescale duration for these plateaux has been around three years for strong solar cycles, and four years for weak ones. We are now approaching three years for SC24, so again there’s an implication that we could easily see another year of persistent sunspots.
Venus-Earth-Jupiter alignment might give us some clues. The two charts in John’s Trading the Sun guide show that alignment – and therefore sunspot numbers – is at a maximum around mid-2014, but the Ching Cheh Hung one shows a large surge again around late 2016. These charts are very long term, and not ideal for precise timing but are worth considering.
The sun’s overall polar magnetic field strength (smoothed figures) has been very tentatively increasing recently, suggesting some downward pressure on smoothed sunspot numbers. But in previous solar cycles, spikes in the mean monthly numbers (and also increased speculation) have often continued for a year or more after the SSN peak. http://wso.stanford.edu/Polar.html#latest
Estimating the timing of the speculative peak between now and 2016/7 is becoming increasingly difficult.
Thanks Mark for your valuable Inputs. Historical Pattern I follow which has broadly been correct till now suggests weak December 2014 for US Equity.
I have reading extensively on SC 16 and I do agree with you current SC may follow SC 16 and we may see Dow final peak around Oct 2015 (About 18 months from SSN peak). Here in India I met some good astrologers and some good ones are suggesting similar outcomes.
Jigs, is one of those astrologers Mahendra? He’s been pretty accurate in his forecasts for stocks for the last 2 or 3 years. He’s watching the next two or three weeks closely, but as long as stocks don’t fall apart here, he’s expecting a final top in 2016 at or above SPX 3000.
One more thing Mark. I still have pic which has average of previous weak cycles and that suggested highest mean monthly sunspot number peak in Aug 2015. I don’t think actual peak could vastly deviate from average.
Very true – if August 2015 is the centre of a normal distribution, then it would be the most likely time, with probability decreasing rapidly the further we go either before or after.
However, something to consider is that that average is based on weak cycles 10,12,13,14 and 16. Although these were definately weak, they were not as weak as the Maunder Minimum cycles, and the 14 year gap between SC23 and SC24 SSN peaks indicates that we are likely in the early stages of a new Maunder-like grand minimum. So, I wonder does that imply that the highest mean monthly peak will be later than August 2015..?
Thanks Mark, But I did not get how Maunder Minimum imply peak later than Oct 2015? Once say ISN peak is made in Oct 2015 even if actual SSN goes sideways/flat after this peak we have still made THE top? OR I am missing something?
What I’m thinking is that the weak cycles (10 to 16) used to calculate the average, had typical cycle lengths averaging 11.3 years. But Maunder-type cycles have cycle lengths around 14/15 years. So given that we’ve just seen a 14 year cycle, and potentially facing another 80 years of 14 year cycles, could the August 2015 average (ie. calculated from 11 year cycles) be an underestimate?
Perhaps its something to consider more for future cycles, rather than the current one.
Fig. 1 here gives a good view of what we could be facing: http://icrc2009.uni.lodz.pl/proc/pdf/icrc0538.pdf
Great post. Much appreciated!
From Andrew Kassen:
$NKY is +8.6% in 31 hours of trading, or +$248 Bln market cap. GPIF’s *total* planned 2-year reallocation to Japanese Equities: $156 Bln.
Interesting…I haven’t researched this much, but James L said $900bn total in Foreign and Japanese. If that is 50-50, should it be $450bn of buying rather than $156bn? My source “James L” is in the comment section above.
Checking myself…The GPIF will have buy $90bn of Japanese equities and $110bn of foreign stocks to lift its weighting to 25pc for each category.
So does seem that the move in Japanese equities already engulfs their efforts.
Yes, Mrs Tanaka should be fleeing JPY which should add selling pressure on top of that — which is what the govt wants, taking the entire announcement into account.
James L said total Japanese Pensions. Perhaps they all herd along with GPIF, but the announcement could only cover what they had the authority to announce.
i read that the GPIF has $1.8 trillion and the allocation will be 25% each (Japan and Int equities). I believe thy presently have about 11 or 12%?
don’t forget there is more than one pension fund in Japan and word is that they are going the same route as the GPIF . pls don’t forget the insurance companies and pension funds around the world seeking yield also.
It’s likely to be double those figures, due to other pension funds following suit:
http://www.bloomberg.com/news/2014-08-04/japan-pensions-with-about-500-billion-set-to-copy-gpif.html
Thanks. A more “appropriate” measure is to compare
(a) sum( $NKY volume * $NKY change) during the period of interest, rather than the increase in the entire market cap. WITH
(b) pension reallocation needs (i.e. target – current allocation).
Would be interesting to see those figures if someone has it.
Not sure about that mtu. Do you have any support for the formula? What if it is a holiday and volume is zero…should NKY chance be infinite then?
imagine some one buys 1 share of a stock and push its price from 100 to 101. If there is 1 million shares outstanding for that company, its market cap will increase by $1MM with only $100 spent to achieve that affect.
Academic literature have transaction costs models, which are proven not to be linear as you describe.
transaction cost is a separate matter. The intuitive outlined here is that a small flow can have a larger impact on market cap. A $1bn increase in market cap does not necessarily mean that buyers have spent $1bn to make it happen, likely much less in a bullish environment.
Fine….let’s talk large numbers then. At the size of Japanese pension funds, they can buy over entire companies. SAPE was bought for $3.7bn today but the publically traded volume today was $0.52mn. I don’t think Japanese Pensions have to place a market order to get what they want. They probably already hedged with futures, which is why everything is up, and then they can take their time now to buy stocks over several months.
both the DJIA & DJTA made new closing highs last week. As such, the Dow Theory primary bull market trend has been re-confirmed.
Dow theory is not perfect but it helps identify facts. For now, it does not support the crash now or crash very soon scenarios.
comment board switched bullish which is interesting.
Biotech follows through on a bearish wick on Friday today. $/Y has run up to 8% below its previous peak (124) which is in line with prior multi year peaks (1990, 1998, 2002, 2007).
S&P index could still track a gold bubble peak pattern if it closes lower today. Double top with 10% valley in between as seen with Gold in 2011. Biotech would act as silver did to Gold then.
Jury is still out.
that’s just because I stopped posting to avoid harassment – keep my charts, comments and my WCCG stash all to myself! lol maybe not my comments. no more chart share though. not worth teaching those who just want to wards of the state.
it is amazing what the left brain narrative does to keep people prisoners of the imagined Homunculus!
the main bearish indication is the multiple divergence setting up across all the AD lines
the cycles are also all blow by the extremity of the rise over the last week – maybe a hair higher but there is not much wiggle room left.
JUST TO REMIND PHIL – my systems all went long on Friday the 24th and now they suggest a sell signal IS FORMING.
Anyone who HAS BEEN LONG in that time frame might want to park and wait for another long confirm or a short signal.
If Phil argues its because he has an itch he cant scratch and it isnt because of me…
If I forego the WCCG please may I keep the chart share? Thanks.
Elvis – please keep posting. Your comments and humor are greatly appreciated. Phil, like most drag Queens, is just a bitter person.
why are u getting upset……….learn to ignore the “bad comments” stick to your conviction…….cause I want you to stay as well as many others tyvm
Elvis, you are technically more advanced than I am and you have a unique world view that is really interesting. Being somewhat on the sensitive side when it comes to what might be considered gloomy or nihilistic or icky word pictures, I find most of your recent posts to be distracting. If only for my benefit, could you please make posts that are related only to your market summary and not include personal expressions of emotional content.
here it is steve – Sell and wait…lol
Thanks for the chuckle! 🙂
post a chart by a third party whose info is similar to mine – follow her chart list and you will make money
http://stockcharts.com/public/1107832/chartbook/370937962
note he warning as of today! is that too personal or exclamatory for some of you? oh well…
It is not that your posts are “personal”, it is that they often contain disgusting, confusing, and seemingly random content. There are quite a few other websites that have hundreds of posts like this where you may want to post the “humorous” comments and advice. Keep your comments on this site to the market, please.
Armstrong’s computer program has a directional change signal for this week and the next one for end of december. These signals are not that reliable that one can count on them alone. The last daily signal mid October was spot on, if I remember correctly.
Anyway, when I’m looking at what the SPX did between October and December 2011 and register that an experienced market veteran like Jim Puplava (financialsense) is seeing neither the conditions for a crash nor for a mania, then I think it makes sense to prepare for a scenario like in November/December 2011.
At the end of October 2011 the SPX finished a comparable strong rally as this October and it took two months and a pullback of a bit more than 50pc before the start of a new strong and long upward trend. A similar scenario today would be consistent with the outlook on pugsma, for which slater declared to have strong respect.
John’s 40 indicators are making me cautious, but if the SPX really pulls back 50pc I definitely won’t be convinced that the long announced waterfall decline is about to run its course, not before a macd monthly sell signal occured.
http://stockcharts.com/c-sc/sc?s=SPY&p=D&yr=1&mn=0&dy=0&id=p07308569900&a=308233753&r=305
posted the wrong chart!
her chart list is Joanne Klein on stockcharts
pretty reliable simple systems
good spot to break up the rising wedge in $/y – target 109 – that would wake the bulls up!
Ok, I’m bearish now. Sold my IBB and QQQ and looking to short. A wave of deflation is coming. The dollar will rise a lot and everything will go down sharply, except treasuries. So, John will be right, except for gold, which will continue to go down. John, gold went up in the 30s because it was linked to the dollar. It’s not the case now and it will get caught in the deflation.
Don’t call me crazy, only fools don’t change their minds. The Yen and Euro and commodities currencies will go down, the US$ will explode higher, creating a wave a deflation, which will be the trigger for the next bear market. This is coming shortly.
Thank you
What changed?
he read a blog that summarized it for him – note no reasons or references…
he says what I’ve been saying and PHIL IS SILENT! LOL!
go nick go!
Nicolas welcome to the ‘down’ side.
Way to be flexible, Nicolas. By the way, congrats on your successful bearish call on the gold miners.
Gold went up in the 1930’s as a gov’t mandated law, ie price fixing to help cause inflation. They bought gold to cause inflation then, this time around they are buying bonds to create inflation. History repeats similarly but not exactly. Higher mandated prices in a deflationary environment was massively profitable to gold mines, but I do not see a repeat of that. Deflation does seem to explain everything except the market’s strength. Nicolas, we are now in exact agreement, I also wonder why.
bears are getting a break here it seems
I am as clueless as everybody on this board in timing the top but I still try to connect the dots as this top seems to be fake.
In my EW count kickoff to this bull market was advance in Wave 1 from SPX 1074 on Oct 4, 2011 to SPX 1292 on Oct, 27, 2011. 218 points in just three weeks. Similar dynamic as for the latest move.
My EW count points to current advance from SPX 1820 as the last wave of the bull that started then in Oct, 2011. Wave 5 common relationship to Wave 1 is either 0,618 or 1. That would give us 2038 as approximate target for SPX but it may top anytime, even today.
Everybody is bearish gold now but as pimaCanyon already mentioned it dropped in clear 5 waves from July top of 1344. This happened after consolidating in huge triangle (June 2013-July 2014). That last move and breaking 1180 smacked of capitulation and removal of last hope for gold bulls – exactly as fifth wave should behave.
If we are going to triple digits in gold then this was only first 5 wave move. Nevertheless we should correct to the upside now as there is too much bearishness and too many are shorting gold.
USDJPY is a frightening beast that seems to be totally out of control now but even here we may observe some wave patterns.
Its latest move from Oct,15 low of 105,2 to today’s 114,20 is 9 points, almost equal to move from Aug, 8 bottom (101,50) to Oct,1 high (110,80). Can we count it as A-B-C where A=C ?
The above would point to scenario that is presently almost unimaginable :
* USDJPY dropping to 90-100 zone in C wave of expanded flat (speculators sell their positions to protect gains after BoJ played all their cards in latest desperate move ?)
.
* Gold advancing to at least 1250 and possibly to 1300.
* Stocks crashing (SPX target of 1570-1590 as major support zone ?)
Expect the unexpected as the catalyst for turn may appear anytime
am with you on this!
STOCK PRICE RESEARCH
Is April 29, 1835 important? Maybe: maybe not.
Back in 1987 I spent time working in the University of Texas library, compiling daily stock prices from listings in the “Daily Albany Argus” on microfilm trying to determine the exact day the market peaked. (Some Elliot Wave practitioners refer to that peak as Super Cycle I.)
http://time-price-research-astrofin.blogspot.com/search/label/Historical%20Charts
The lead was provided to me by the Foundation For The Study Of Cycles.
From my notes.
“I enclose a data page that includes the 1835 monthly values for our stock price index. The section of the index from 1831 to 1854 is based on the Cleveland Trust Company Index of Railroad Stock prices as prepared by Col. Ayres. The only figures I have for this series are monthly. The details of the method of compilation are not included in any of the material in our library, but Leonard Ayres was highly regarded by his peers, and probably the data are as good as you can get for the time period.”
Referring to the monthly figures they provided; the highest prices reached in 1835 were during May, and August, 1835 and were identical at 23.48. So, one is left to guess if the actual peak occurred in May, or August? Sell in May and go away comes to mind as confirmation.
Back now to the Daily Albany Argus, I did not find a higher peak for prices in August, than were recorded on April 29, 1835. So, I believe that to be the date stock prices peaked. Even the chart I posted shows August as the peak. The method I used was to take a simple average of prices from the listings published at that time.
Fast forward to the Puetz Crash Window discussed many times before on this blog.
There was a solar eclipse on May 27, 1835, followed by a lunar eclipse on June 10, 1835. Using the rule of 6-weeks before a lunar eclipse, and a calendar for that year, 9-weeks before the lunar eclipse landed on April 29, 1835. (Someone interested may want to check the eclipse tables to verify.)
All this is probably a casual coincidence but I though it worth reporting. Especially, siince the crash of ’29 also occurred within a Puetz Crash Window.
I realize this is only one variable; but is this another argument in favor of the bulls since the next Puetz Crash window I believe will not occur until 2015? Of course there are numerous other variables that can now be studied for further analysis.
Error. The third from last paragraph in my recent post should have read:
“6-weeks” and not “9-weeks before…..”.
Rusty reacting to the top of the fork that brought the bounce: http://scharts.co/1zstklW
And there is long-term € support hereabouts:
http://stockcharts.com/h-sc/ui?s=$XEU&p=M&b=3&g=3&id=p42610386051&a=278171725&r=1415045348713&cmd=print
I think the catalyst for the crash will be the rising dollar. The US is now importing deflation from other countries. The YEN is collapsing, the Euro is crap, and the commodities currencies are also crashing. This is deflation. Keep in mind that 50% of S&P 500 revenus come from outside the US. When the dollar index touches 95-100, sales and profits will plummet. I think the market will realise this soon and will freak out. Gold will also go down sharply as deflation take hold.
I wonder if what Nic has posted is true.Does inflation have anything to do with a TOP.??
The $ is rising because the US Stock Market is seen as a SAFEHAVEN. You need $s to buy stocks .US stocks give you a return while interest rates are negative.
Gold is not considered a SAFEHAVEN while there is a strong $.
SO $ up, US market up Gold down
Interest rates up $ down thats the start of a TOP
But interest rates must be above 3% for a meaningful move.Thats inflation.
So maybe Nics post is true.
The US is now importing deflation from other countries.
yup – Nick read a blog.
this talking point is all of the net right now…
Hi Elvis,
May I recommend the following Charm School to improve your manners:https://twitter.com/TheCharmSchool
may I recommend you stop recommending! unless its a better alternative to WCCG!
I’ll stop recommending when you start being respectful, stop using incomprehensible acronyms, don’t use disgusting emotionally charged phrases, etc.. Though I’ve got to say you definitely are self confident. That is good!
ha ha ! You’re funny BBE. From your posts, it’s pretty obvious you’re a terrible trader. You do post a good chart from time to time. But it’s good you are on the blog. You can learn a lot, especially from my posts.
haha – it’s obvious from your posts that you DONT trade and have NO SKIN in the game…
blog follower and plagiarizer that you are.
a quick google search proves that nick lifted his analysis from the net and is simply full of shite:
https://www.google.com/search?q=The+US+is+now+importing+deflation+from+other+countries.&oq=The+US+is+now+importing+deflation+from+other+countries.&sourceid=chrome&es_sm=93&ie=UTF-8&gws_rd=ssl
from one of Nick’s favorites sites:
US Now Importing the World’s Deflation by John Rubino
The only truly cheap assets left are gold, silver, and gold and silver stocks. By the end of 2021, they will reach stratospheric valuations that few alive today can imagine.
This move in oil is a head fake. Commodities are being crushed as the big boys prepare to crash the dollar (their USD short positions are the largest they’ve ever been) and the major U.S. stock market indices. Looks like at least another 10% correction this month and an UGLY 2015.
My thoughts are unchanged, the FED is not omnipotent,
It can not abolish the business cycle, but can alter it.
Ultimately the cycle reassertes itself which will come
as a surprise to some market participants.
The differences here relate to timing, and my view of a
likely Bear market being 6-12 months away rest on the
the US business cycle which is yet to turn.
As earnings fall with the next recession QE will not
save markets.
Before this you can have significant corrections
within a continuing bull trend, those I could not
Hope to call accurately.
We are in a late stage bull market by just about any
historical metric, if you take 2009 as the starting point.
I tend to agree with lots of this. The only bit I disagree with is the endpoint. This bull market will last another 8-10 years (sharp pullbacks and softness into perhaps 2016 notwithstanding). As I have said repeatedly the chances of another crash so soon after 2008 are remote. Mini short lived ones are now part of the landscape and one early next year is likely.
8-10 YEARS! that would make it a preternatural bull of mammoth proportions the like HISTORY HAS NEVER SEEN! WTF!
rubbish Elvis, go and have a look at history..1914-1929, 1942-1960, etc etc
davie – the longest bulls according to Shiller have been around 12 years and we are already 5.5 into one! another 8-10 years would be preternatural my boy!
the bull that started in 42 ended in 46
now the cycles are open to interpretation but yours is a pretty broad interpretation…buck up and do the research and stop following LITTLE NICKY!
http://greenbackd.files.wordpress.com/2013/04/table_us_bull_markets_since_1871.png?w=640&h=456
you are goose elvis, no wonder you lose all the time
goose!
lose ALL THE TIME!
lol and roflmao!
WTF is with this internet video game anyway!
Going back to FED intervention have a look at the V-Bottom chart (2nd to last) or here: http://jlfmi.tumblr.com/post/101416437690/the-v-bottom-is-still-in-fashion
“From 1950 through 2012, the S&P 500 experienced 38 such V-bottoms, or 1 every 1.6 years. Since March 2013, there have been no less than 9 V-bottoms.That is 1 every 2.2 months!”
Now go here and look at the log periodic cycle chart, “Anatomy of a textbook pre-crash bubble” http://www.hussmanfunds.com/wmc/wmc131111.htm (Hussman’s views are irrelevant to my point).
Note that the model essentially predicts a crash early 2014, just when all those improbable V-Bottoms started to kick in – in my view the FED conducting crash prevention.
As a footnote, I think John’s view is correct and we will see markets decline from here onwards in the medium/long term.
I use google translate quickly.
I still believe in a given year AD 2012 ~ 2018 period (Chinese classics “Tui Bei Tu”)
Big problem (or disaster) will occur worldwide.
1. Sources point to the sun
2. Sources point to Japan, which suffered massive volcanic eruption or a similar bomb attack.
The sun is a symbol of Japan.
But it seems inseparable from the sun.
So I guess for John, quite interested.
I was prevented, but not superstitious.
Avoid unnecessary loss of assets.
The following explanation is not correct site (I just use it for pictures)

BRIEF:
Possibilities: the solar “kill shot” – a massive CME that takes out electronics worldwide; also, increasing body of research shows that solar activity is definitely linked to volcanic activity here on Earth, as well as weather, hurricanes etc.
Oh, and earthquakes!
I am long SPY. Reason: mid term election week and first four trade days Nov. are supposed to be bullish. Tho’ Saturn is superior opposition on 11/15 and based upon a quick survey of last few oppositions 11/1/14, 10/15/13, 10/1/12, previous year minus 15 days to calculate prior years. Market loses ground during the weeks after opposition. I was expecting middle of Nov. to be the weakest place but maybe that will extend into early December because of the opposition.
Elvis, I like your charts so at least one guy hopes you change your mind. I put the “chart that never lies” into my stockcharts list. Thanks
The bonds have refused to back down the last couple weeks despite this monster move in equities. This is very ominous. Stocks still need break out of this 2020 area soon or we may go right back down and shock everyone.
New post is out. Thanks everyone.