
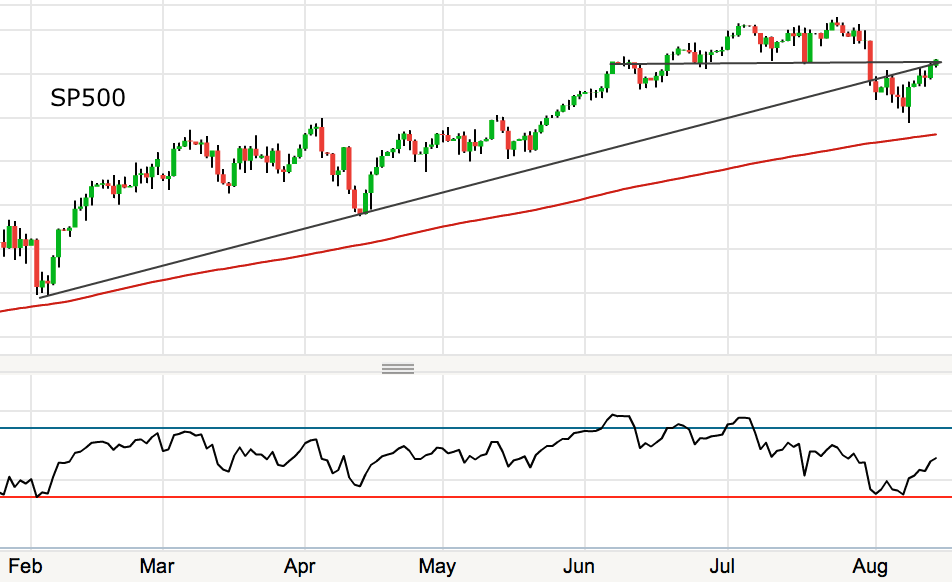
The potential post-second-chance positioning was negated as the rally since the 8th August gained momentum, albeit out of hours momentum. So the question is whether this rally now produces the failure high second chance peak, i.e. a lower peak than July, and thereafter we tumble into the bear-controlled post-second-chance market.
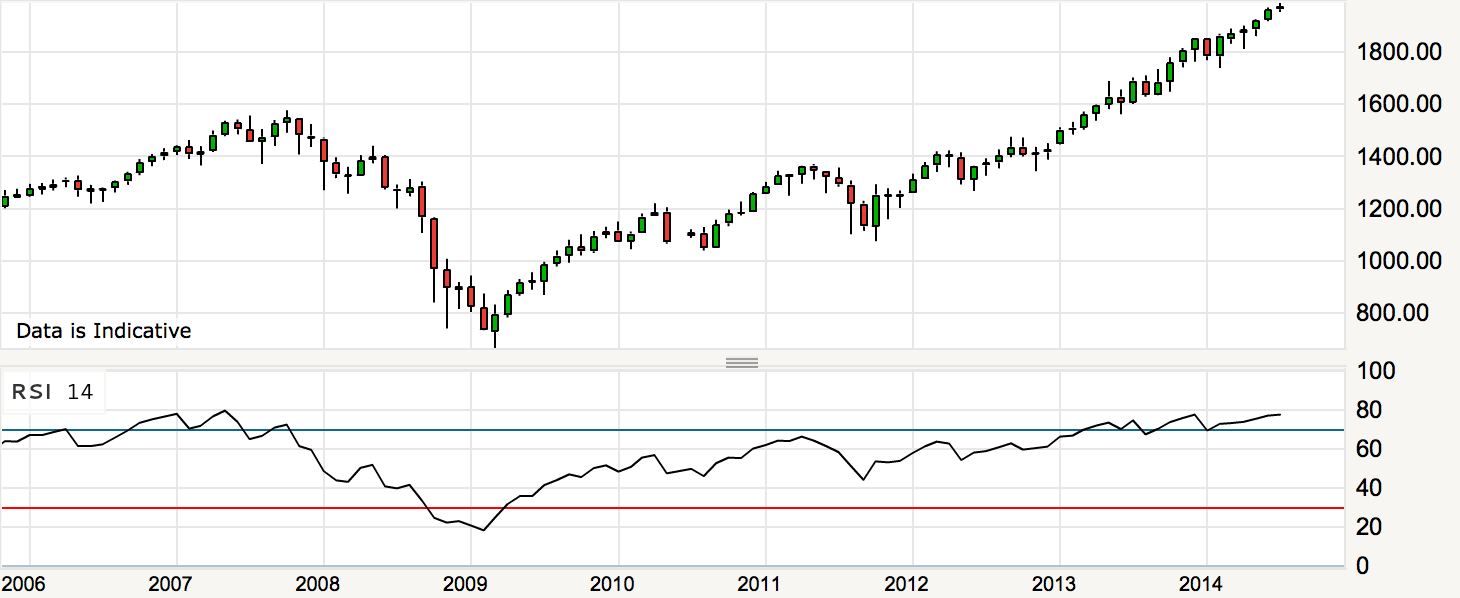
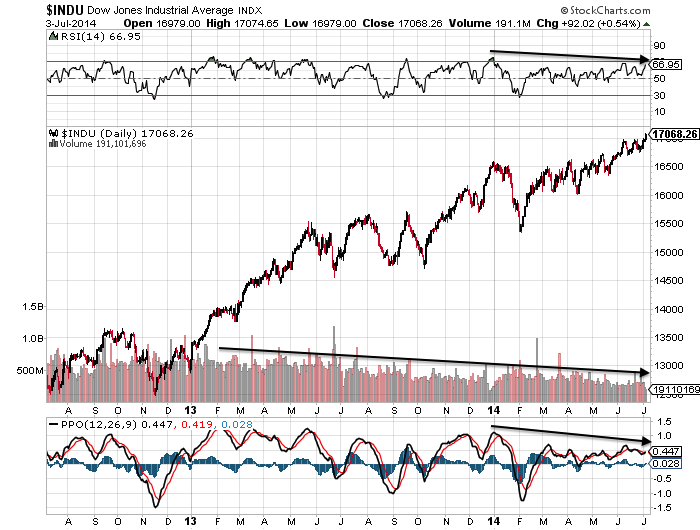
Whilst the Nasdaq has made a marginal higher high, the RUT, DJIA and European indices are some way from their peaks and as we reach increasingly overbought here, the odds favour those indices turning down again to cement lower highs. Plus, the Nasdaq has made the higher high on negative divergences, making the potential to become a fake out. If that is to occur, and with the SP500 not far from its July peak again, a renewed move to downside has to happen fairly promptly. With the new moon several days away providing such a potential peak (an optimism peak), that now becomes my most probable case: markets topping by the end of this week, making a lower peak to July on the majority of indices, and a critical lower high / failure high.
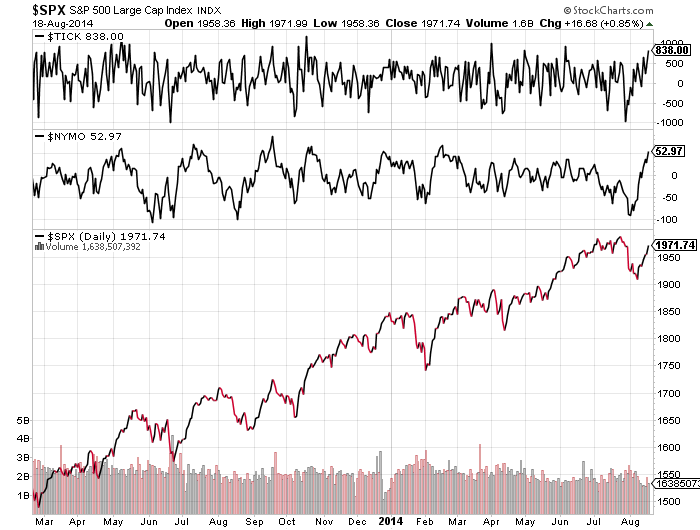
Tick and Nymo amongst those indicators showing overbought:
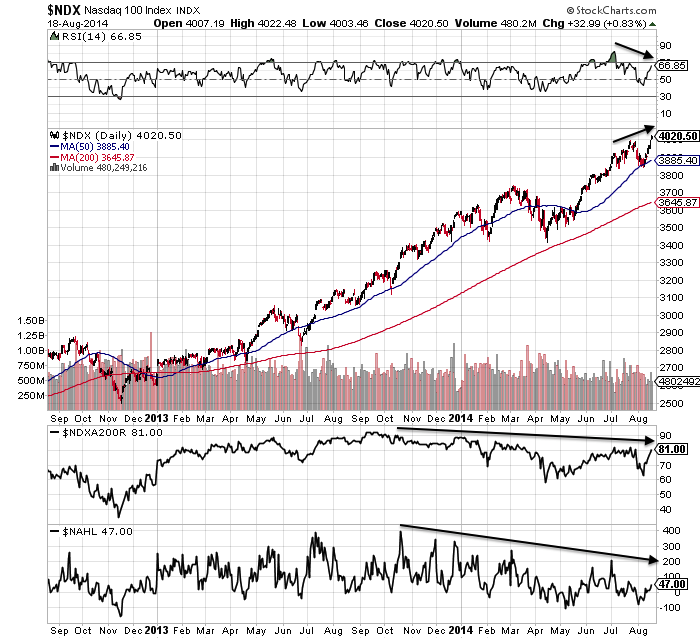
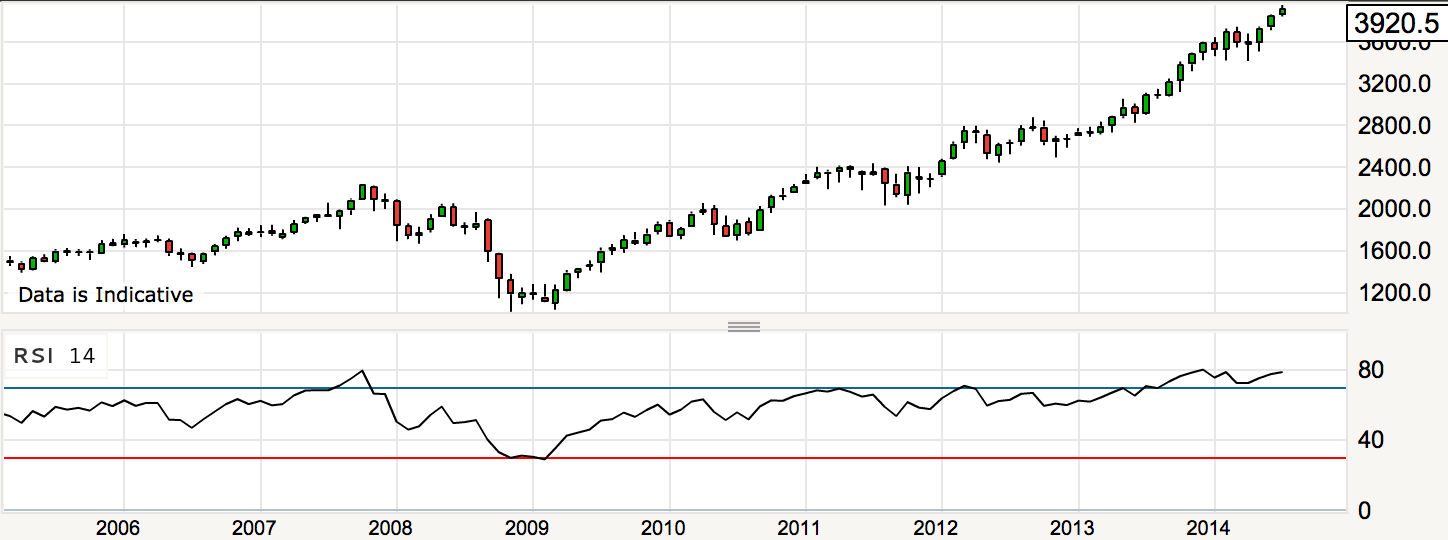
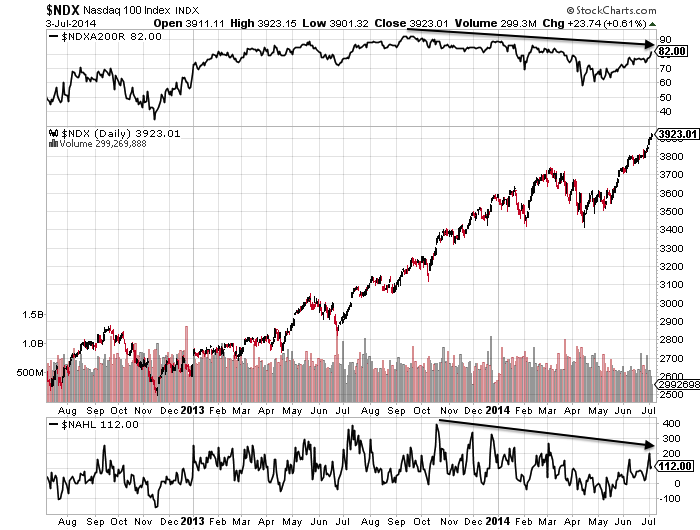
Nasdaq 100 negative divergences in place since late 2013, plus short term RSI divergence:
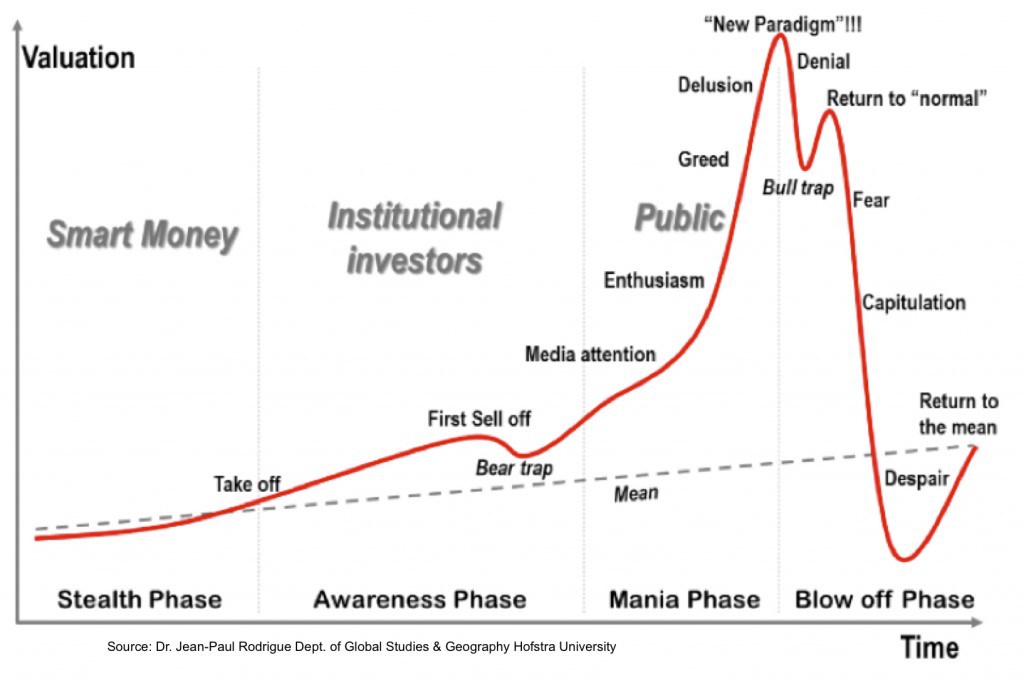
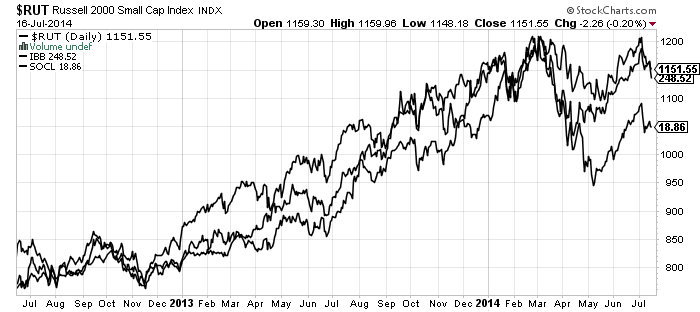
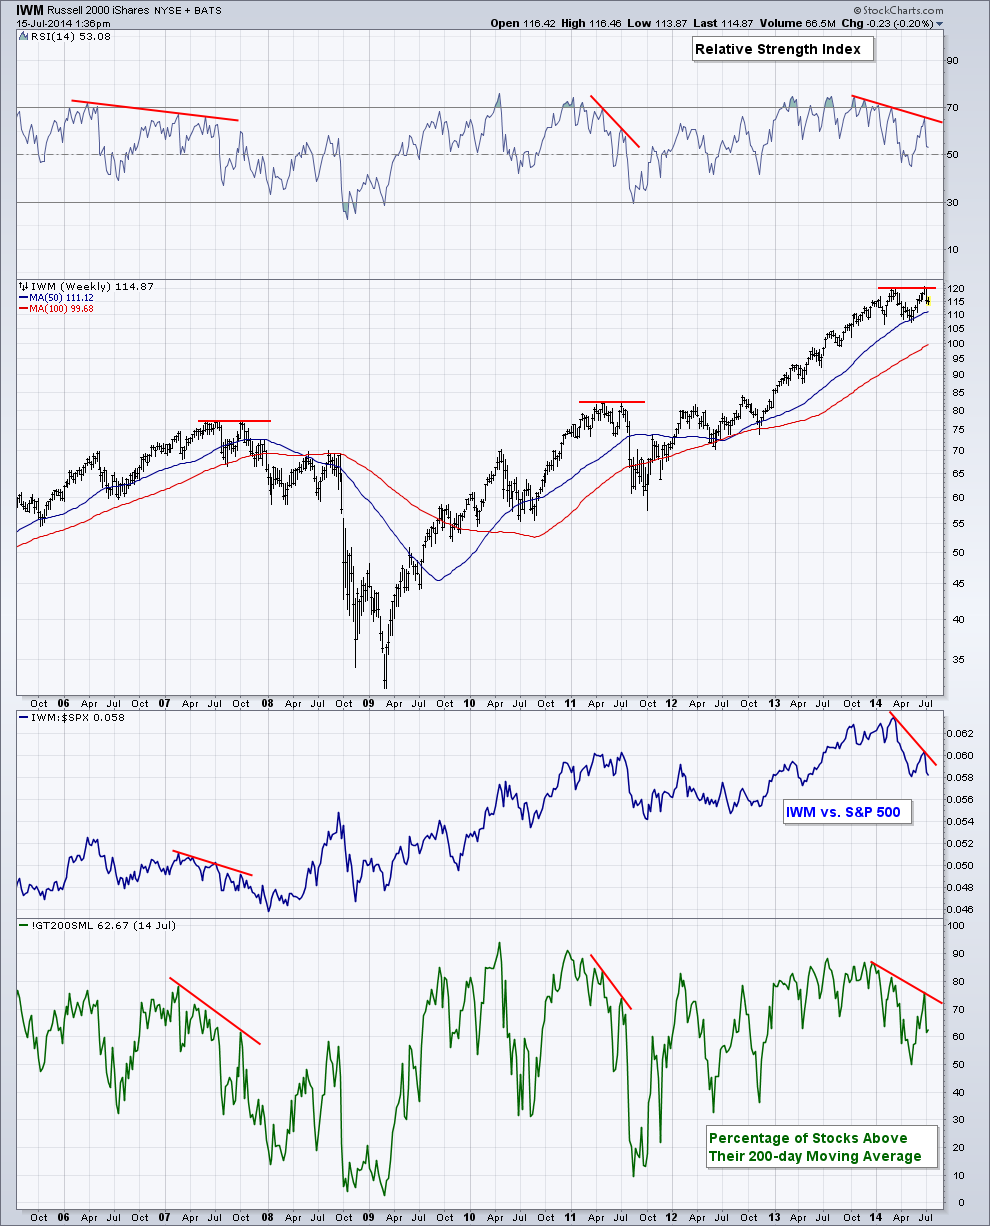
R2K, SOCL and IBB still peaked Feb/Mar but need to turn down soon to maintain the lower high / failure high patterns. A look at IBB shows the typical bubble model has played out and the short term RSI divergence shows the potential for another leg down. If that does occur, then it should be the major bear leg down. However, the recent rally has made the turn-down fairly urgent.

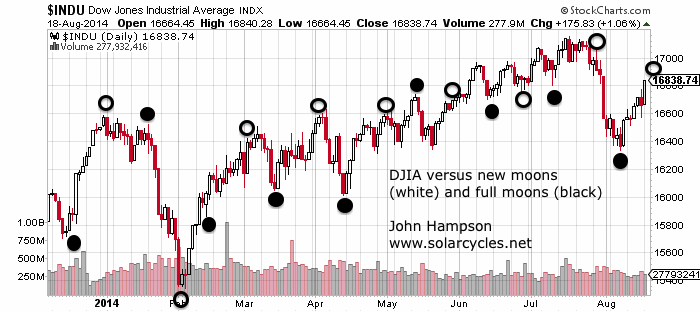
 The Dow versus lunar phase oscillation shows the potential for a peak around the new moon of August 25th, which would also likely be a lower high, adding to the case of the late-July breakdown:

The bigger picture argues that a major peak in equities is in, and if not in, then overdue. Ten different angles on a stock market peak produce a cross-referenced case:
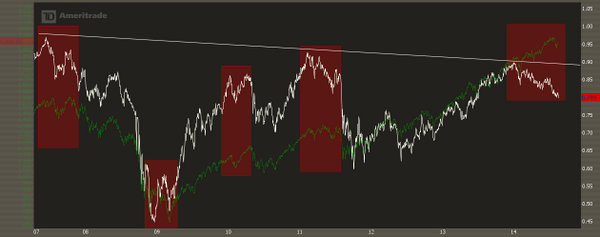
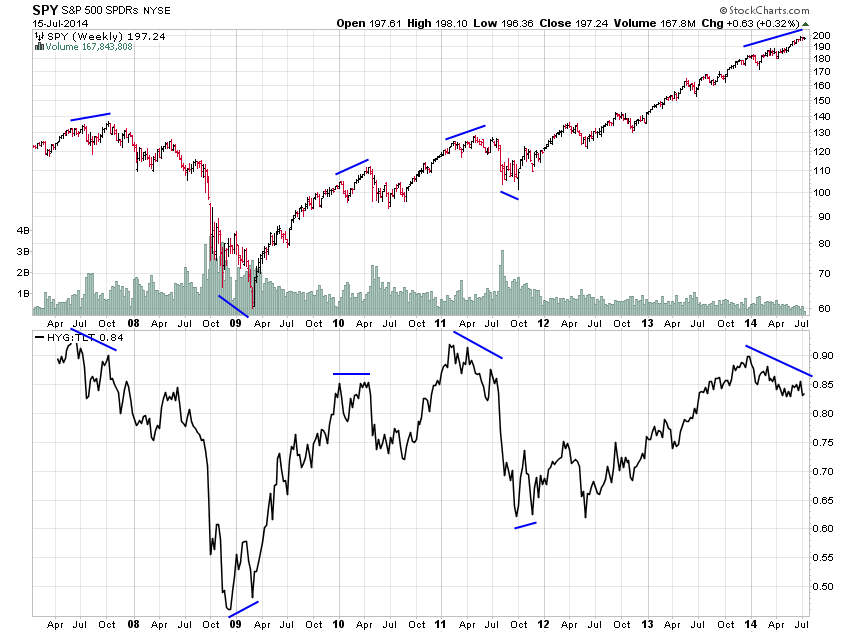
1. HYG:TLT divergence at major peaks:
Source: InflatedTemper
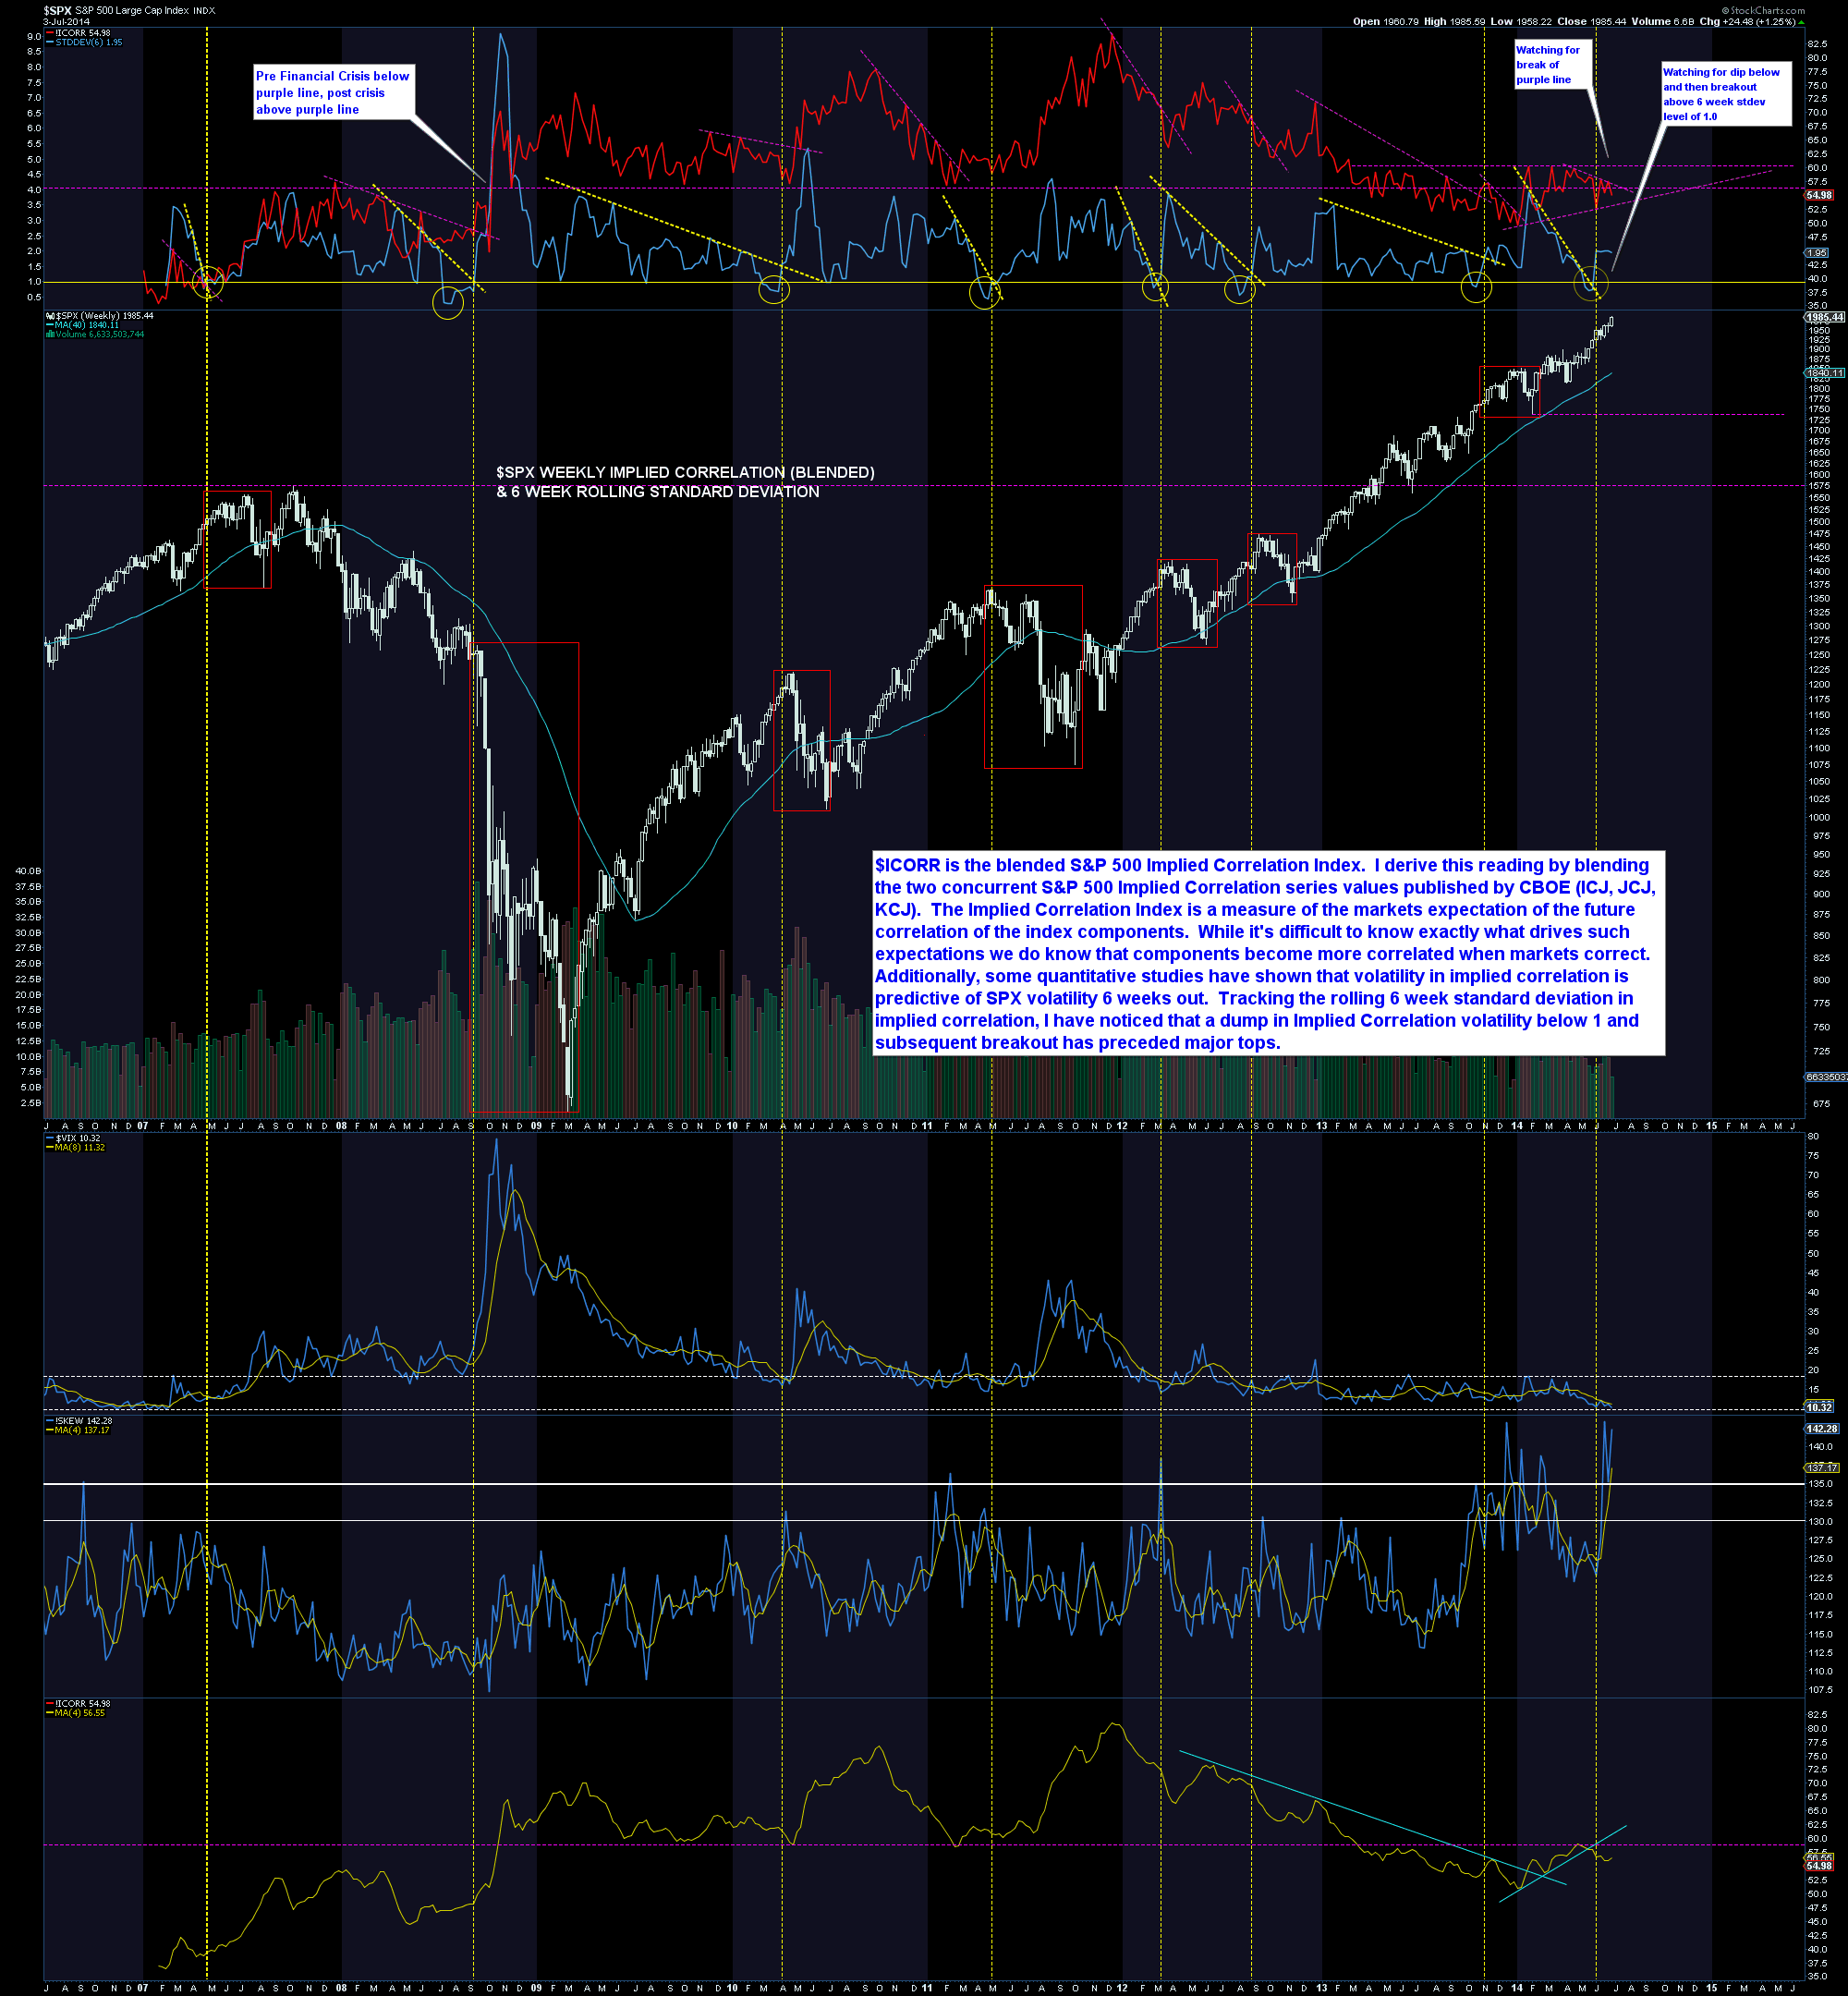
2. Implied correlation at major peaks:

Source: Rory Handyside
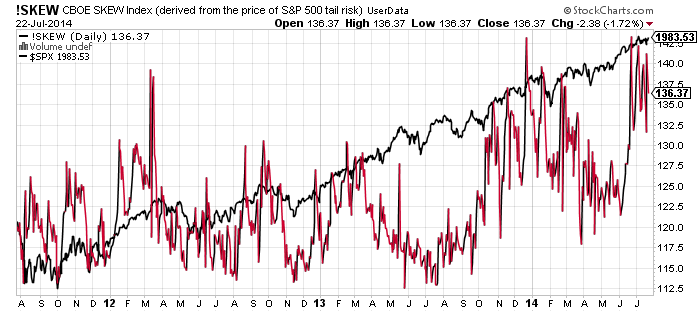
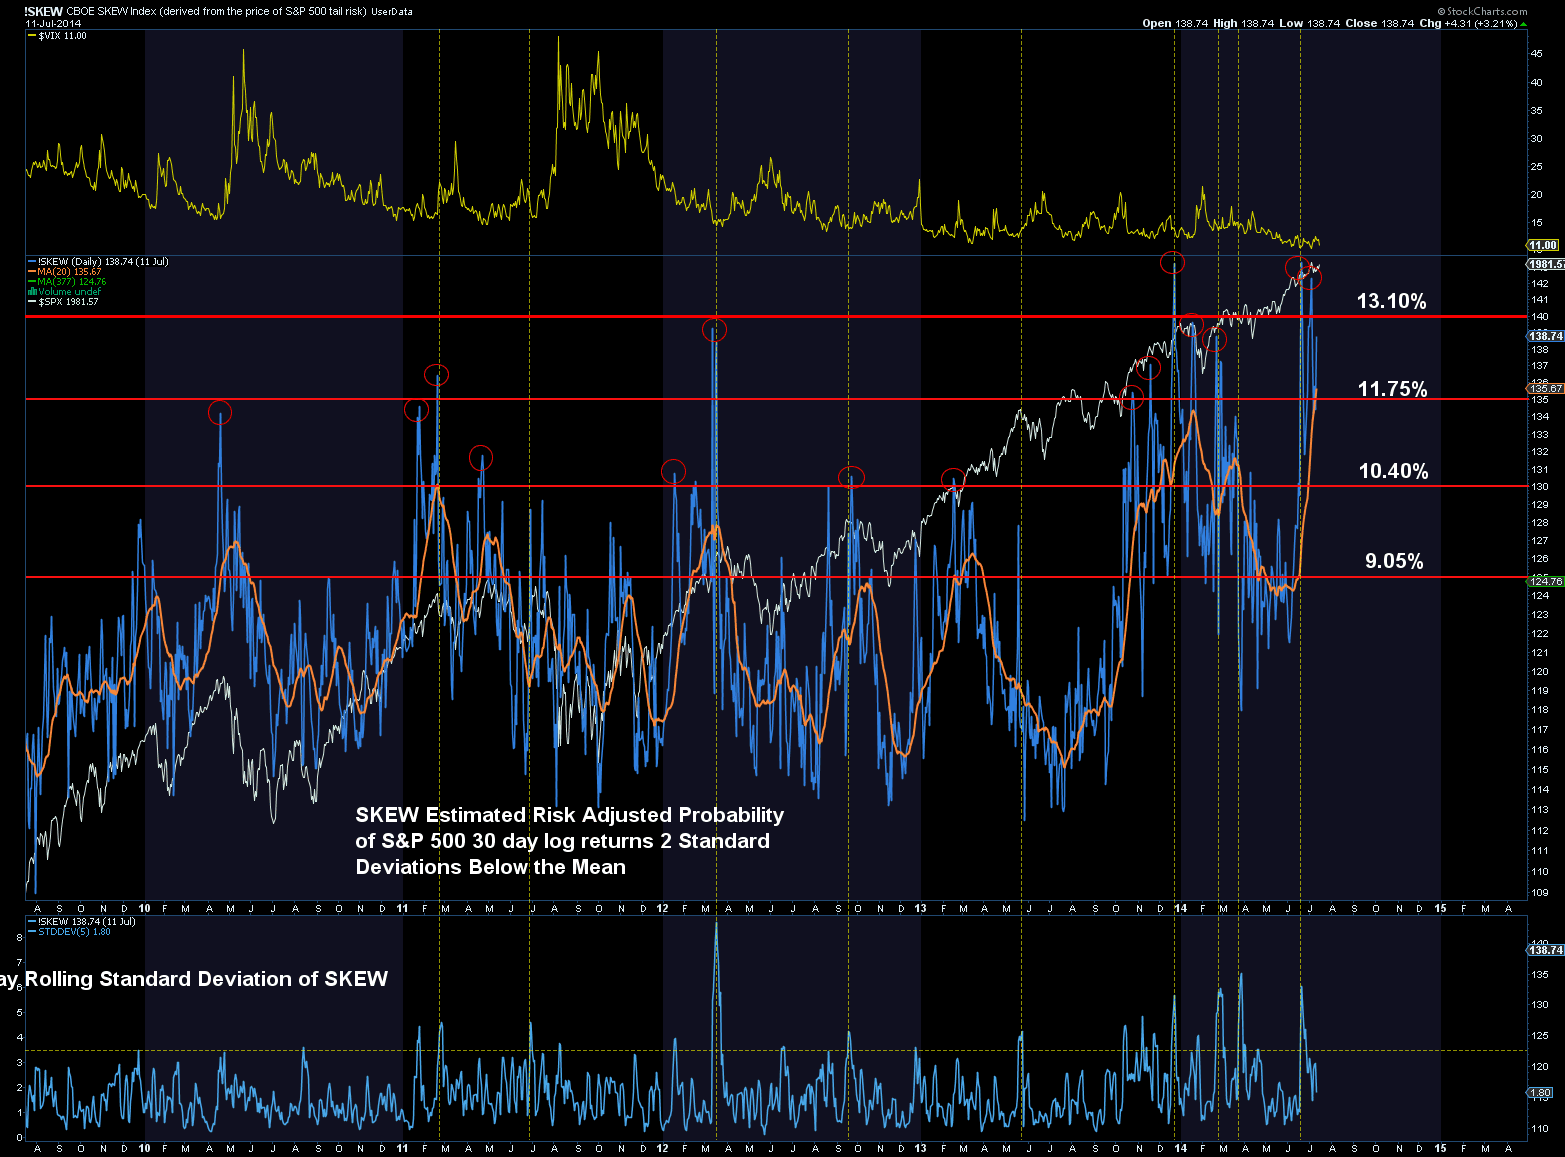
3. Skew at major peaks:

Source: Rory Handyside
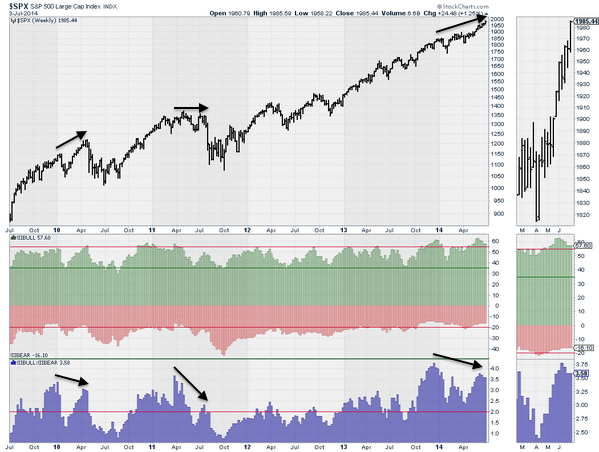
4. Sentiment at major peaks: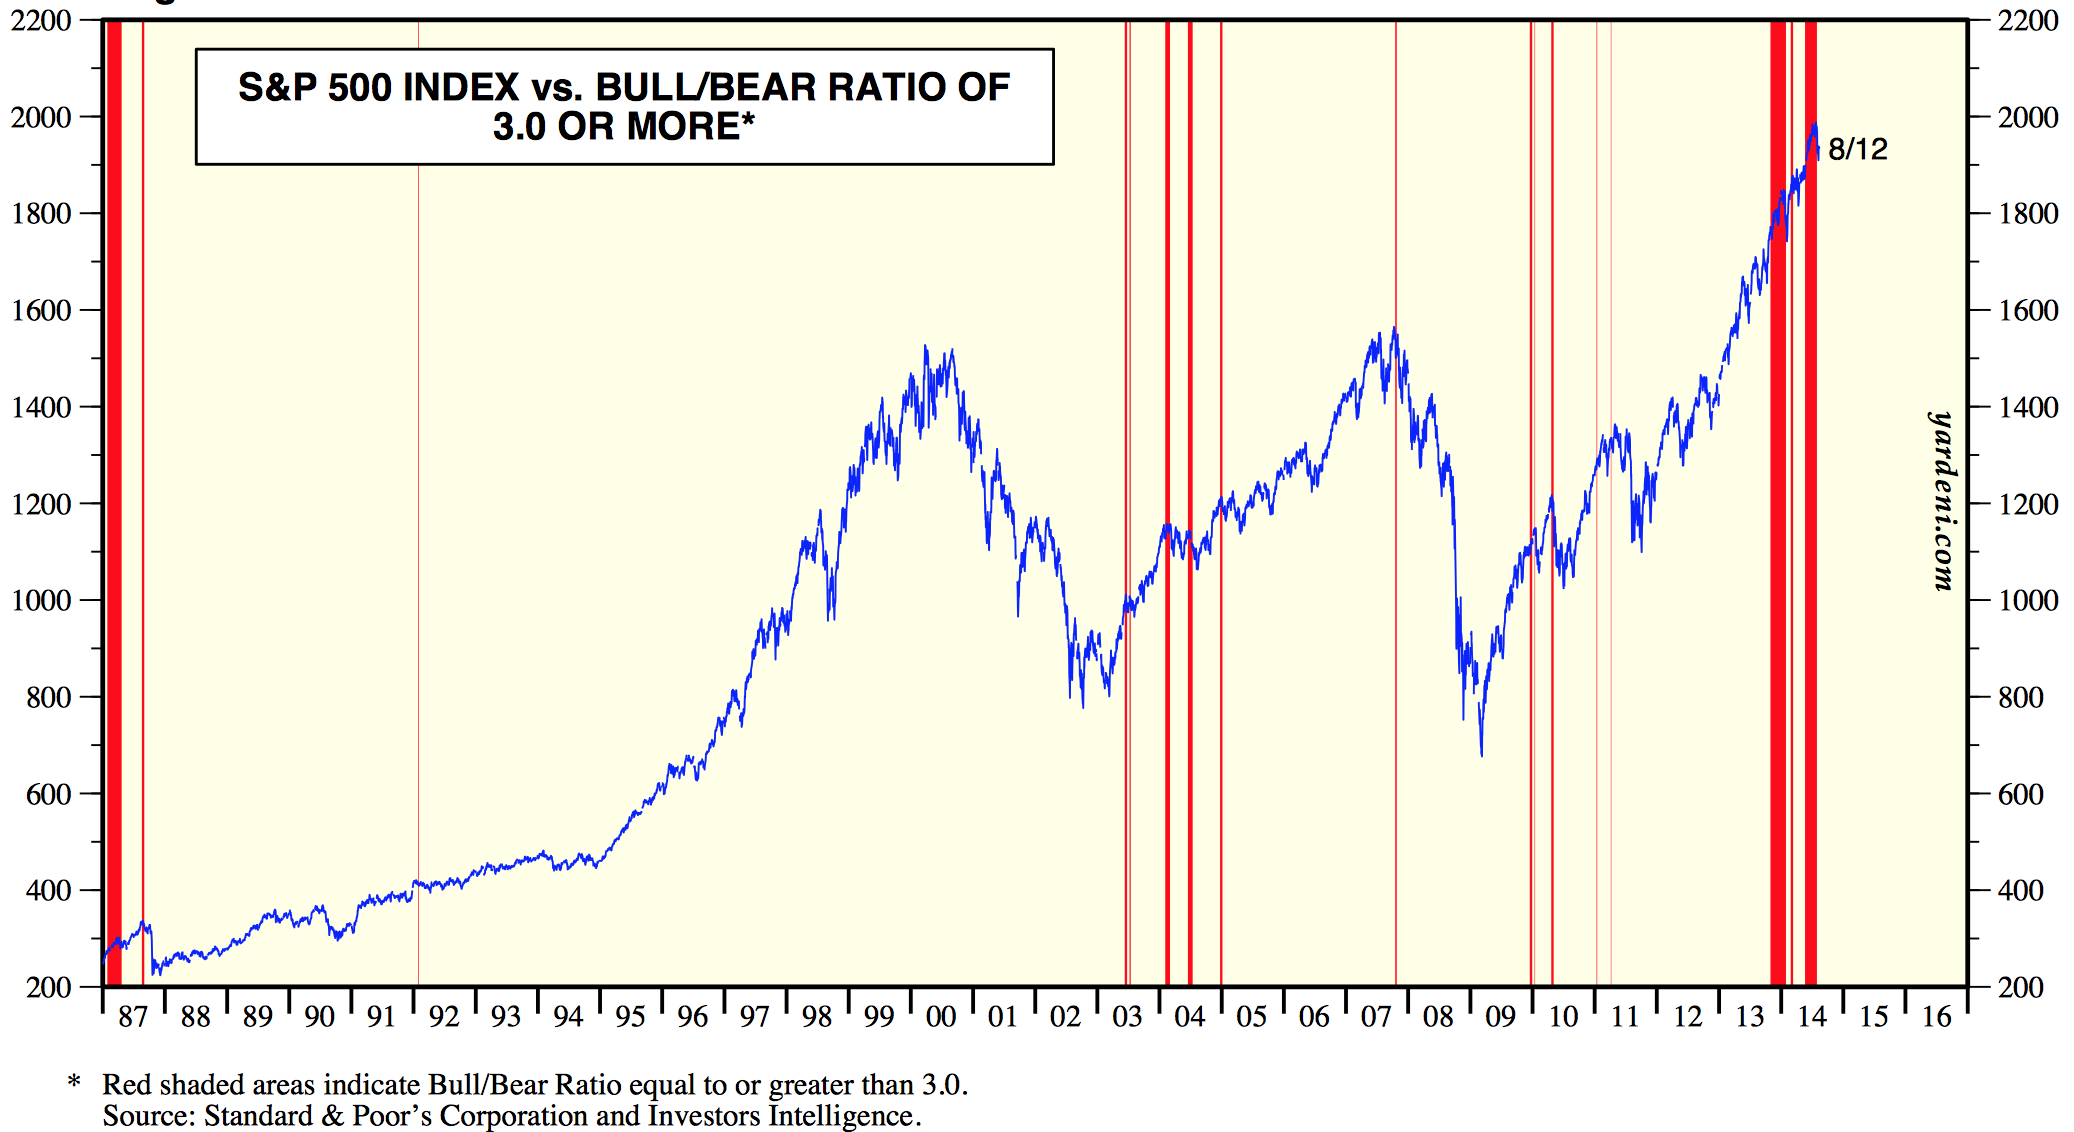
Source: Ed Yardeni
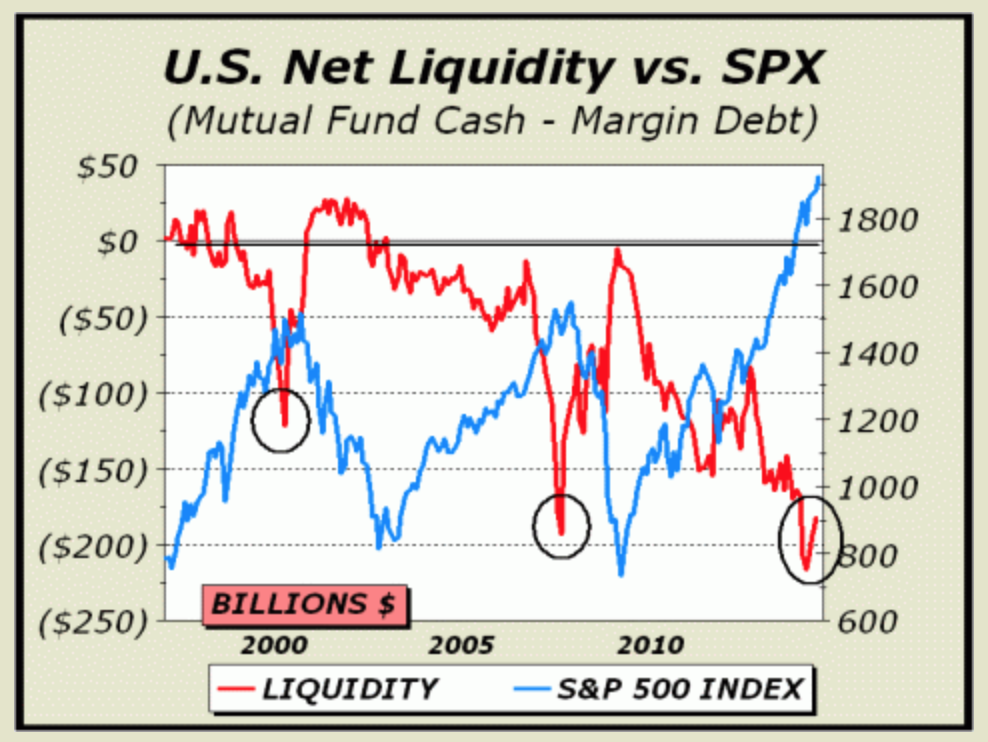
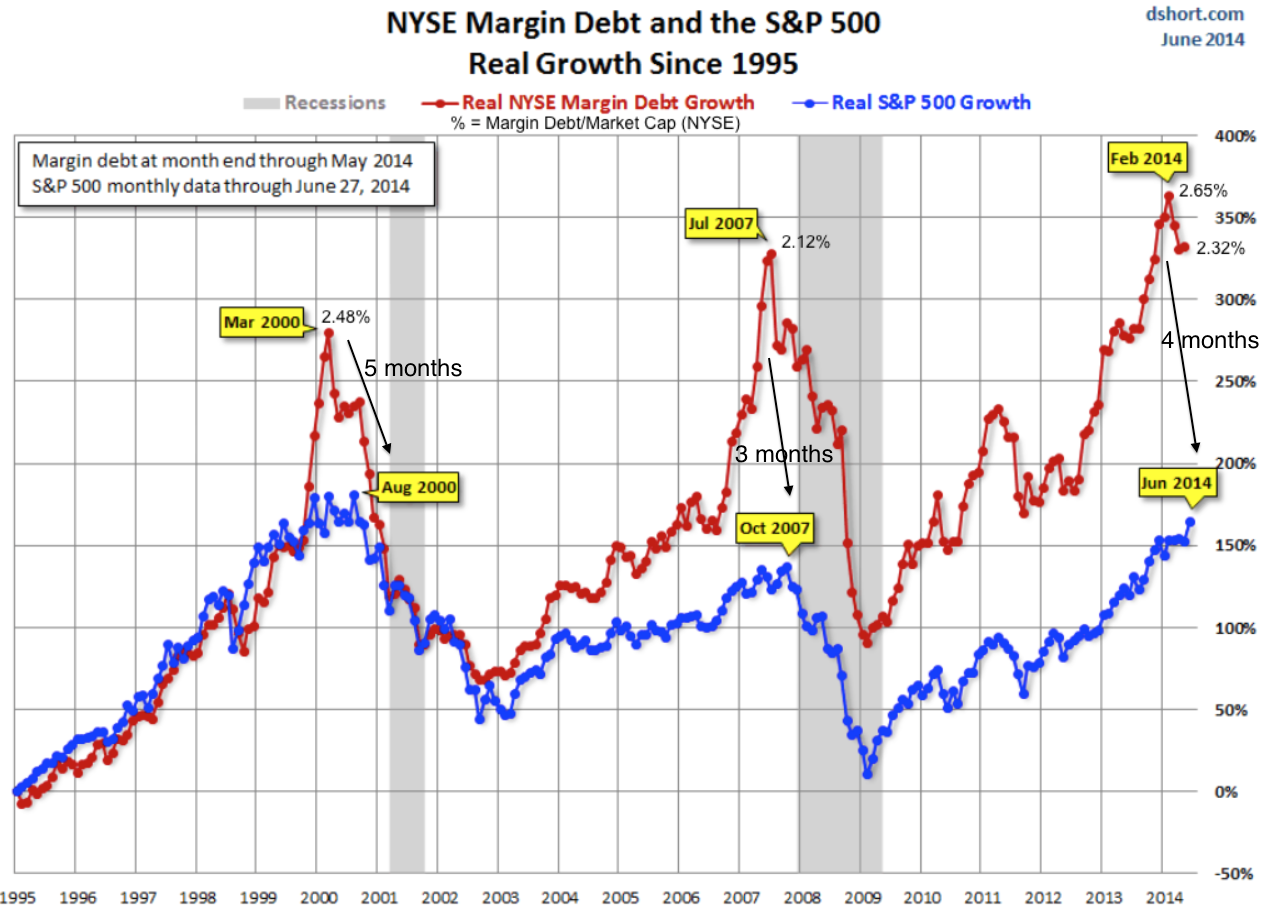
5. Valuations at major peaks:

Source: DShort
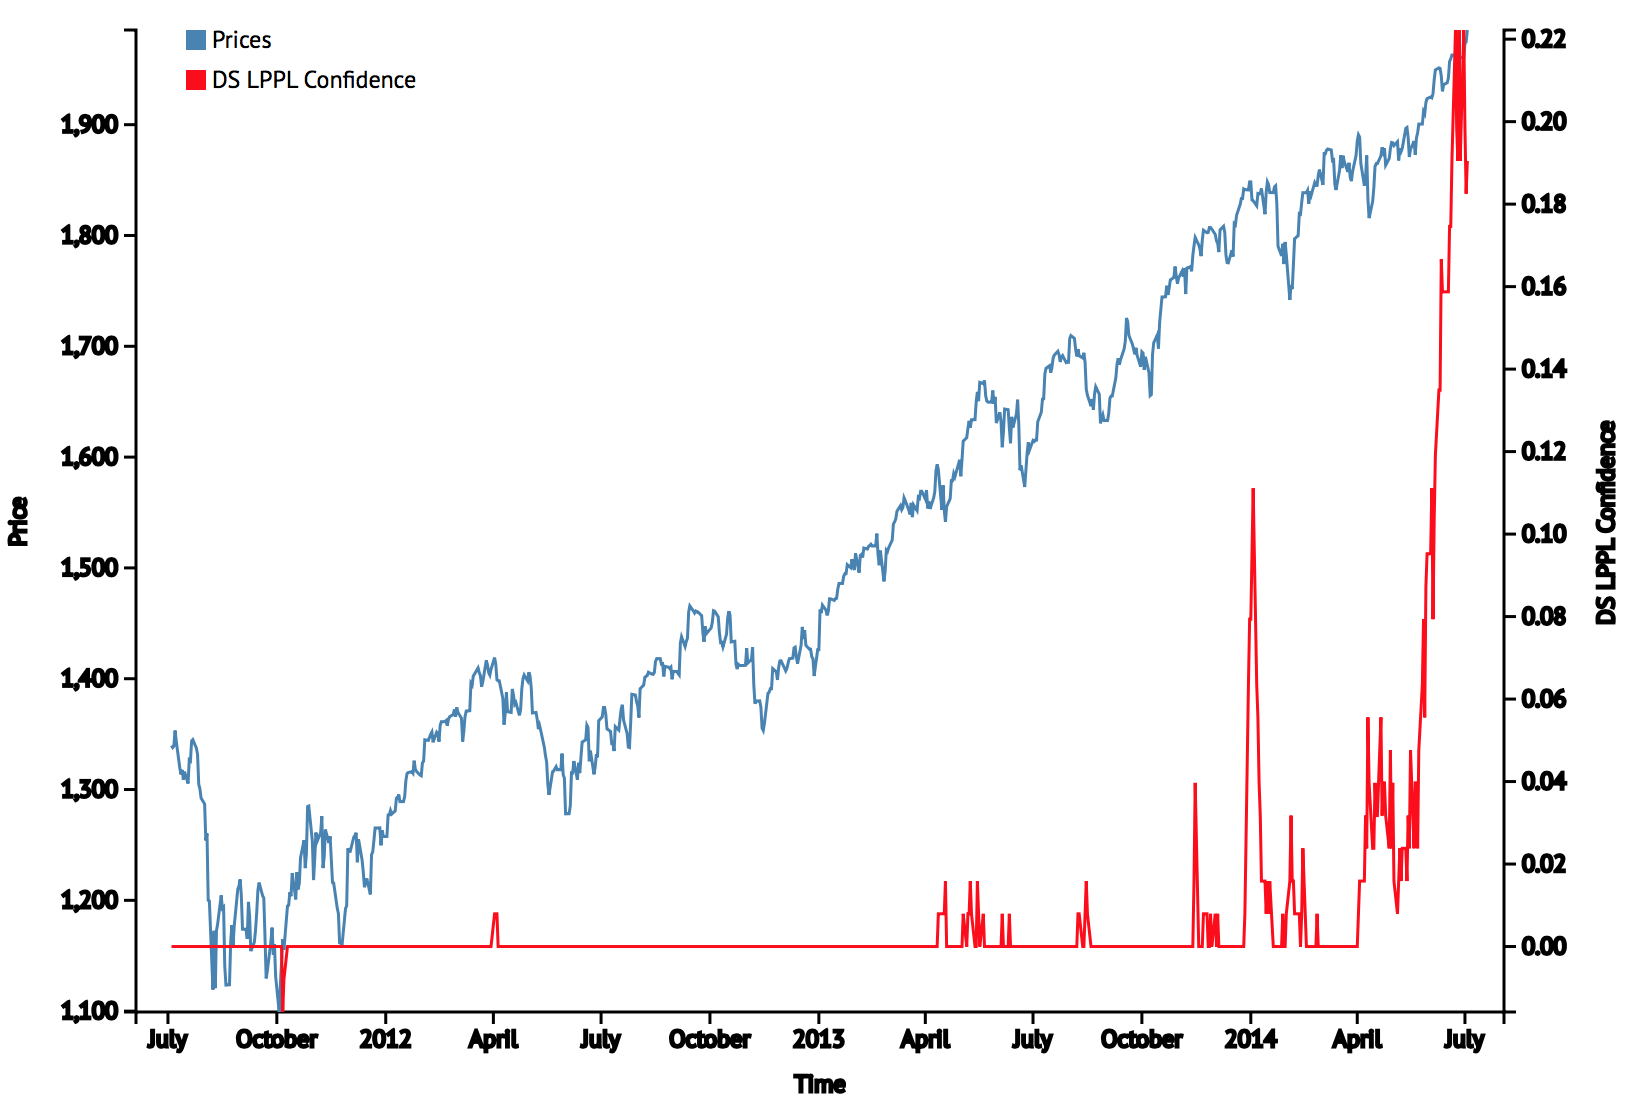
6. Sornette bubble end flagged at the start of July:
Source: Financial Crisis Observatory
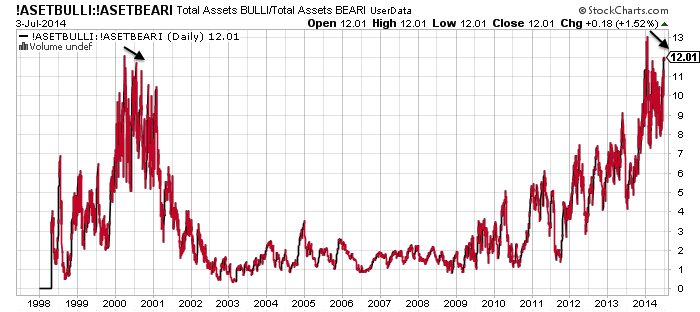
7. Various risk measures peaked, along with the Nikkei, at the turn of the year:

8. Rydex allocations echo the 2000 peak:

9. Sector rotation shows the two post-peak sectors of health care and utilities performing strongly relative to others:
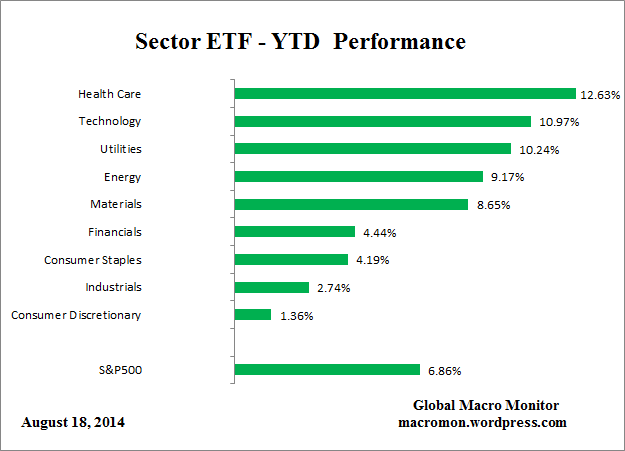
Source: Macromon
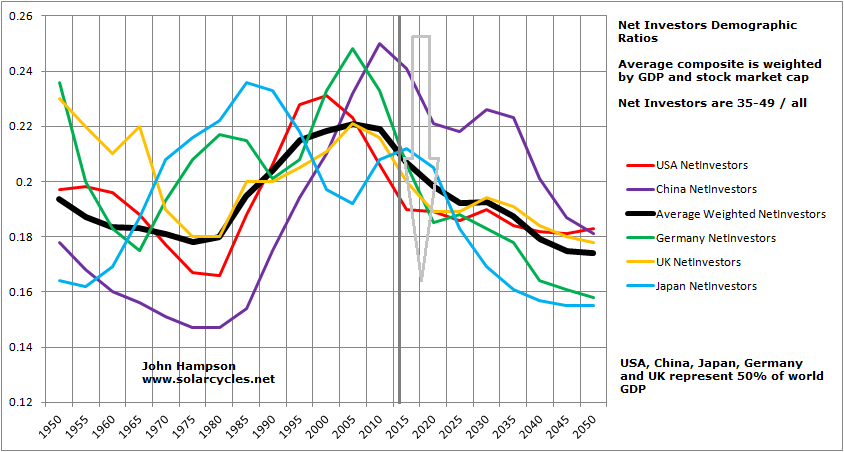
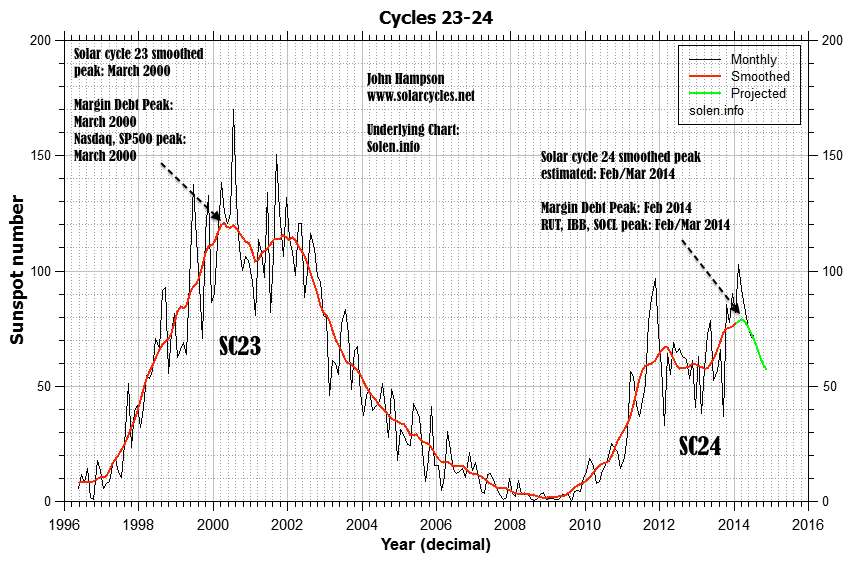
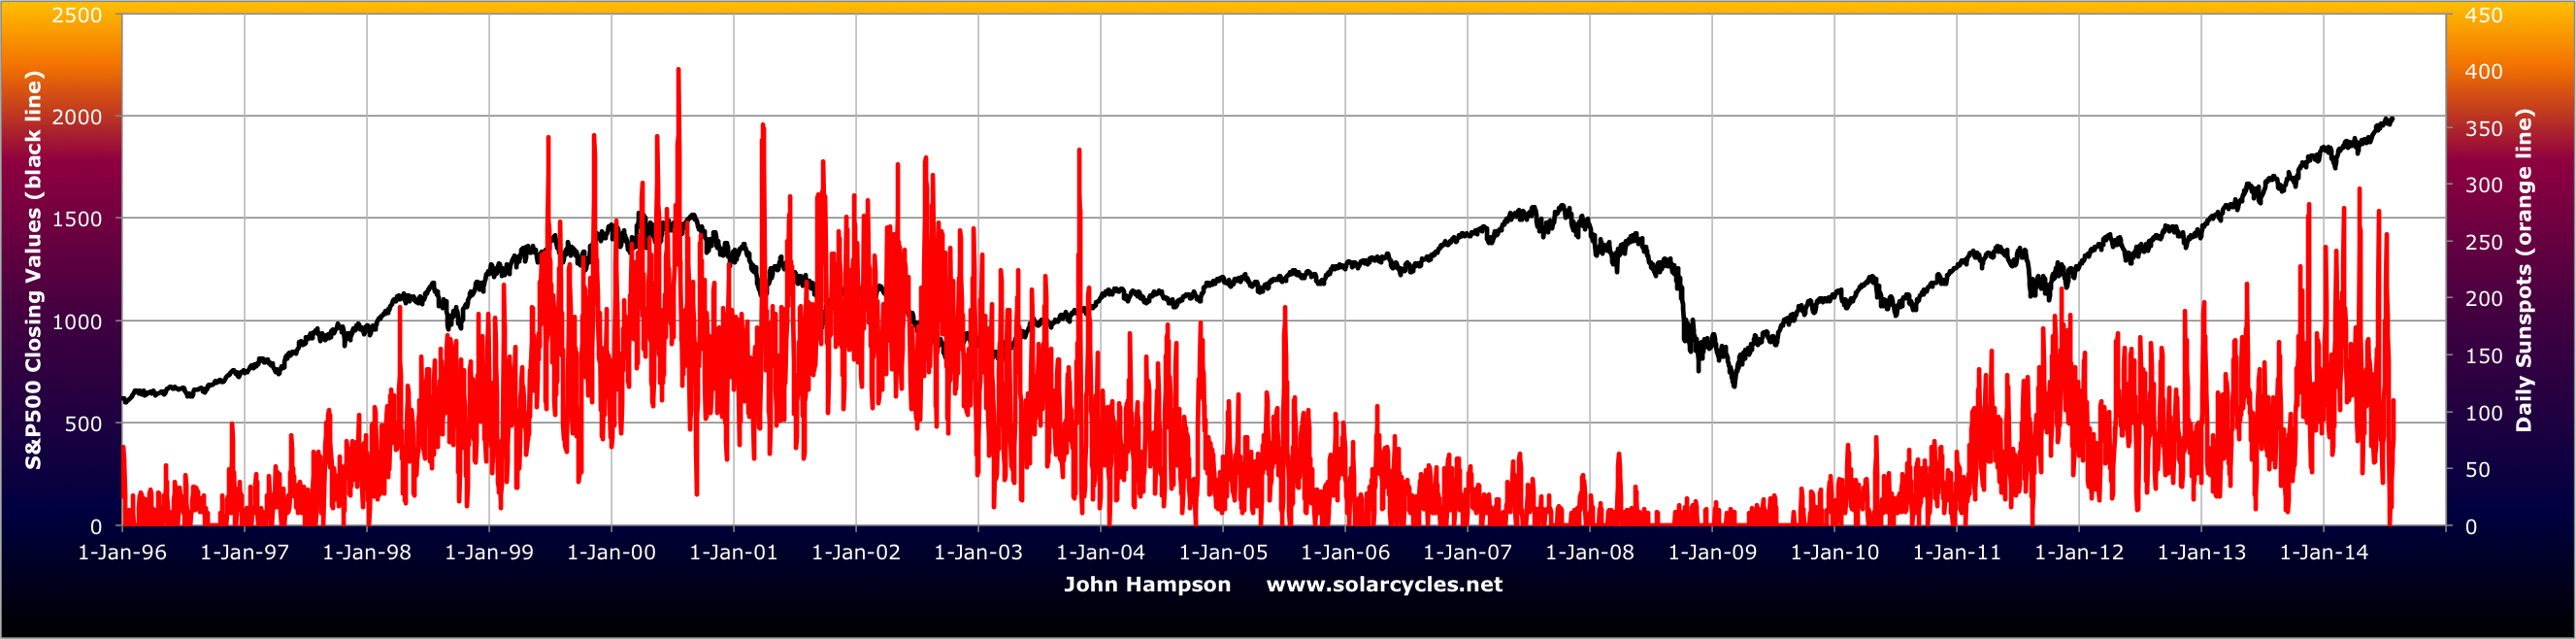
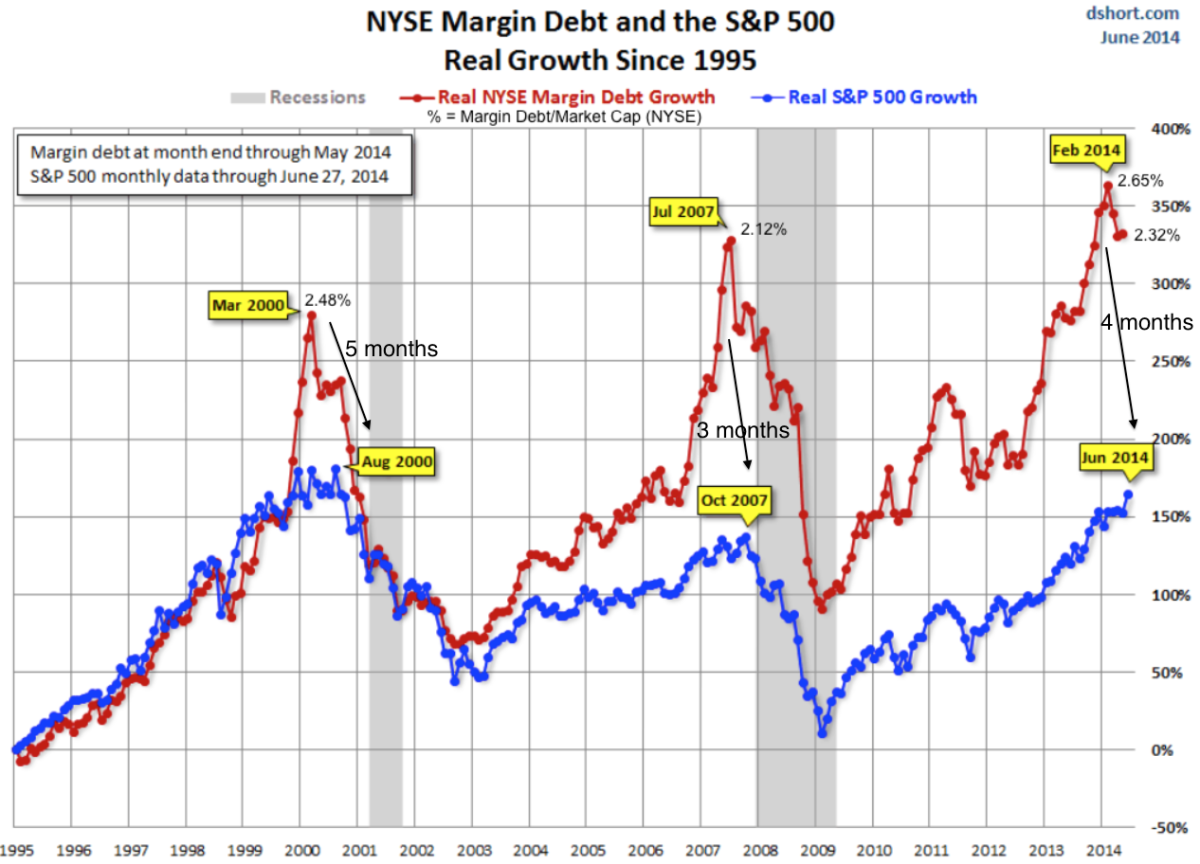
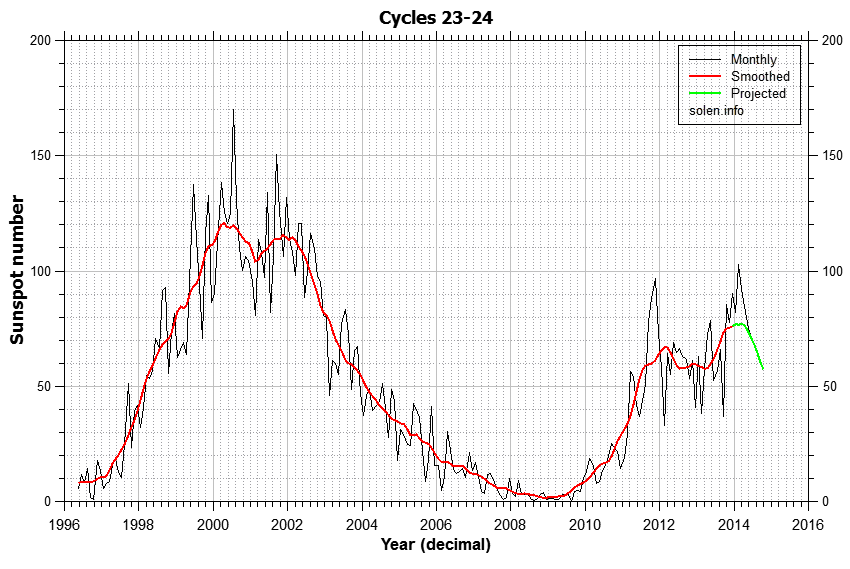
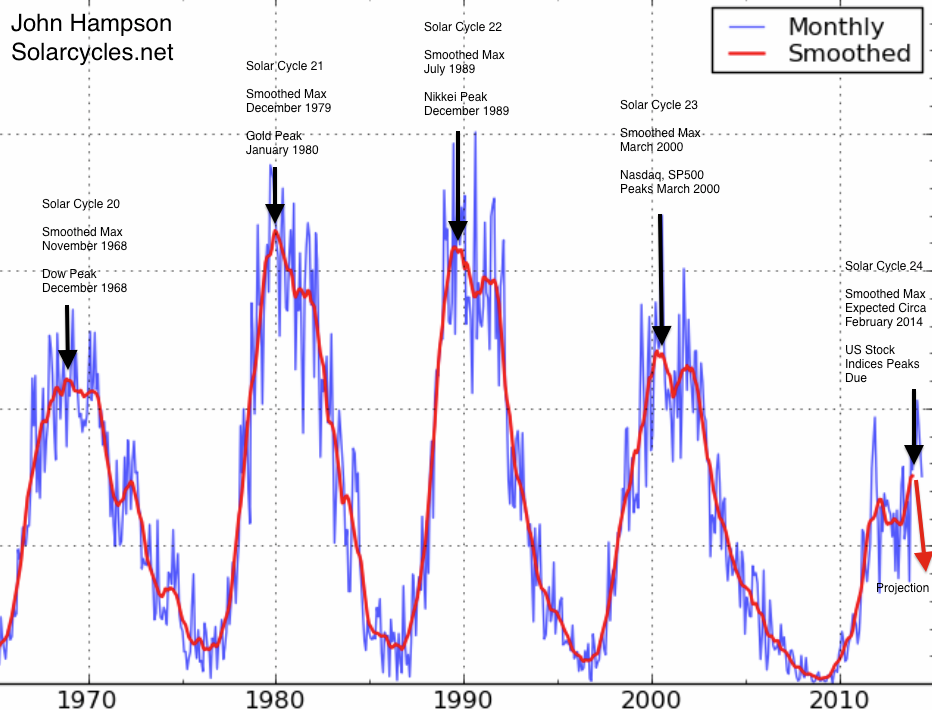
10 Sunspots continue to be in a waning trend since their February peak, and a smoothed solar maximum of Feb/Mar ties in with margin debt and hot sector/index peaks of Feb/Mar as the speculation peak epicentre:

To sum up, I am looking for European indices, RUT, SP500 and DJIA to make lower highs / failure highs / second chance peaks by the end of this week around the new moon, and thereafter break downwards into post-bubble-pop momentum, into the geomagnetic seasonal low of October. Past analogs show hard falls lasted up to 8 weeks, which ties in with the available window from late August into late October. The mulit-angled case is still strong for a major peak not just being at hand but being in already, and the out-of-hours, low volume nature of this rally since 8th August add to the likelihood of it failing and cementing the broad July final peak in risk, in a topping process that began at the turn of the year.


