

New moon this coming weekend and the seasonal geomagnetic model peak.
 SP500 is still in a topping range since July 3, with RSI and Vix divergences.
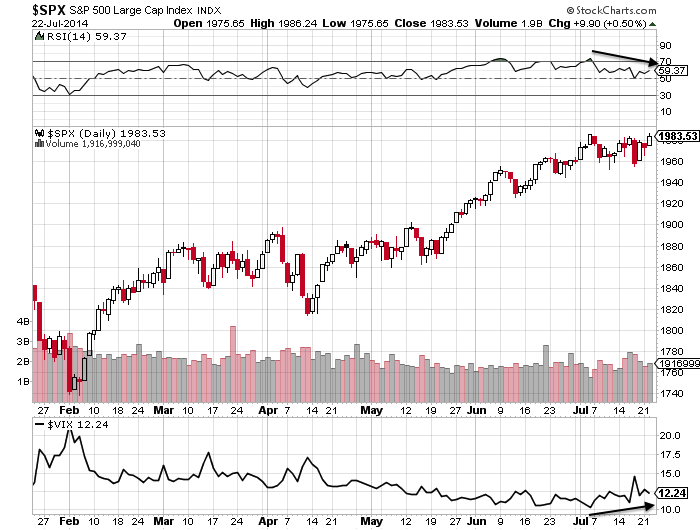 Source: Stockcharts
Skew continues to flag an imminent correction.
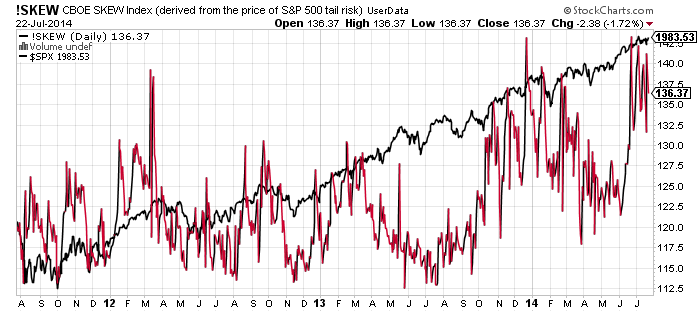
Source: Stockcharts
Small caps are at historic overvaluation.
 Stocks earnings relative to bond yields at historic level. 2014 is 1937 to 2000’s 1929: one solar maximum later and a similar backdrop.

Source: Martin Pring
Margin debt to GDP: 1987, 2000 and 2007 all gave rise to waterfall declines.

Source: Martin Pring
Investors Intelligence sentiment. A 6 month double peaked concentration of excessive bullishness, like 1987.

Source: Ed Yardeni
Liquidity negative spike as per 2000 and 2007 peaks.
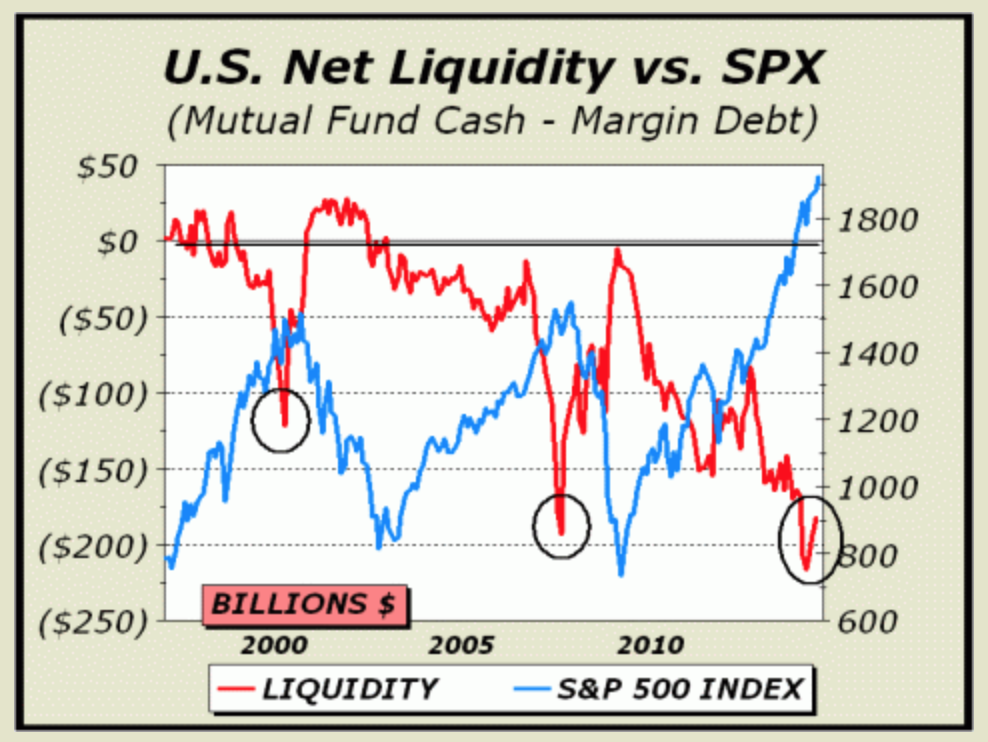
Source: Cross-Currents.net
Baltic Dry Index collapsed again.

Source: Stockcharts
The solar maximum has waned sharply.

I’m feeling confident that this is finally it. It’s been a 7 month topping process, during which we’ve seen extreme indicator readings and negative divergences develop, margin debt, hot sectors and the solar maximum peak out, and two distinguishable peaks behind the scenes. I’ve been able to publish 100+ charts warning of the top between December and now, with some of the latest charts filling in the missing gaps.
Small caps and European indices have already broken down, leaving US large caps to now join and complete. Large caps may potentially overthrow to new highs into the coming weekend’s new moon but if so it will be on negative divergences and unsustainable. Thereafter we tip into negative lunar pressure and August to October provides the seasonal backdrop to market falls, due to the seasonality of geomagnetism. A congregation of indicators suggest the sharp falls will erupt in this period.
I’ve done my best to produce a cross-referenced multi-angled case for why this is a (i) stock market peak that will give way to (ii) waterfall declines within a new (iii) bear market. If you are sceptical about it, you are right to be: until price turns down definitively then it’s just theory. But it’s the strength of the case which gives me the confidence – once large caps break I will be looking to add short with stops and build in as much as possible, on top of the existing short portfolio. It’s another decade until the next solar maximum, and I see this is as a golden opportunity.

Excellent and thought-out analysis John. Thank you for sharing. The case is getting stronger every day those divergences continue on the charts.
Your thesis has gotten a supporting vote from the BIS, the central bank’s central bank, saying “The risk of normalising too late and too gradually should not be underestimated… The trade-off is now between the risk of bringing forward the downward leg of the cycle and that of suffering a bigger bust later on…The road ahead may be a long one. All the more reason, then, to start the journey sooner rather than later.”
http://notquant.com/did-the-bis-just-call-for-a-collapse/
It seems the central banks are very well aware of the natural cycles that exist in the market and that delaying the natural cycles will cause a bigger bust later on.
We say don’t fight the Fed. The BIS( the Fed’s boss) is saying they don’t want to fight the natural cycles.
Lehman was leveraged 42:1. The Fed is currently leveraged 77:1. This may get ugly.
http://notquant.com/there-is-simply-no-way-out-the-fed-is-leveraged-771/
There are those “magic 7’s” again. Fed’s leverage = 77:1
Thanks Peter
Thanks John. Q2 GDP out this Friday. I’m expecting this to disappoint. Any negative print may give us waterfall declines. However, initial estimates are always over estimated. Therefore we may need to wait for a revision estimate to confirm if the US is in recession.
True
…on IG Index you can buy weekly puts on 1960 level right now for 0.99. If it reverses and closes red on the week from here nice little trade. Risk 1 to make 99.
“UBS conceded that it might get the timing wrong, “but we believe the risks are asymmetric. On balance we think it is time to be tactically low on risk.” And so: “We decide simply to reduce risk over the full spectrum of assets.”
When the largest player in the wealth management industry warns that all asset classes are overpriced and too risky and that it’s time to reduce exposure across the “full spectrum of assets,” and if in fact it starts selling some of its $1.7 trillion in wealth management assets in a market that is already lacking liquidity – that act in itself can trigger the very sell-off it is warning about. So fasten your seatbelts.
Rather we think the event tells us a story about market positioning and market pricing: we think the market is stretched. If this is true, the market is already pricing most of the potential good news and is prone to react to bad news.
Our economic surprise index has been very highly correlated with the S&P 500 until the beginning of last year. Since then the market has continued his rally with little fundamental improvement to support it. This divergence is becoming uncomfortably large.
And UBS thinks one of the catalysts for a market correction could be “the disappointment” from corporate earnings reporting season. It’s particularly worried about the Q3 and Q4 outlook: “estimates seem to be too high, and we are starting to see companies spend less on buybacks (EPS supportive) and more on M&A.”
http://wolfstreet.com/2014/07/20/ubs-warns-everything-is-overpriced-prepares-for-sell-off/
UBS is conceding your earnings outlook John 🙂
Have nice holidays and occasionally take a look to the mkts, wait and see, John.
From jul to sep´14 likely within a mid correction.
@apanalis
John,
Aren’t we still in an Appleconomy? Now that it has its mojo back it is a trend setter based on size, innovation, etc alone. We also have Gilead which will blow out #s tonight as well as bio tech up already an astounding 6-7% today. Biotech I remember you said was key to rollover. It has done so twice with higher lows. Couldn’t the US markets be getting fuel from those you have pointed out that have rolled over (Europe, etc) that could propel indexes much higher from here?
My question for you is, when you say you are confident we rollover, is it after a burst thru 2,000 on S&P ? It seems if we get there after this long consolidation that it will be a major confidence boost and even more money will chase yield and could ran hard if 2,000 is breached.
I can’t rule out your case, but for me a peak over 2k would be an overthrow top to terminate. Either this current range is the peak, or it stretches over 2k by the weekend only to reverse thereafter.
Thanks all
Also, today is the day marked for André as the beginning of the drop. I’m very curious about André’s theory.
So please André, if you read this, can you explain more about that ?
It looks like than John’s work and André’s work, are complementing well.
Thanks all.
First, the timing of today. My indicator showed the start of growing gravity this weekend (sunday). But the tidal pivot period ran into Tuesday, meaning the gravitational turn wasn’t complete yet. Then tuesday night we had an inversion, meaning the market goes up against the gravitational trend (for one day).
Further : july 28th we ‘ll see the highest apogee in almost 2 years. This means the moon is farther from earth than in many months. This is the most promising chance for the market to put in a high. As the moon doesn’t make sharp turns, approaching apogee means the speed of the moon is reducing by now, what you can read as declining momentum.
The speed of the moon will be highest between july 28 and august 10. This is also a record speed. Speed of the moon brings volatility, needed to break the uptrend.
Last; the average distance of the moon to earth shows 3 to 4 months cycles. I think this is where the 4 lunar period cycle comes from. Point is : it isn’t always 4 months. Anyway; we just started a cycle that brings the moon closer to earth, meaning increased gravity, and lower markets for the next few months.
Last; my cycle indicators (not about tidals) on longer term frames are down.
I hope this is clear.
Excellent explanation of a unique theory. Fantastic work. Your back testing has given validity to the theory? We have a perfect time over the next few days to give it another test. Good luck!
Andre thank you for your educational work
Andre,
Hope you succeed in your system development, but my bet is that you will find no answer to all the small one day/two day moves in the stock market. Some moves are purely accidental, someone is buying, someone is selling, demand/supply imbalances. Not everything comes from gravitation and stars. For example, the market often flexes at the end of a month, week, bank holiday (last 4th of July), or at some precise hours on intraday time frame, as real people take decisions in real time. The price action is sliced by human time and modern calendar.
If the sun can bend human perception over a time, market’s day to day price action is generated by currently active participants. Some participants are asleep, some on holiday, some enter the market, some exit, everybody has something else on their mind; bigger demand/supply moves the market. Moreover, the index is a sum of a number of stocks, who all behave differently for individual reasons.
I don’t think you will find an astronomical/physical tool to control those dynamics.
If you work too long on something with no practical results, it’s time to give up and look elsewhere. Otherwise you may end up selling snake oil like your ‘Paradigm’ guy, instead of making real money for yourself.
despe906,
I have seen enough to know this analysis has value. I have also stated that the true solution can never be found in one force (gravity) when the market is affected by multiple forces (at least 3 I know of).
This weekend I’ll post a little off-topic on how the brain works; It is the answer to why the market reacts to natural forces – the central idea in John’s approach.
This is a learning proces. I give my forecasts to put myself to the test and be vulnerable to your remarks. Motivates me to try harder.
Just hope you keep an open mind; we’ll see how far I get.
Cheers,
André
Andre,
I think you are on to something. More power to you. There is an invisible hand behind all.
MACD so far failing to confirm this break on the SPX
http://stockcharts.com/h-sc/ui?s=$SPX&p=D&b=5&g=0&id=p42716378803
Things may perk up for the bears by end of this month. Just saying….
big banks wants the market goes up and with futures, fed support, cheap money, media, they could drive the market where they wants despite hundreds of charts that talk about the past. Remember that inflation is a factor that goes against bears and that short etf had a time decay factor or that holding futures costs the interest you must pay to your bank.
It is often a losing game to hold short positions. And this moment seems an ordinary losing moment.
Moreover bubbles could grow beyond any rational level.
I think we will see nasdaq over 2000’s highs , so fed members will be proud of themselves and they will think people should admit fed is invincible and us is a great nation. Nasdaq at 5500 by 2015’s end
Interesting video … no signs of a major top. http://youtu.be/OZE0sCHPmrs
I’d like to see “spx/FED balance sheet” chart. Someone could say it doesn’t meaning nothing because bla bla bla …but for now everithing else is a bla bla bla.
Here you go: SPX vs Fed’s balance sheet.
http://charleshughsmith.blogspot.com.au/2013/12/dow-40000-spx-4000-is-this-fed-fueled.html
That chart is referenced a lot, but if you look at the longer term view, the correlation is weak: http://www.ritholtz.com/blog/wp-content/uploads/2013/09/chart1.jpg
Correlations dont have to be forever. For example, copper used to be a good correlator to indices. Now its the FEDs balance sheet until it isnt.
Andre, where can one obtain data and numbers on the ‘speed of the moon’? Tks.
You can calculate this from the apogee/perigee table you can find on internet.
Andre, reading some of your recent posts you
appear to change your short term outlook frequently.
Phil,
Gravity is a knife that needs sharpening, and I’m in the process of doing that. I give my forecasts 4 weeks ahead of time. If you have a better technique I’d be eager to hear about it.
André, thank you very much. Your work is refreshing and inspiring
Nasdaq100 11 gap unfilled in the last 3 years… it’s easy with futures and options to manipulate market. 2000 bubble was create with overnight sessions gap-ups. it’s just a game where big banks always win…and when they doesn’t government arrives with taxpayers money…
Reblogged this on thedarklordblog and commented:
Perma-bulls look like geniuses at the present time. This is about to change in my very humble opinion.
http://stockcharts.com/h-sc/ui?s=$SPX&p=M&st=1987-01-01&en=today&id=p66760428759&a=155290822&r=1406166840595&cmd=print
The SEC has just voted to close the gates on money market funds which represents $2.6 trillion. This means money market funds have the right to suspend redemptions now to allow orderly liquidation…(liquidation? hmm)
http://www.zerohedge.com/news/2014-07-23/gates-are-closing-sec-votes-through-money-market-reform
There are two points of contention here:
1. The SEC (political) may be trying to encourage people to move money out of money markets into the equities market to continue or increase the capital flow into the equities markets now that stimulus is tapering or even stopping. This source of capital from scaring participants out of money market funds and into yield chasing assets is hoped will fill the void left from decreasing stimulus and even the Fed trying to covertly reduce their balance sheet. If this plan succeeds, it could extend the current rally and delay the natural long cycle in the market even further which means the equity market would continue further upwards.
2. The head of the SEC had the following concerns:
“As the chance that a gate will be imposed increases, investors will have a strong incentive to rush to redeem ahead of others to avoid the uncertainty of losing access to their capital. More importantly, a run in one fund could incite a system-wide run because investors in other funds likely will fear that they also will impose gates…And if investors are not able to redeem before the gate comes down, they will be harmed as they are deprived of access to their capital. Ultimately, this contagion could freeze the wholesale funding markets in much the same way as occurred during the recent financial crisis.”
It was an electronic run on money markets of $550 billion in an hour or two that started the last financial crisis. (Skip to 2:22 of video below). Treasury estimates if they didn’t shut down the money markets that day, $5.5 Trillion would have been removed from the system by 2:00 that day! This is one day we are talking about.
Those in the power elite who engineer the rise and fall of the markets may know they may not be able to outrun the natural cycles John has built his thesis on.
They have shuffled the chairs on the deck of the Titanic many times before because “when the music is playing you have to get up and dance”. Has the music stopped playing? It appears they are readying the lifeboats.
Assumptions are made that money leaving overpriced bonds will enter equities on long side. What if it goes to short position etfs?
Thank you all
Thanks for the excellent thorough analysis John.
McHugh agrees with you on the timing. He is good at recognizing technical setups. Here is his Wednesday summary:
Stocks were mixed Wednesday, July 23rd. The price pattern since the July 3rd top is clear, a sideways symmetrical triangle in the S&P 500. This sideways pattern needs five subwaves. It is possible to consider this pattern complete, with Tuesday’s rally the start of wave {5} up and Wednesday’s move a small part of this rising leg. We show that chart on page 24 in tonight’s newsletter. Wave {5} up should take the S&P 500 toward 2,000, possibly a bit higher. That move will complete wave c-up of large degree c-up, possibly near the end of July. Then large degree wave d-down will follow.
Supporting the rise to above 2,000 over the next few weeks is the new stock market Buy signal we got in the VIX on Friday, July 18th. Stocks often rally from 3 to 5 percent after a VIX stock market Buy signal. However, there are Bearish divergences all over the place in key indicators versus stock prices, suggesting a large decline is around the corner, likely coming after the wave {5} rally ends. ”
Buckle your seat belts guys. 🙂
Appreciated Mae
Andre, your post from July 20th .. “from Wednesday the downtrend will accelerate ..”
Like I said; this is a learning proces. Everytime I get it wrong I learn. That’s the only way to get to where I wanne be.
Andre, with respect I do not see value in the analysis,
but good luck.
Knowledge can only grow when people disagree. I respect your position.
Waiting for da Bear. I know tops wear one out, but man this is 200 lashes! The most profound thing I have ever seen on trading is: Buy buy signals in a bulll market and ignore sell signals. Vice versa in a bear market. Briese in the COT Bible. Eventually, one must make an end judgment of the majority is right during trends and wrong on both ends. The problem, as I see it, is the credit cycle, which receives little mention here. For over 100 years it has taken a rise in interest rates to generate a bear market. Has not happened yet! Well, eventually all indicators have an exception that proves the rule. All the wonderful charts that John has shown us plus it seems that the majority of people on CNBC repeatedly iterate don’t fight the world central banks (FED). Therefore, we are making a reasonable long odds bet. The summation index gave a sell signal 3 weeks ago. The market has moved up. That is the epitome of ignore sell signals. But even bull markets have corrections, don’t they?
This is exactly the knd of irrational articles one would expect to see at major bubble tops.
There is no doubt that FB is a the leader in its market amd it has a bright future BUT……I don’t care how bright its future may be it does not deserve the current valuation.
http://finance.yahoo.com/news/facebook-soars-as-zuckerberg-s-cash-machine-kicks-into-gear-124221313.html
The current backdrop is interesting: on the surface, data is positive (unemployment low, jobs being added, corporate profits strong, China is still growing, EU “recovering”, etc.) so there is no apparent fundamental reason for a decline in the market. But this “good news” has been constructed by 1) statistical sleight of hand or 2) an extraordinary expansion of credit and systemic risk.
Those looking for a fundamental reason for a decline find none. Those looking for at monetary policy see the Fed tapering as having no ill effect. But anyone looking at the risk piling up in the credit system that underpins all the “good news” see parallels with previous downturns.
Meanwhile, the ‘don’t fight the Fed” crowd seems not to notice that the Fed has tapered QE from $85B/month to $35B/month–an annual reduction of $600 billion. The initial taper caused periphery markets to roll over, and this weakness typically spreads from the periphery to the core.
So while there appear to be no fundamental reasons for a decline, it’s matter of what we’re looking at as ‘fundamental.” If credit and risk are fundamental, then the market can drop despite all the ‘good news’ the financial press highlights.
I believe the economic cycle lags the stock market. Insiders with huge positions know the score before it makes it to the mom and pop investors, who are left holding stocks based on lagging economic data.
http://www.zerohedge.com/news/2014-07-24/marketwide-short-squeeze-5th-day-row
This week the rise on wallstreet was caused by the most shorted stocks. Shortsqueezes are forced transactions. Been wondering why my gravity analysis didn’t work this week (at least after Wednesday). But gravity only works when mood can do its work. Short squeezes are not about mood.
The upside is that the effect of shortsqueezes disappears within
days.
Andre the gravity bias might actually work better trading outright positions in the 10Y Note. Less games and levels hold firmer.
Trading inverse to the expected gravitational bias in equities. I’ve been buying off logical support levels this week for nice profit.
Andre, thank you for your feedback about the apogee/perigee tables. The following probably provides the data you reference?
http://www.astropro.com/features/tables/cen21ce/mo-ap-2014.html
Now, it would appear that I need help w/the calculations; as I am math challenged?
At least I am assuming that the question I posed can be quantified given the data of location, time and distance?
Thanks for thinking outside the box! I too find this fascinating.
You can read the distance from the table. You can see that in july/august we have the largest apogee and the smallest perigee. But the time of lunar turns stays the same. So more distance in the same time means more speed.
And detail timing I derive from tidal data from the Sandy Hook station.
The Hindenburg Omen might be the signal to watch for. Many financial and retail stocks hovering at 52 wk lows. One big down day and I think it will trigger.
Geopolitical events seem to be distractions rather than contributors to market price finding.
Excellent job. Thank you very much for sharing. Please keep up the good work and please keep shares. Your work is appreciated.
opps, I meant please keep sharing.
Thanks
Yes this should be golden opportunity as John says. Waiting for S&P to top around 2K level to add to positions. NDX should reach 4K in the same time. Gold may extend correction to 1260-1270 range which should offer excellent long entry. This levitation we have witnessed in amazement for last months and years is about to end rather abruptly. Market will treat bulls in the same way as has treated bears before so support lines and retracements levels will stop working or will serve its purpose very briefly. USDJPY will be key as it should finally give up after painfully long consolidation. Yes markets are supported in artificial level but this should cause even bigger and faster move.
Please also note that tomorrow is 25.7.2014 which can be reduced to 7.7.7 or 777. And 777 was appearing a lot in the news last week. Nice coincidence like in discussed IMF January speech. Now 777 can be again reduced to 21 and again to 3. Three or Third… what ?? Of course it is all accidental like S&P bottom of 666 in 2009.
Perharps the spx top is 1996 … 1+9+9+6=25 … 2+5 =7
After non-confirmation of new ES highs, after-hours sell-off means YM unambiguously enters short on the daily via a retest variation sell (a candle pattern of Ivan Krastins at http://www.profitfrompatterns.com):
http://screencast.com/t/AEUzw8gok
Looks promising this morning. Couldn’t break free from the range, plus after hours selling as Ultra says, and tellingly Tick, Trin, A-D and CPCI all now suggest the next move is down.
Could this be a Friday sell off into the close? Good news on facebook caught people long?….buy the rumour sell the fact type play after failed breakout?
YM was much weaker than the others yesterday and sub 17,000 now….need some downside volatility at the open and not just chop and sludge in order to break you think?
13 Fridays on the trot have been up – a break in that pattern would be welcome
What I really dislike is the AAII results- retail sentiment, despite Invest. Intellig.
@apanalis
John, do you know Investors Intelligence current week results?
@apanalis
http://stockcharts.com/freecharts/dpgallery.html#sentiment
Does anyone have any initial technical targets for the first leg of the decline? (I am assuming there will be at least one pause as the “buy the dip” crowd enters and price stabilizes for a few days). The first stop (my guess) might be the 50-day MA around 1,945 (SPX), 2nd stop 1,850, the 200-day MA, and the ultimate support around the old bubble peaks – 1,550-1,575. That corresponds to about a 20% decline.
It’s interesting that the VIX has remained under 13 despite today’s decline. That suggests selling is orderly and can continue.
Great point on the VIX. As long as we don’t get the same spike as last Thursday selling can continue. My personal thoughts are there is one more leg higher to a new ATH. Then i agree, we correct perhaps up to 20%
Charles,
Your targets represent the logical stopping points. Thank you for pointing them out.
My targets are significantly lower and much faster. I think this rally has been based on anything but logic and that when the declines come they will create a panic. (After that 1st buy the dip pavlov reaction you spoke to)
Could you share your targets? I have seen the market change since circuit breakers introduced in 1987. I would be wary to expect an exact repeat of 1929 or 1937. Things are also computerized right now, and so people can see the prices and send limit orders, rather than rushing to call a broker and yell to sell because it is too hard to enter limits.
Thank you Andre for your feedback. All the best.
The SPX is only off about 0.4% atm.
You need to close at or very close to
the daily lows, then have follow on selling
next week before you can even begin
to talk about this as a correction.
Definitely. We can talk about a correction when the April low is taken out ;D
http://screencast.com/t/vvq9Lh7bV
Andre, here’s another approach based on the moon.
http://moneytide.com/hans/index.asp
Judging from all those adds; I wonder if he’s making more money selling stuff
as opposed to trading. (:-)
The interesting thing is that he essentially does the same thing we do; analyze natural forces to forecast the market. Solar activity is mostly electrical I think. Haven’t got a clue how he models electrical cycles.
The U.S. has concluded, based on intelligence assessments, that the Russian president Vladimir Putin and his government are “culpable” for shooting down the Malaysia airliner that killed 298 people, White House spokesman Josh Earnest said Friday. “And that is why we are coordinating with the international community on a response that targets Russia for their actions,” Earnest said at the daily briefing. President Barack Obama will continue to lead the effort. Broader sanctions are under consideration in Europe, he noted, and the U.S. is considering additional sanctions.
Washington is… just as full of it as the next banana republic regime.
I see Russell 2k making another run for the highs, just like how it went up between 7/2000 and 9/2000. Then we have our peak. Bears are still too early, but will get it eventually.
This market is currently dealing with
worsening Russian relations and now
sanctions, Gaza, some poor US earnings,
weak euro area economic indicators,
multiple imminent correction warnings
on just about any financial channel and
on many online sites – and yet with all this
the SPX closes less that 0.5% down.
Folks you need to see a number of days
of decent % drops before claiming that
some significant correction may have begun.
If anything today shows once again how resilient
this market is – appreciate it may all look
different next week.
This market is like a little kid, so passionate about life so that he cannot get asleep. Wants to, because sooner it goes to sleep, sooner he gets up, but cannot stop enjoying living. This market is so passionate about rising that, it doesn’t want to correct, although it has to correct, sooner it corrects, sooner it resumes rising. All wait for the correction to buy shares or close remaining shorts, but nobody wants to sell in order to bring about correction. When the majority expects something, something esle can happen.
USD/JPY started an impulse up which may be the begining of the end to the 6 month correction. China soaring like crazy. Gold has completed an ABC trip to 1300 area, so that we may now push higher. Hope I have three big fishes in my nets.
The U.S. elites have been challenged in the past by only one major force : U.S. citizens, who usually don’t want the U.S to be engaged in another war. So, the citizens need to be convinced. As the propaganda work to some extent only, the elites need more. A stupid move by their opponent, so that it makes the citizens want to go to war. Instantly some evidence emerges, like WMD possession. The pattern is as follows : Lusitania, Pearl Harbour, Tonkin, WTC, Boeing777.
Russian military press conference and a misterious SU25 (another magic 7)
Fool me once…
Another interesting thing occurring that is both as sudden as it is utterly unexplained, is the sudden ending after 50 years of the “war on drugs”. The Daily Bell has a few interesting ideas on the subject:
http://www.thedailybell.com/news-analysis/35331/First-Pot-Now-Hemp-Directed-History-of-Cannabis-Legalization-Evolves/
And … http://www.thedailybell.com/news-analysis/35495/Drug-Decriminalization-Lesson-Learned/
Regardless of who is eventually proven to have brought down this aircraft, I was shocked to see that this Russian evidence was not even mentioned once by major UK media like the BBC, Telegraph and Guardian. I’m hopefull though, that ordinary westerners will not be duped again by the relentless onslaught of US and UK agitated war propaganda.
At least some prominent and patriotic US personalities are able to see through it: http://www.paulcraigroberts.org/2014/07/24/washington-escalating-orchestrated-ukrainian-crisis-war-paul-craig-roberts/
And what about this bizarre and confused statement by David Cameron: “…this is a direct result of Russia destabilizing a sovereign state, violating its territorial integrity, backing thuggish militias and training and arming them…” He mentions Russia, but actually describes his own and US foreign policy exactly.
The war cycles are ramping up for at least the next four years. The more that sensible people resist, the lounder they will become…
David Cameron is part of the U.S. – Israel Globalist Axis of Evil. War cycles according to Joel Skousen who does excellent analysis on this will be ramping up for the next 10 – 20 years.
The goal of the Globalists will be to incite Russia and China to attack the U.S. (great way to wipe out the impossible debt). But the Globalists still plan to win in the end because they have the higher technology to win WWWIII, bringing in their desired NWO. Hopefully, their evil plans won’t play out as they have planned for decades.
The only thing now i’m concern is that’s i’m seeing conflicting info
Yen goes weaker this week – imply market goes stronger
China up crazy this week
However, if DAX and Russell is leading then a deeper correction is imminent
Bull markets don’t end with 6 month winning streaks. However, that does not mean we aren’t due a correction
http://fat-pitch.blogspot.co.uk/2014/07/weekly-market-summary_25.html?spref=tw&m=1
Dow monthly – out of headroom: http://screencast.com/t/XcFbwrrKFkv
But even if the volume trend is clearly negative, the Dow weekly waveform looks incomplete – a 1-2-3/a-b-c- off the February low: http://screencast.com/t/yaAfslWDjMUE
Just for balance i would recommend reading Ryan’s articles. They support a bullish outlook for equities till the end of the year. Here is an article on the recent extream sentiment:
Sell zone approaching:
Goldman Sachs’ point of view on the U.S stock market has a good chance to be right: the market would be declining in the third quarter as treasury yields rising. AS long as long-term interest rates stay very depressed, I see no reason why long term investors should underweight stocks.
Don’t be fooled by the deflation threats. They are nothing but central bankers’ trick to justify their bold actions. Suppose global inflation rose sharply in the future, central bankers could declare proudly that deflation had been defeated by brave, wise and fast-acting people!
Forex Kong has very similar analysis as seen via currency markets, and has also been expecting the turn lower in risk.
It will be interesting to see / correlate how views expressed here overlap.
http://forexkong.com/2014/07/25/equities-exhausted-usd-double-top/
Sunday; a great day for a confession. I was wrong. So maybe I’m human after all.
sob……
The good news : I had my epiphany. Not entirely happy with how things worked out this week the thing has been brewing in my mind. And finally I saw it. So I found a new analysis and it gives me a new insight. This is my final solution, so no more surprises.
This is what I see now and I’ll let you be the judges.
July 3rd was the orthodox top. This coincides with the sun @ Aphelion, but John is the solar expert. July 28 is the moon @ apogee. European markets set a high on july 3rd. but Wallstreet has been in a sideways diagonal (McHugh). And this makes sense; Sun down and moon still up is sideways.
The high on Wednesday wasn’t so bad after all and Thursday/Friday was down.
Next week wil see a low on Wednesday. Thursday/friday will see the last spike up where S&P may hit 2000+, but European markets will set a lower high.
But this week is the final roll over. My new model gives a low on September 14-ish. With mid october a kind of double bottom. Only after mid-October comes a real recovery.
Friday marks the top with an inversion. After that we’ll go down until august 14th. then up till 19th, and down again towards 27th.
To be honest; I have never been more convinced that gravity works. But the key question is how to read gravity from tidal data.
Inversions give short term reversals but can not change the longer term trend. So I am confident about a low mid September and another significant low mid october.
This fits with what McHugh says: one last leg up this week. After that comes D down.
Wednesday FOMC meeting. This – together with the end of month effect – will be an excuse for a last low volume rally.
And friday (non-farm payroll?) will mark the high. After that the bears are in charge big time.
My head is on the block and you are holding the ax. But please wait and see how next week unfolds before you chop off my head……..
Have a nice weekend.
Another good article on possibilities for a correction this year from Chris Puplava. It may not be as much as most people hoped. Between 9-11%. Just keep an open mind that a if a market goes up a lot it does not mean it needs to come down a lot.
http://m.financialsense.com/contributors/chris-puplava/why-good-new-bad-why-should-buckle-up-fall
Thanks for your sharing your thoughts André.
I’m also expecting a low on coming Wed FOMC meeting (which is a Bradley date) and a final top on either Friday or coming Monday.
Can you shed some lights on a longer term thoughts on US equity market & EEM?
PS I saw China up crazy and i’m just thinking should I long EEM, seems a real breakout
I’d be so curious to know / apply your analysis to The Nikkei of Japan in that, the index led markets down in 2007, leading by about 6 months.
Once again Nikkei topped some 6 months ago and now appears to be putting in a lower high? Looking back , could this at all be consistant with your gravitational analysis? Having such a blaring example of the 2008 crash, and putting a finger on it “gravitationally” ?
Very interesting work. Thank you.
There is only one sun, one moon and one earth. So we all – red, yellow, black or white- feel the same and react the same.
But gravity gives only timing and short term direction. Tides are really oscillators as on a longer term galactic dimensions are stable.
So yes; we are putting in a significant high what may be a lower high in the Nikkei. Gravity will pull down all markets. But trends beyond 3 months – like what the s&p will do in 2015 – won’t come from the tides. So is this the big one? I don’t know.
After reading through robert Taylors book he states that the long term peak in tides call the market every time, giving examples from early 1900s.
The book states a high in 2013 then a low in 2014 before a run up to high in 2016. Then a low in 2018… This would go against a crash this year if true… Any thoughts on that Andre?
Craig,
Yes I have. Taylor talks about highs and lows. But he doesn’t give longterm trend. So the high of 2016 could be lower than the high of 2013. Besides, 2013 is not THE high; Wallstreet is giving ATH’s in 2014 So if anything, 2014 could give the high and 2016 the low.
Tides are cycles. Only in an uptrend cycles will give higher highs. In a down trend cycles will give lower highs. So his extremes are ‘local’.
Longterm tidal predictions would mean the moon would be consistently moving closer or farther from earth. That would mean the end of life as we know it within 10 years. And Taylor is an example of a man that has a hammer and thinks that every problem is a nail. I say gravity is one of the forces that are active. So only if you analyze them all, you get something reliable. The sun has an 11 years cycle and it is not gravitational. I think that could maybe give more of a trend than tides.
Hi andre, can you please give me your email id.
mine is atiavinash@gmail.com
rgds,
sunny
André,
This is becoming on odd exercise, don’t you think? In one of your former posts, you say: ‘we can do better’, as to pinpoint dates for future turns. How? Well, with the use of gravity and tides. That is an interesting subject, for sure. Questions about how to use these componenst in a forecast, remain foremost unanswered. Reason: you do not want to disclose them, as you stated. That’s fine.Then is turns out your predictions are wrong. None one blames you, we all get it wrong. And now you claim to know what ‘it’ is. And again making bald predictions.
What ‘it’ is? Nobody knows.
There is another way. Perhaps you are on the right track. A lot of people on this forum are willingly to investigate things byond the obvious technicals, otherwise they would not visit this page. So, why not use this ‘army’ of brains to look at your findings, shed a different light, and use their input to turn this into a valuable tool, instead of doing research on your own and making predictions which can go eigther way?
Peter.
My short term predictions where exact. Please reread former posts to verify. What I have added now is to read gravitational trend.
I have said before that gravity is only one of the forces. So what I would like to ask this army of brains is to develop an integrated approach and a practical way to use this as a trading tool.
I understand you are skeptical. That’s fine. Just wait for this week to unfold, to see my predictions can only go one way.
Cheers,
André
p.s.
There are just a few analysts that I know of that use tidal data to forecast. All of them sell paid subscriptions and won’t reveal how they do it. I am the only one that gives it away for free; only on this site. Now, if my predictions turn out to be right we are in an unique experiment here. I find that very exciting. And I have a mail contact with one of the mentioned analysts and we exchange predictions so I can check how I am doing. And that is looking very promising now. So the reason I won’t reveal my code is that I think that’s not where the problem is. Where we can excel is in finding a combined analysis. What is it that the new moon does? With a new moon the sun and moon both pull from the same side. But the moon could also shield the earth form solar radiation. With a full moon the earth is in between them. So gravity should be less. But the full moon impacts the ionosphere and maybe even the Schumann resonance. And how does the gravitational field of Mercury impact the sun? So many things we yet have to understand. That’s where I appreciate help from anyone; that’s where the real challenge is. That’s what can make us unique. That’s why I am doing this.
hi Andre,
kindly give me ur email or send a test msg on mine please.
atiavinash@gmail.com
INDU…an alternative medianline view shown previously
http://stockcharts.com/h-sc/ui?s=$INDU&p=M&st=1982-01-01&en=(today)&id=p17798172470&a=325848835&r=1406463775355&cmd=print
RUT…. meanwhile this index continues to find resistance at the upper target line
http://stockcharts.com/h-sc/ui?s=$RUT&p=M&st=2002-1-1&en=(today)&id=p40012891676&a=224691875&r=1406463956128&cmd=print
SPX…so close… it used to be a common heads up decades ago” Beware when the Dow walks alone” My work holds out the possibility of a slightly higher high here then a selloff then another new high where the RUT and SPX return to their upward sloping resistance lines while DOW ”walks alone” to the upper line.
http://stockcharts.com/h-sc/ui?s=$SPX&p=M&st=1987-01-01&en=today&id=p66760428759&a=155290822&r=1406464230239&cmd=print
Fantastic.
Thanks again for the interesting view on markets.
Any thoughts or comments on the use of the following information? Thank you for any replies. Cheers.
Click to access 2013_Almanac.pdf
Just another way of expressing angular momentum…
Fantastic discussion… I too have been following cycles for the past decade or so.
John, everyone… doers anyone have any suggestions on how to and/or which sectors to short? TIA
I trade the indices, no single stocks or sectors
“It is to be regretted that the rich and powerful too often bend the acts of government to their own selfish purposes. Mischief springs from the power which the moneyed interest derives from a paper currency which they are able to control, from the multitude of corporations with exclusive privileges… which are employed altogether for their [mutual] benefit…. No American should have to live under the oppression of a sprawling oversized central government; or suffer the loss of personal autonomy and liberties to perfunctory bureaucrats; or endure the invasion of privacy by officious functionaries; or struggle through a life trying to stay ahead of inflation; or endure the nightmare of over regulation and criminalization; or tolerate mass corruption and fraud by self serving elected officials; or to grind out a living only to be ravaged by labor-wage taxes while Federal Reserve Bankers get rich off baseless currency; or die fighting in some needless war.”
– the words of ex-US President Andrew Jackson, from around 200 years ago.
There are a few more like that here: http://www.cancertutor.com/quotes_presidents/
so the US had a prior Federal Reserve before the current one which began about 100 years ago?
An bullish view of speculative indices IBB and SOCL
http://m1.marketwatch.com/articles/BL-MWTELLB-15248?mobile=y&mobile=y
Mark, those statements are absolutely amazing. It could have been said or printed yesterday!
Yes, I was surprised to see that the money printers and their inflation was forseeable as such a huge problem way back then! But then again, coins were being clipped a couple of thousand years before that.
Lately I’ve seen some claims (purporting to be sophisticated statistical analyses) that the value of the US dollar will reach zero during 2015/6, based on the rate it’s been losing value since the inception of the Fed. But something which loses a proportion of its value (other than 100%) each year can never become worthless – it continuously approaches zero, but can never reach it. In the case of the dollar, this would be manifested in exponentially increasing prices.
So those are the choices. Either the dollar suddenly becomes worthless by being abandoned, or we face some form of hyperinflation – whether it happens over the next 2 years, or 200, is a bigger question.
My whole analysis starts with one key assumption : gravity impacts markets. And I feel the need to explain this.
Seems to me most people like to see them self as a rational being, that makes rational decisions. But this is not true. Brain research has shown that in everyday life 8 out of 10 decisions you make originate from the ‘lizard brain’. And you simply cannot be aware of this. When the lizard brain shoots the message to your neocortex, then you become aware and you think that’s when you made your decision. But it was precooked in the lizard brain.
The lizard brain feels the impact of gravity and deals with it. And you cannot be aware of this; no matter how smart you are.
Specifically in decisions under uncertainty – like investing – the lizard brain is in the lead, whether you like it or not. And in the lizard brain herding is key. That’s why we see so much serial correlation in stockprices.
A lot of people will find this hard to accept. That’s why gravity is disregarded in most of the investment world.
But it explains why gravity will always work, even on the skeptics; there is simply no escaping! That’s why news always follows the market; you have made your decision before you registered the news. And you will never be aware of this. Never. How’s that for a rainy (where I live) monday morning?
Cheers.
André
I suspect you’re right: Gravity does impact markets. The problem lies in the likelihood (to me anyway) that gravity is not the ONLY force that impacts markets. How about electromagnetic? How about weather and climate? How about subtle forces that we’re not even aware of yet?
No follow through selling so far
from Friday.
A nice sell off happening right now as I type, IF the count is right then I can see a clear 5 waves from top of 1991,(SnP500) and I guess the top is IN guys.
HaHaHoHoHeHe…The age of Bears Starts..
The 5 waves could be A down, with now B up and C down on Wednesday. Then Friday the high. So be careful with shorting this market now.
André,
Over here (Holland), rain nor thunder can turn me into a sceptic. The gravity of the moon has influnce on the markets, just like the tides, in 2011 far better to be witnessed than in 2013. And yes, I too think most of our descisions lack a rational base, although later on we make up stories to ‘cover up’ this process. Just like news always follows the cycles, not the other way around.
As for the markets, the difficulty is why for instance in 2011 the same forces that are active now did make a huge difference. Not so in 2013. Puetz (solar eclipses and crashes) neighter was able to fully explain this phenomenon. That’s why he calls them ‘windows’. If a panic takes hold, according to Puetz, the likelyhood it takes place then and then is far greater then when there is not such a window in force. Armstrong states that the basis for a panic on US-soil can come from abroad, because people, invested in the US, are pulling money out of the markets at the same moment. No way this can be predicted.
For that you should have a total global perpective: everything is related. So even when you map all the gravity and tides, there are still black holes. Since december John proves his case with many charts. All the conditions for a top are met, yet the market keeps grinding higher, month after month (in august he will finally be rewarded). So even when you know all the wiggles of the moon and the tides, and the other forces you mention, you increase the odds are in your favour -always a good thing- but it will not be the golden key.
Peter.
Peter,
I have stated several times before that gravity is one of the forces that impact the markets. John looks at solar, magnetic and demographic influences and found (burned by the sun) that timing with these tools isn’t easy. I am very confident that for short term cycles gravity is very reliable. So what I am looking for is an integrated approach, that takes into account as many forces as possible. I am hopeful such an approach is feasible.
So I agree tides are not the golden key. But I do believe it can help in getting a better short term feel for the markets.
And the fact that solar eclipses can’t fully explain everything, doesn’t necessarily mean there isn’t an explanation at all. With just one force – gravity, sun, geomagnetism you will never be able to explain everything. But my instincts tell me that if we all work together and keep looking for the missing pieces, we can come very close to the golden key.
So my tidal analysis is just one part of the puzzle. But I am certain it adds value.
André
More power to you and your research, Andre.
I would like to hear more….. ss999@live.ca
Andre – are you sure that using tidal heights at a specific location (I think you mentioned Sandy Hook?) is suitable for your method?
The gravitational attraction between two masses is proportional to the square of the distance between them, but the earth is relatively very large especially when compared to the distance between it and the moon. So the force of gravity is significantly different on one side of the earth, compared to the other. That difference is what causes the ocean tides, so when there’s a high tide on the part of earth nearest the moon there is also a high tide at the farthest part (with low tide in the middle distance).
Could this be introducing an error intp your analysis?
Mark,
From what I’ve seen my gravitational analysis on Sandy Hook gives very usable insights. Is it 100% exact 100% of the time? No; That’s the holy grail we are looking for.
But I have seen so many instances where the results were stunning that it can’t be coincidence. That’s why combining different timing techniques is the ultimate solution. If we have 2 independent systems that are each right 80% of the time, any confluence would be very strong.
I promised John a graph to show correlation between markets and gravity. I’m working on that and this weekend you can see it.
Yet again SPX bears give up their advantage. Bulls hold onto their gains throughout the day on bullish days and gain control on days that start bearish.
The tide will turn but as long as companies buy their own stock and the fed prints it doesn’t matter how fully invested retail are.
market is not able to make two consecutive down days…it will correct with a sudden and deep crash…and all those stupid fund managers that are all in will cry to have not sell when they could. the problem is when…2000ish and 4000ish levels have been reached… market value / GDP at 125%… the only bullish game is interest rates.
André,
My response was not meant as critisism. Like I said, I really believe moon & tides make a difference, and under the right conditions can affect te markets more than most people imagine. I do hope your efforts will pay off.
Peter.
Bear market within 12 months according to the article below. Importantly, he is looking for lower highs and lower lows. This can be a lengthy process. In the meantime, there is nothing to suggest we have topped yet.
1) We continue to make higher highs and higher lows. AD line has so far confirmed each high.
2) Divergences have burnt through time and time again over the past couple of years.
3) This time it is different. ZIRP and QE persist. Never fight the fed.
http://www.marketwatch.com/story/stock-trader-who-called-three-crashes-sees-20-collapse-2014-07-28?pagenumber=1
André,
I don’t know if this can be of any value for your method, but a quote can’t harm, even when it has to do with astrology. From an article by Carol S. Mull in Traders World (published in 1987/1988)?
“Another valuable tool in short-term market forecasting is to tally all the aspects in the sky on a given day. This method was originated by David Williams, author of Financial Astrology, but I have altered his method somewhat. What I do is list the aspects that are within a degree of orb on a given day over New York City within market hours, plus the more important ones that fall after or before the market is open.
I then assign a numerical value to each aspect: Conjunctions are ten, sextiles are three, trines ten, and oppositions six. In general, conjunctions, sextiles, and trines are positive, while squares and oppositions are negative, but this can be overridden by the nature of the planets involved. Saturn and Mars are always negative; Jupiter, Venus, and the sun are always positive.
When my list is complete I simply add my negative column, and then my positive column. If I have -84 and +15, I defnitely expect a down-day at the market. Plus 64 and minus 16 would indicate a bull market. This method of analysis works because it is an overall indication of how the majority of people will be feeling. If the populace is feeling depressed and fearful (Saturn/Neptune), they are apt to sell their stock. Most Ephemeris’s (catalog-type books listing all the planetary positions at Midnight by noon] at Greenwich, England on a daily basis) have an aspectarian section. This same method of tally aspects can be used on an hourly basis, or even fifteen minutes. ”
Peter.
Peter,
Wouldn’t it be great then if we could both make a forecast and see if we can find confirmation? I am sure all the planets affect the sun and thus impact markets. I know another astro site that gives Monday,Wednesday and Friday as turndays this week.
$ndx is becoming the most ridicoulus market in the world again… (after transportation)
Andre has posted that the low for this week
should be Wednesday, as with any other
system it’s best to judge by results.
NYSE margin debt is up +5.7% June. Crash postponed by another 2-3 months?
I am actually happy to see the NYSE margin debt number. It explains the June-July market advance (as opposed to some new buyer). The eventual crash will be just steeper.
Good point. Perhaps the top is when QE is finally turned off in October. Thats about 3 months away.
André,
I like your proposal, but I have to decline. The markets have proven me me already wrong this year too many times -which in a way is a good thing, cycles had to fail in order to make this coming cycle-cluster-in august work. Sometimes and lately more often than not I regret spending so much time in trying to figure out how and when markets turn.
I am not an astro guy, nor a gravity junk. I like to delve into matter and see if their is anything useful to be found. That’s the reason I think your research into moon & tides – gravity for that matter-is well spent .You already noticed Mercury is often involved, as is the north node of the moon making hard angels/aspects with other planets, I still haven’t fully figured that one out, yet. I use the basics only, you have found ways of refinement that are far beyond my knowledge. I really hope your forecast works out.
August 2014 is tricky. In 2011, august, I had a good sense of what was going to happen. And yet, despite all my research, the last and fastest part of decline, took me off guard, starting when I expected a bottom. In retrospect I understand were I went wrong, but isn’t that always the case?
So here you go. I am not trying to figure out every move of the markets anymore. I don’t think it is impossible, I am just not smart enough.
Peter.
Peter, do you think I had this figured out in a matter of months? No,sir. Years! Inversions are a bitch. And I think they are common in all natural cycles.
And then I think gravity is a relatively simple force to forecast. Electrical cycles (sun, full moon, planets) are much more complicated.
It is scary to put forward your forecast, especially when it is so specific; makes it falsifiable.
But this site feels like a safe environment, with critical but respectful readers.
I really hope my forecast is right and soon enough we’ll know.
I said this week is the critical turn week, before we really start the decline. John says the same in the new blog. If still other techniques can say the same, the clearer the picture gets.
So I really hope you can find inspiration and see if any of your own calculations can confirm what you read here. I think that’s the real advantage here; you’re not the only one, and other forecast can serve as a filter.
But that is entirely up to you to decide.