

An important week this week: more big earnings, first Q2 GDP release, FOMC and the last week of July.
Stock price increases the last 2 years have been 80% multiple expansion, front-running an anticipated return to ‘normal’ GDP growth of around 3% and earnings growth of around 10%, which has yet to occur. Stocks are now at historic overvaluation by any measure apart from forward p/e, which is based on such expectation rather than the reality-to-date. Demographics and debt tell us such normalisation is in fact not going to occur this time, and when stocks have reached these valuation levels historically, they have always tumbled into a bear market.
The earnings growth rate for each quarter of 2014 was initially estimated at 10%. Q1 came in at 2.2%. Q2, so far, has come in at 6.7%. Qs 3&4 are still pitched at 10%, but for Q3 so far, 32 companies have issued negative EPS guidance and 15 positive. The message is expectations for earnings are still exceeding reality. Even though Q2 earnings have so far been better than Q1, they do not meet requirements, and stocks have struggled to advance in July. The implication is Q3 and Q4 would need to deliver serious bumper earnings to sustain the bull market.
The lack of realism extends to the economy. Q1 GDP came in at -3%. That means Qs 2,3&4 need to deliver 5% growth each to hit the 3% averaged annual. Yet data items already released for Q2 have caused analysts to reduce their forecasts for Q2 GDP to 3% average. If that is anywhere near the reality, then as per earnings it implies Q3 and Q4 need to be bumper, to keep EOY on track. Yet as things stand, leading indicators predict growth to peak out in Q3 and economic surprises continue to weigh negative. Jobs are improving but they are a lagging indicator.
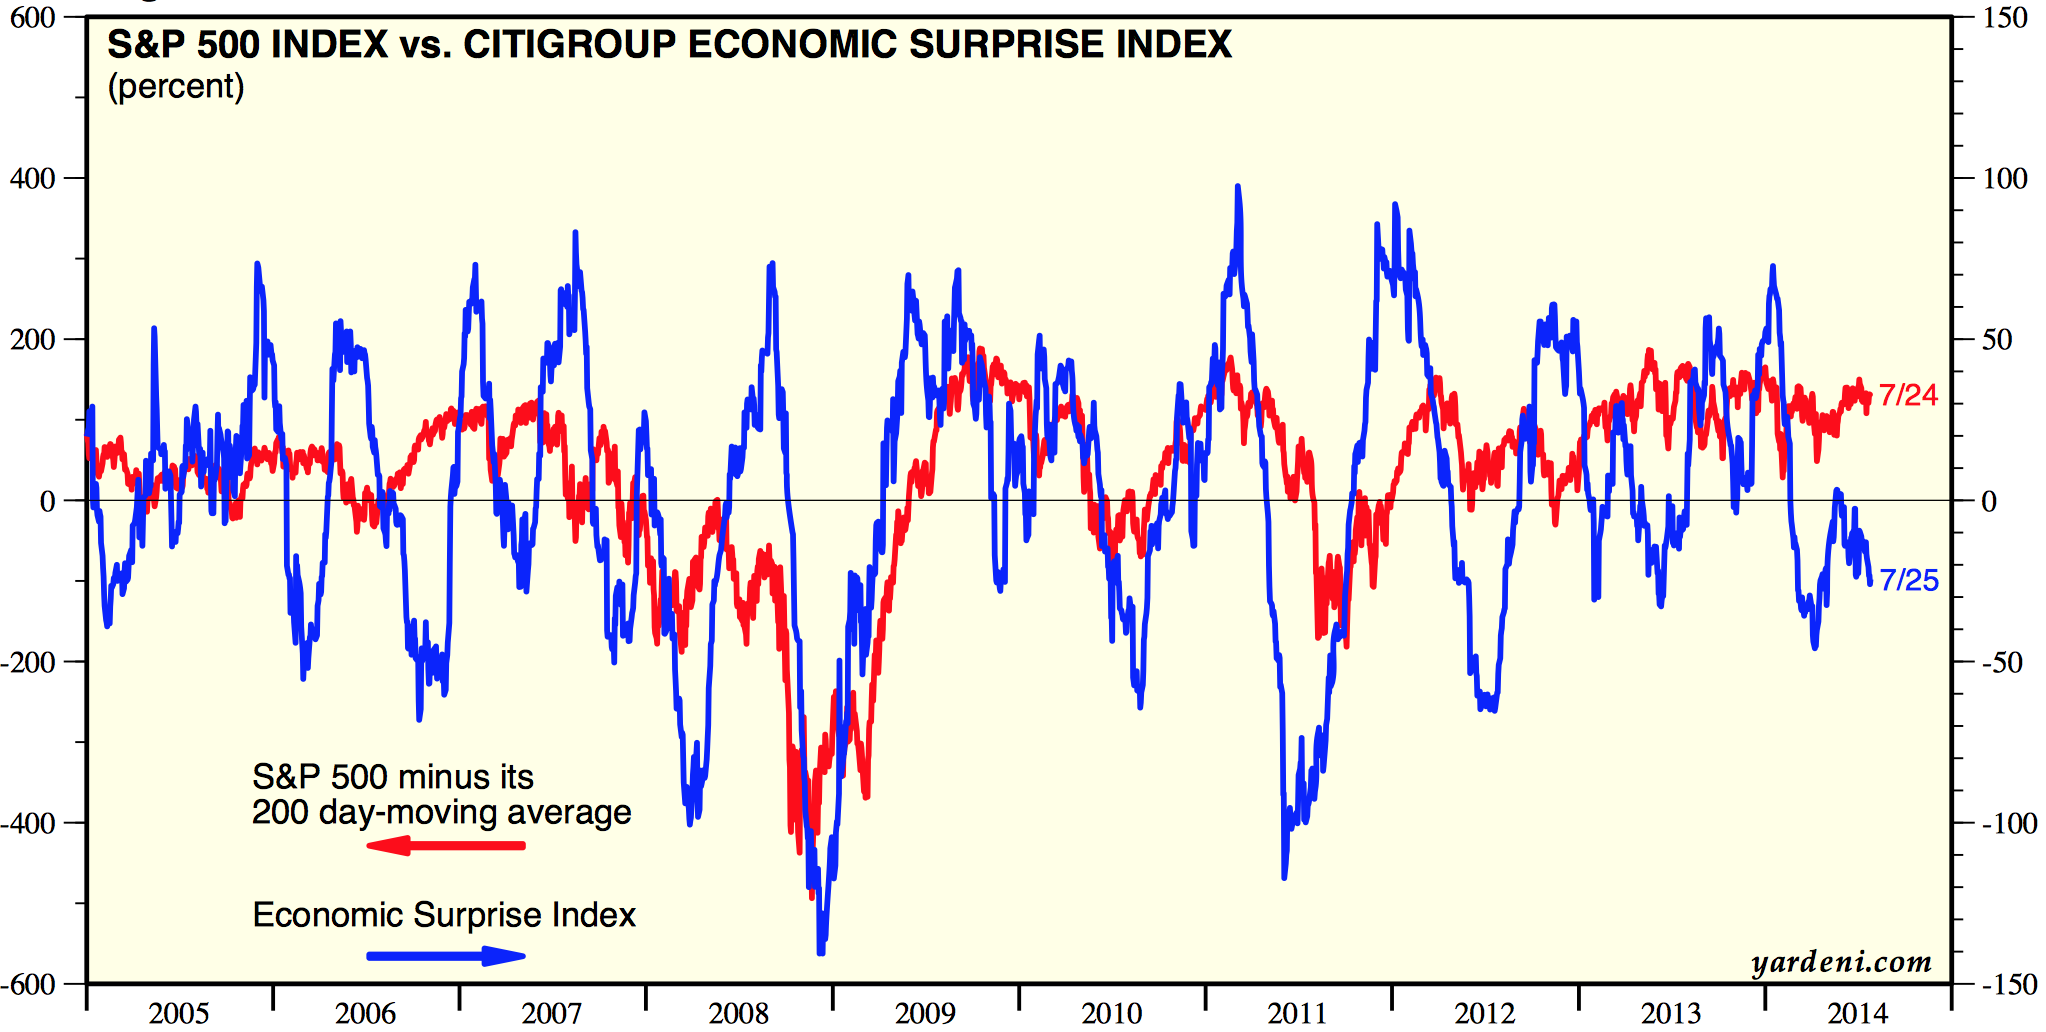
Source: Ed Yardeni
Why are many analysts and economists stubbornly unrealistic about earnings and the economy? I suggest they don’t understand the role of demographics and the unprecedented collective demographics downtrends in the major nations, which are preventing the return to ‘normal’. Historically, we typically saw the economy heat up by this point leading to a rate tightening cycle which played a role in terminating the bull market in equities. Central banks don’t have the luxury this time – no rate rises are possible as the weakness persists. The tightening is in the form of QE tapering, as rates have been made redundant as a tool.
The low rate environment is touted as a positive for equities, that valuations must be considered relative to rates. Yet as Schiller says, low or high rates have not historically affected the predictiveness of CAPE. Similarly, I have pointed out before that in the 80s rates were at historic highs yet investors marched in to equities due to low valuations, and 1937 is a good mirror to now where high valuations and low rates gave way to a bear.
Another misperception is that we in a secular bull market in equities since the SP500 decisively broke above its 2000 and 2007 highs in 2013; that valuations washed out sufficiently in 2009 as a secular low; and that as we have yet to go even begin the series of interest rate rises that will eventually choke off the economy we have fuel to keep rising until 2016 or so.
Firstly, net of inflation the SP500 is still beneath its 2000 peak.
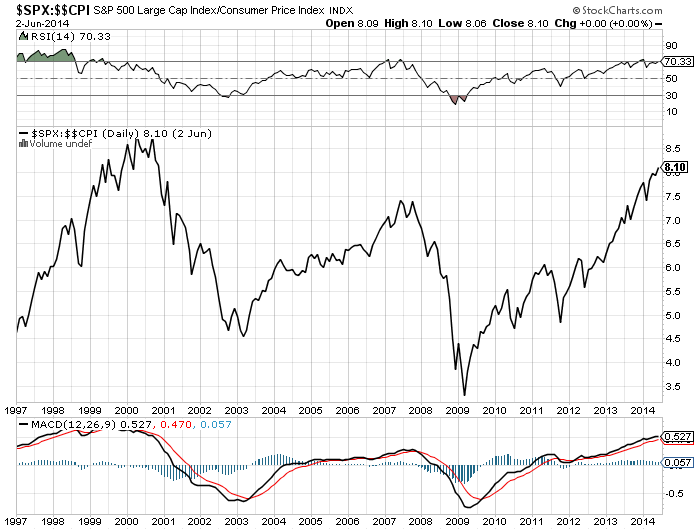
Secondly, secular bulls and bears are always demographic bulls and bears, and the message is that we are still very much in a long term bear that began around 2000:

Thirdly, valuations have a long way down to go before washing out to historic norms:

And, as already covered, central banks do not have the luxury have a series of rate rises.
Margin debt has been released for June, and in keeping with the bullish breakout in equities in that month, it rallied. July so far has been overall flat in the markets, hence an important last few days of the month this week. Barring a significant bullish breakout, I would not expect margin debt to exceed its Feb high in July, which would keep the topping epicentre as Feb/Mar. But the sharp increase in margin debt in June has made that more critical.

Source: DShort / UKarlewitz
I suspect tomorrow’s Q2 GDP print is going to be the key. As things stand (see last 4 posts) the evidence supports a top being in in equities, which implies disappointment in reaction tomorrow and ultimate breakdown in this Dow wedge:
 Two quarters earnings data and two quarters GDP data may provide the tipping point in perspective on equities rather being simply extreme overvalued rather than front-runners of a strong recovery. If equities break down the last few days of July it will make a key difference on many charts.

Interesting as always.
No follow on selling from Monday,
currently markets pushing on higher today.
Thanks Phil
From Friday that should have read.
One thought for you…the use of indexes…
Remember, each index has stocks moving in and out of them…
Case in point, of the S+P 500, back on 1/2/2009…only has 445 of the originals…we lost a lot…go back to 2000 and the number drops to 336…
Point is, to graph a COMPOSITE of these 2000 SURVIVORS of the index gives a much clearer picture…we have a massive MEGAPHONE on the SP survivors…currently around $65
…if I follow the lower trend line down, when the next bottom shows, the SP would be…$11-12…about an 80% haircut…ouch
…but, having cash to buy at that point will be critical…knowing that MONEY MARKET FUNDS are and have been broken (Remember the AMERICAN EXPRESS debacle…we lost the oldest MMkt)…and will need to make certain folks KNOW to check this as well…
If you choose to use this info, please, no references
That is very interesting. How did you come up with that valuation $65? And is $65 the top of that trend line? It could ofcourse folliwng the upper trend line for a while if this market were to keep going.
Thanks as always John.
Interestingly there was no such recovery in the DOW Trannies yesterday finishing near its lows.
http://stockcharts.com/h-sc/ui?s=$TRAN&p=D&b=5&g=0&id=p53733195274
And you think they are not going to pull out ALL stops to defend this line?!!
http://stockcharts.com/h-sc/ui?s=$RUT&p=W&b=5&g=0&id=p05403730470
Thanks John. Great info as usual. The psike in margin debt was a little disappointing. Hopefully this market fall is not delayed now.
Here’s my roadmap and thoughts
With the big giant aibaba having its Ipo in coming September, I don’t think there would be any big crash before that. Meanwhile china (Ftse a50) big up makes me nervous the bear case, seems money rotates to china for awhile.
I would expect a bigger pullback (like mar 2000) first top in Aug (a quick one) and a double top (maybe oct or nov) as sep 2000 is th top, oct 2007, difference was 7 years plus 1 month (85 months or 0.6 Jupiter cycle).
Agree – High profile big ipos usually mark market tops.
Thanks all
thanks for bringing this information to us. Keep up the good work.
Kindest regards.
Appreciated
I think earnings are also key to this.
QE is the elephant in the room,
however at these levels the market need earnings
to develop about as expected –
It’s a point I have made previously.
News this week that profit warnings from
UK listed companies are back to 2011 levels
Multiple UK examples recently of savage de-ratings
where earnings expectations have been scaled back.
Take a look at Kingfisher (KGF) as just one example.
QE and CB’s are incredibly powerful,
however ultimately they cannot abolish the
business cycle, they can however alter it
for a time as we are only too aware.
Well said. QE has overshaddowed everything. World events, earnings, economic health are all ignored in the search of yield. Its a sentiment driven market where each dip becomes more shallow. A self feeding loop where QE is the key.
But the punchbowl is still here. Even tapered its about the same levels as 2010 and 2011. Price is all that pays. Divergences have burnt out, wedges morph into channels, cycles invert, SKEW,
I see the trendline from late 2012 as the life of QE3. As soon as that breaks so does the belief in QE.
Who would bet on a rally if a recession is confirmed tomorrow. Its insane but it may happen. The power of QE has distorted everything else. Keep an open mind.
Hi John, I’m sure you will find this interesting : http://www.marketwatch.com/story/stock-trader-who-called-three-crashes-sees-20-collapse-2014-07-28?pagenumber=1
Thanks
What he basically saying is that this market has become a complete and utter joke and is nothing more than an extension of the Fed………..um that is obvious.
Hang in the John. Of the vocal bears, you are one of the almost extinct. Hugh Henry, Jeremy Grantham and John Hussman have capitulated. The only one else I can think of is Chanos and Mish Shedlock. And yes the link above, but 20% from peak in 1 year is not really being a bear because such a scenario if true will probably mean a good 1-2 year buying opportunity right now even if volatile.
The bear is dead…long live the bear!
Yes Allan is obvious, But this guy is using a proprietary indicator based with tick data, which also confirms John’s scenario.
From a macro perspective, people are buying/holding stocks not because the economy is booming or the earnings are increasing, but because it’s better than buying/holding cash, bonds, real estates or other asset classes. There’s so much money in the world. It has to be used in some way or another. It’s understandable that many many investors feel confused and disagree that long stocks would be a better idea. But it doesn’t matter. The markets are actually voting machines. One dollar, one vote. Not one person, one vote.
How Capitalism Died & Where That Leaves Us (Richard Duncan):
http://vimeo.com/user20236372/review/101487179/54bf993e5d
Great speech. First economist I’ve heard to address the fact that we are wasting money on non-renewable energy infrastructure and resources.
he is a complete tool of the “money monopoly” – he does a very clever bait and switch where after identifying all the reasons debt money systems bust, inserts a globalist deflation meme (sans the slavery! roflmao and crying), and then makes a heroic leap into debt central planning that could only distort or completely destroy what is left of voluntary free association, create more institutional biases and crony largess and bubble sectors of “new tech” that will make this technocracy even more inept at actual clean air, water and real food.
what crap
credit is not wealth yet in his bait and switch at the end he say it is a shame to waste “all this money”! lol
left brains love this stuff.
Good piece by Larry McMillan: http://www.marketwatch.com/story/why-breadth-divergence-is-a-troubling-sign-2014-07-29?link=MW_home_latest_news
André,
With my track-record in 2014 conformation of your dates would not validate anything, believe me. My maps with cycles, I haven’t bothered to look at them for months now. Many dates, many ideas, coupled with a lack of conviction nowadays. They have become superfluous. Yes, I regret spending so much time on figuring out how and when.
I have learnt the hard way not to anticpate movements in the markets until there is conformation. John’s approach (no offense meant, I have been there, many more times than he has) is a perfect example how you can paint yourself into a corner when you think you are on the right side, when all kind of charts illustrate you are on the right side – he adressed many of them, from different perspectives, building a convincing, solid case- and yet the market refuses to go down.
No doubt it has to do with this ‘new’ environment: central banks not only manipulating rates but buying up shares around the globe, anticipating a further debasement of all currencies because the deptproblems our goverments created are byond repair. That’s what we are dealing with.
D. Ferrera, who knows his cycles, wrote in Traders World this year, with 9 of his 16 cycles already in a negative phase, to expect a ‘parabolic bubble culmination’ near march 21, 2014, mainly based on the 7-year cycle, expecting a low in 2016, based upon the 42-year cycle. Did not happen. I prefer an end of this upmove around march or/and the end of july 2015, with some sort of a crisis in between during may, but who am I to pretend to know how the markets move when even a die hard as Ferrera is wrong?
I admire your guts, I do hope it works out the way you think (just as I hope John can get off the hook before this bull runs him over), but I can’t trade expectations in this environment. I have to concentrate on the price-action to eliminate my many mistakes. Expectations only make it harder, in my case.
When it comes to shorting indices, chanche of beging right are at least better in Europe than in the US. The CAC and the DAX already breaking down, making lower lows, although the DAX has a habit of revisiting old highs and stretching the top so distribution can take hold. With zero rates in Europe I am not even sure if that is the case now, or if this is merely a pause in an uptrend.
The only thing I do know is august/september and perhaps december look the most promising months for a sell off, in Europe as well in the US. Although I prefer the first week of august for the first crack, I have to allow august 25-28 for making a top/high, be it a higher high or lower high. But then again, I watch the tape for clues and don’t expect anything.
Peter.
Peter,
I respect that. Just hang on for the ride. Remember I gave a low for Wednesday? Look what Wallstreet did last night. Coincidence? Next forecast is a high on Friday, so I keep my fingers crossed.
But I can tell you this; If the high on Friday gets confirmed my Sunday post should be interesting.
So keep an open mind; You may be in for a surprise.
That’s true, with D Ferrera, famous gann practitioner is also wrong, that’s makes me think if the natural cycle really still here.
Didn’t know Gann used tides. 😉
I don’t mean Gann used tides, what I’m trying to say was if Daniel Ferrera that kind of great Gann practitioner still cannot get the cycle right, I just wonder if the natural cycle still exists.
Peter,
Did you see that? S&P set a weekly low. Seems like something is working 🙂
It’s important not to color everything through one’s own personal prism. When you look at indexes worldwide there are a number that are flat for the year and a few that are even down for the year. So I can understand John’s overarching point that the jury is still out on his 2013 year-end bearish call, much less his being run over. I’m not saying the short S&P 500 hasn’t been a painful trade for those in it, just to point out that other indexes aren’t moving in lockstep.
Talking of price, here’s $RUT weekly – wait for the retrace…
http://scharts.co/1pp8EV3
Pay particular attention to how stocks are reacting to good earnings reports – are they moving higher or stalling and reversing? That will give you a clear clue the tenor of the market has changed and the bear is beginning to growl.
TWTR is up 25%. Just trying to learn…so clearly the “moving higher” clue. What does that mean to you?
My opinion has not changed. We will likely test SPX 2000-2100 and Russell will test its high, just as we made a swing higher in Aug 2000 and Aug 1929. Even 1937 had half of Aug up before reversing.
I do think the bears will win eventually if they hang on.
Agree with this. But perhaps a bit of downside first to shake off some bulls.
Lol, John, I was going to add half-facetiously “except for TWTR”. I read the Twitter action as saying that “animal spirits” are still alive in the market and not to be too aggressive on the short side. Still, I think the maxim I referred to above is more a “weight of the evidence” type of metric, and wouldn’t put too much emphasis on one stock.
Reblogged this on thedarklordblog and commented:
And more bears capitulate…
Time to hold one’s nerve?
It’s a dead cert that they turn it back up here
http://stockcharts.com/h-sc/ui?s=$INDU&p=D&b=5&g=0&id=p94389441565
Great GDp numer. Might fuel a rally this week to new highs. I don’t believe the 3rd and 4th quarter will be this good though. Us bears may need to wait a bit longer unfortunately.
Does anybody believe that number??……..if so I have a bridge to sell to you!
Absolutely laughable.
I hate to say it John but if this breaks the double top 5k is all but a given.
http://stockcharts.com/h-sc/ui?s=$COMPQ&p=D&b=5&g=0&id=p93207253875
Should be revised down.
LOL just too good to be true
And this is a scary chart for us bears. If this potential “cup and handle” comes to fruition it will send biotech soaring.
The fact is that the Fed and for that matter every single one of us, even the bulls, may have grossly underestimated QE.
http://stockcharts.com/h-sc/ui?s=$NBI&p=W&b=5&g=0&id=p67076245436
Perfect example of what I was talking about yesterday: Garmin (GRMN) reported very good earnings, was up 7% pre-market and is now down 5.5%. Bearish behavior…
Agreed but averaging with TWTR, we are still up. That is two data points.
John, surely you understand these are examples of what to look for and no one would use two data points to make a decision whether to invest long or short. It was presented to help you (and others) learn.
Any China and Japan Bull here? I am about to ride this bull.
China is having party till early Oct on the “through train scheme”
Expecting a dip in early or mid Aug (should be a dip to buy and ride it to Oct)
I suppose you are referring to this
http://www.ecns.cn/business/2014/07-29/126663.shtml
yup
Hong Kong & China both are money driven market (especially Hong Kong) you can see both QE2, QE3 & LTRO money give a temporary boost to their equity market, now the theme should be catching up with the low PE + throu train scheme expectation.
Asia as a region is rebounding in the recent weeks. South Korea just had its stimulus program, Japan is about to buy up just about everything in sight comes next september/october. China just trim its banking reserves to free up money for partying.
Bullish indicators is fire up on all cylinder. It’s going to be a blast.
I forgot. India was invited to the party too.
The essence of the early part of a bull market, rising on extremely bad news, ie 2009-10. The essence of the early part of a bear market, going down (profit taking) on very good news, 4 %! This is definitely promising for da bears. The recent weakness in the transport also supports that is a bear ambling over the hill. The transports are frequently a leader.
I consider the breakdown in the junk bond etfs to be the most important action today.
Chart patterns in both JNK and HYG would lead one to expect considerable downside.
4% GDP (LOL) not withstanding
http://stockcharts.com/h-sc/ui?s=HYG:TLT&p=D&yr=7&mn=5&dy=0&id=p29434299984&a=360644868&r=1406746713840&cmd=print
Don’t discount that today was (I think) a monthly distribution day for those ETFs, but agree with your overall point… Junk bonds are weakening, and the stock market shouldn’t be far behind…
It seems the total fraud can continue
taper is now… gdp delusion delayed to q3
Yes!
Now for the tough part: next week.
Do you also follow the AEX, André, or just the US-indices?
With Sandy Hook my main focus is on S&P; European markets usually follow +/- one day. This weekend I’ll give a more detailed forecast of next week. Stay tuned!
Thanks
As of now the good risk / rewards ratio was it test the old high and fail.
Both Bond and yen yesterday (post FOMC) performance both saying we should get a rally
I’m expecting it test the old high in early Aug (Aug 4-8)
Looks like we should be very worried. NASA are. They’re suddenly decided to issue a warning about a solar “superstorm” – only a full two years after it happened. http://science.nasa.gov/science-news/science-at-nasa/2014/23jul_superstorm/
Even a hedge fund is getting in on the act: http://www.businessweek.com/articles/2014-07-29/new-warning-about-mega-solar-storms-this-time-from-hedge-fund
They weren’t too concerned about this CME at the time it happened.
Thanks for your input all
And the clock keeps on ticking…