Fake Out Top

By my work, that completes the cyclical stocks bull market peak.

The solar maximum is looking likely to have run from Dec 2013 through to April 2014 (smoothed peak ~Dec, monthly peak ~February, daily peak ~April). The real inflation-adjusted Dow peak stands at 31 Dec, along with the Nikkei, at the new moon. Various cross-asset measures also inverted at that turn-of-the-year, which has been historically potent, as the inverted geomagnetism peak. The Nasdaq and Russell 2000 peaks were at the turn of Feb-Mar, also at the new moon. The nominal SP500 and Dow peaked-to-date at the full moon of two days ago, making for an inversion.

If the solar maximum, inverted geomagnetism peak, and lunar phase extremeties rule the markets, then all four indices are now likely in bear markets, and whilst we won’t know that for sure for some time, we will know soon enough if those peaks are taken out.

It is the cross-referencing of the timing measures (solar max, geomag, lunar phase, DeMark) with the technical and fundamental indicators (valuations, sentiment, equity allocations, leverage, divergences, cross-asset performance, bull market measures, demographics) that makes this so compelling. The technical/fundamental indicators suggest the top timing should be now (Dec-May), the timing measures in turn suggest the indicators ought to be flashing red in that window, and they are. Indicators on red began to accumulate towards the end of 2013 and the last few recently fell into place: a decline in margin debt, a waning in the monthly sunspot count, a snapping of the parabolics (biotech, internet), DeMark exhaustion.

For these reasons, it is unlikely that the markets can extend longer or higher, and whilst I cannot rule out higher prices, the attempted break-out by the large caps of several days ago was an important test that looks to have failed. I still remain confident that waterfall declines will erupt, as the historic leverage is unwound, but the question is when. I was too early in their prediction as the solar maximum extended beyond solar scientists’ expectations. Assuming the solar cycle continues to wane from here, then I have two possibilities in mind. The one is those sharp falls erupt imminently, once technical price supports are broken. The other is they erupt around Sep/Oct at the inverted geomagnetism seasonal low, which has hosted most of the major historic waterfall declines. I am specifically talking about 3-4 weeks of panic selling, differentiating that from a more measured bear trend.

16m3

16m4

16m1

16m716m8

16m5


Exhaustion Or Breakout

Superficially a bullish breakout, but behind the scenes both the SP500 and Dow met DeMark’s exhaustion topping criteria yesterday.

Supporting that, the breakouts/rallies were on low volume, the put/call ratio for the indices (CPCI) finished at one of its lowest ever readings, and the CPC and VIX also reached contrarian low levels:

13m2Source: Stockcharts

A longer term look at stocks volatility plus treasuries volatility reveals historic compression:

13m3Source: @Not_Jim_Cramer

Sentiment remains elevated, as the March/April falls in the Nasdaq and Russell 2000 made little impact:

13m4Source: Investment U

So, put/call, volatility and sentiment all signal high complacency, whilst the last time we saw such persistent money flow into defensives was 2011:

13m5Source: AfraidToTrade

I’ve added again to the SP500 and Dow short positions. Tomorrow is the full moon, let’s see if we get an inversion and bull trap.

To finish, this is how the Dow peak looked at solar cycle 20 maximum, namely a topping process at a turn-of-year solar top:

13m6

Underlying Source: FiendBear

As things stand, the current solar cycle (24) smoothed peak is likely to have fallen circa Dec 2013, the monthly sunspot spike in Feb 2014, the real Dow peak likely end of Dec 2013 and the secondary high here in May: all very similar to 1968/9.

Window Closing

Some more charts:

1. Financials leading down:

9m9Source: Charlie Bilello

2. Consumer Discretionary leading down:

9m10

Source: Charlie Bilello

3. Defensives outfperform:

9m11


Source: Charlie Bilello

4. Consumer staples performance relative to SP500 echoes previous peaks:9m1

Source: AThrasher

5. Investors Intelligence sentiment leading sharp corrections:

9m2Source: Stocktwits

6. New highs consistent with 2000 peak:

9m6Source: J Lyons

7. Q ratio valuation now exceeds 1907 and 1929 peaks:

9m4Source: DShort

8. Market Cap to GDP valuation also now only superseded by the 2000 mania:

9m5

Source: DShort

9. Evidence for a bubble:

9m3Source: Market Watch

10. Tom DeMark’s indicators predict peaks in the large caps are now at hand. He says the Dow effectively peaked on December 31st and a secondary move up to a level of 16,660 will create a top for the Dow.

At this point, the number of bearish indicators I have amassed is a source of great conviction. It will be a long time before such an opportunity re-appears. Those who suggest that too many bearish indicators is conversely bullish are confusing contrarian investing. Too many bulls, too much euphoria, too much allocation to equities: those are contrarian indicators. They are measures of ‘all-in’ and no-one left to buy.

I have more than 50 bearish indicators, each with a reliable history. Just one on its own should be a reason to be cautious. Many different angles, and together a solid cross-referenced case. To dismiss them all is effectively to argue that this time is different for each indicator, that each one was valid until now but no longer. To proponents of this time it’s different: Fed policy does not trump all, but has been the mantra behind bidding up equities to historic valuations; Low interest rates and low growth reflect recessionary deflationary demographic trends that cannot be stopped; Secular bulls do not erupt from these levels of valuations, leverage and euphoria – in fact, the worst bear markets in history do. Anyone still playing the long side at this point is playing a truly woeful risk-reward set-up.

Don’t trust me, trust the indicators. This is as good as it’s ever going to get for a medium/long term trading set-up. It’s right here, and I’ve done my best to demonstrate what that is so by drawing it all together as objectively as I can. I withhold from putting it more bluntly because I am not an advisory service, so I just share what I am doing, which is deploying my biggest ever trades in shorting the US stock indices (with the biggest in the RUT), trying to negociate a level of exposure which reflects maximum opportunity-taking whilst avoiding risk of wipe-out.

Unprecedented collective demographic downtrends in the major nations suggest this is a short-and-hold opportunity on a par with the Nikkei at the end of 1989, and accordingly I believe it’s RIP Warren Buffet’s buy-and-hold value strategy 1950s-2014, which only works if the long term nominal is up.

9m12

US Stock Indices

I recently gathered 40 indicators showing why the stock market is a major shorting opportunity, and now we have increased evidence as to why the speculation peak may be behind us, with the solar peak likely Dec 2013 – Feb 2014, and margin debt thus far having topped out in February.

7m1

Source: NOAA

The Bitcoin speculative peak was December. The real Dow and real Nikkei peaks were thus far 31 December 2013, joining the club of historic peaks falling at the inverted seasonal geomagnetic peak (second and third charts):

7m3

 Source: Dshort

7m2

7m7

Also, the 31 Dec peak was 1 day from the new moon, which fits the pattern of historic peaks typically occurring at the peak optimism of the new moon. The Russell 2000, Nasdaq and Biotech peaks also look to have fallen at the new moon of March 1st:

5m4

Source: Stockcharts7m6

The SP500 has flat-topped between December and May. Chances are slim that this is consolidation before further upside due to the congregation of indicators at historic extremes and the likely waning from here of the solar maximum. Recall: super peaks need a solar maximum, a leverage peak (same buyers more debt) and a demographic tailwind (new buyers). The latter is absent and the leverage is at all-time extreme already.

The solar maximum generates maximum human excitement, so as well as speculation peaking in the markets, we typically see growthflation in the economy into the solar peak. I therefore expect markets and economy to decline as one from here.

A historic opportunity:

7m87m97m10

Peak Speculation And Russell 2000

Speculation typically peaks out at solar cycle peaks. In 1989, the Nikkei was the speculative target reaching p/e>80 as it topped out at the solar cycle 22 peak. In 2000, the Nasdaq soared to p/e>80 as it topped out at the solar cycle 23 maximum. Now, at the current solar cycle 24 peak we see a broad range of historic topping valuations in equities but it is particularly the small caps that have been subjected and bid up to the extreme, as the trailing p/e for the Russell 2000 currently stands at >100.

Remove the companies with negative earnings, which is about 20% of them, and it would be 23, which is at the top of its historical pricing:

1ma7

 Source: Andrewunknown

Valuing by EBITDA, the R2K reached 10.8 in March, the highest since 1995.

Small caps are also at the top of their historical pricing relative to large caps:

1ma8

Source: Alhambra

Similar historical rallies to 2013 in the R2k have been reversed in full the following year:

1ma10

 Source: Fat-Pitch

R2K current historic levitation is demonstrated here:

Screen Shot 2014-05-01 at 10.40.50

 Source: Gordon T Long

Biotechs have been a key driver of the R2K outperformance, but their parabolic bubble looks to have popped:

1ma11

 Source: Alhambra

Along with Biotech, the Russell 2000 potentially topped at the turn of February into March:

Screen Shot 2014-05-01 at 10.19.08Lerverage also looks to have peaked out in February:

1ma1

Source: DShort

Over the last 5 months, the collective performance of the four major US stock indices switched from uptrend to range:

1ma5

Source: Stockcharts

I believe this is a topping process aligned with the solar cycle topping, so let’s look at the updated solar charts.

My daily sunspots chart shows a higher high but a lower low in April:

1ma2

The pole-switch progress has been oscillating around a trend that is now set to complete:

1ma3Source: Leif Svalgaard

Nasa and Noaa models suggest the smoothed solar peak is behind us. Solen agree, suggesting a smoothed peak around December 2013. The below forecast aligns with that, whilst allowing for an April peak:

Screen Shot 2014-05-01 at 10.49.49

Source: Sunspotwatch

SIDC are still running with their two alternatives. The SC prediction aligns with that of solar cycle 16 progress, which SC24 has mirrored to date. The CM forecast predicts ongoing but plateauing strength into late 2014.

1ma12

Source: SIDC

Previous speculation peaks occurred close to the smoothed solar maximum and on a spike in monthly sunspots. Aggregating the predictions, the smoothed solar maximum for SC24 is likely to have been at the turn of the year from 2013 into 2014, whilst the monthly sunspot spike so far was February 2014, with both March and April coming in lower.

As things stand, US equities broke out of their uptrend and into a range at the turn of the year and the R2K, Nasdaq, Biotech and momentum stocks all peaked out at the end of February. A February peak in margin debt is also supportive of a potential speculation peak having occurred.

I suggest chances are slim that equities resume an uptrend here following this price ranging, due to the 30 bearish indicators that I recently amassed, some of which are already overdue fulfilment by historic norms. We have a compelling cross-reference of stock market topping indicators (price clues) and solar cycle topping indicators (time clues) in the window of Dec 2013 to April 2014. I believe the Dow’s marginal new high yesterday will be shorted lived: a fake-out.

My biggest short remains the Russell 2000 and I have added to this today. It is the largest trading position I have ever had, so there’s my conviction. NFP Friday a likely market mover, and the start of the lunar negative period this weekend.

SC24 v SC16

Solar cycle 24 is projected to peak with a smoothed sunspot count of under 80 (peak SSN), which makes it the weakest cycle since solar cycle 16:

Screen Shot 2014-04-29 at 15.08.49Source: CBDakota

Solar cycle 24 is also the first since solar cycle 16 to have a higher secondary peaking of activity at the maximum, rather than the higher peaking coming first:

Screen Shot 2014-04-29 at 15.19.55

Source: Livingston & Penn

Solar cycle 16 is also the most similar in shape and progress to solar cycle 24:

29ap2

Source: Solen.info

The solar cycle 16 maximum ended with the 1929 crash and the start of the Great Depression. Demographics forecast a similar such period ahead and current stock market indicators point to both a bull market peak and a the set up for a stock market crash.

The chart of SC16 below shows that the stock market did not collapse until the final and largest monthly sunspot count:29ap3


Source: Solen.info

Have we experienced a similar last burst in solar activity in Q1-Q2 2014?:

29ap5

Source: Solen.info

Or does the top need to extend further yet in time? Either way, the similarities are intriguing.

I maintain the solar cycle is key to the stocks bear. We have 30 bearish indicators, and max leverage in the markets. Now we need to speculation to top out and leverage to unwind, and I believe it will do so when the solar maximum starts to wane. It may have already begun to wane and stocks have already topped out, but the evidence comes in slowly. Patience and money management are the key.

Price Cheerleading

Time to look at what has been invalidated from my Q1 analysis.

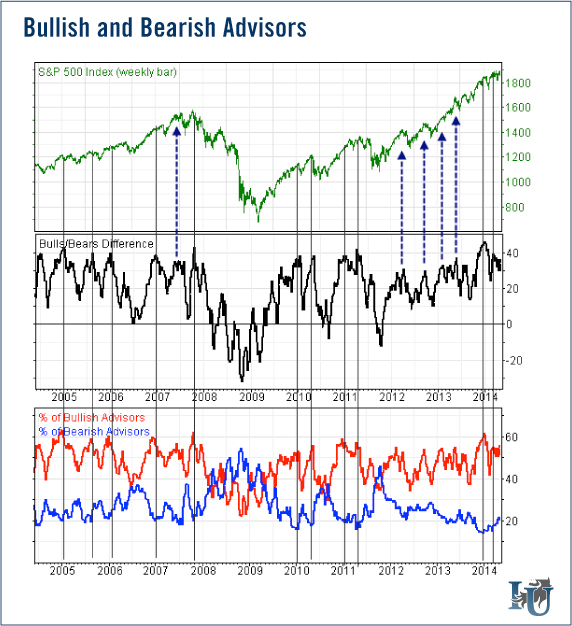
I am no permabear. I played equities long-only from 2009 through to 2013 but by the end of 2013 there was an impressive congregation of topping indicators, which aligned with a predicted peak in the solar cycle. Adding in my demographic research, the case was particularly compelling to short stocks and hunt for a major peak. So I decisively switched teams. That compelling bearish case still stands, as just a couple of weeks ago I produced a list of 30 indicators advocating short. See that list here.

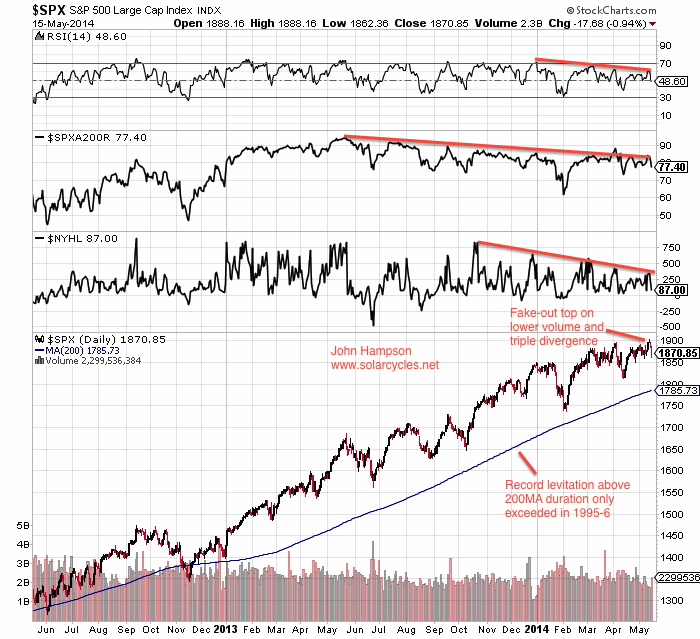
In short, focussing on US stock indices, whether we look at valuations, bull market characteristics, sentiment, euphoria, leverage, IPOs, equity allocations, smart money flows, breadth divergences and other indicators with reliable histories, we have a case for a top in US equities. Add them all together, and it’s just about the timing. Therefore I don’t understand shorters throwing in the towel at this point, and particularly because as things stand, US stock indices have traded sideways in 2014. There is no definitive bull or bear trend, and at the time of writing 3 of the 4 main US indices are below their Dec 31 close, whilst only marginally so. Price has only paid for short term trading over the last 4 months, and the rest of us are patiently – or impatiently – waiting. Pending that resolution, beware the price-cheerleading from both bull and bear camps, thinly disguised as analysis.

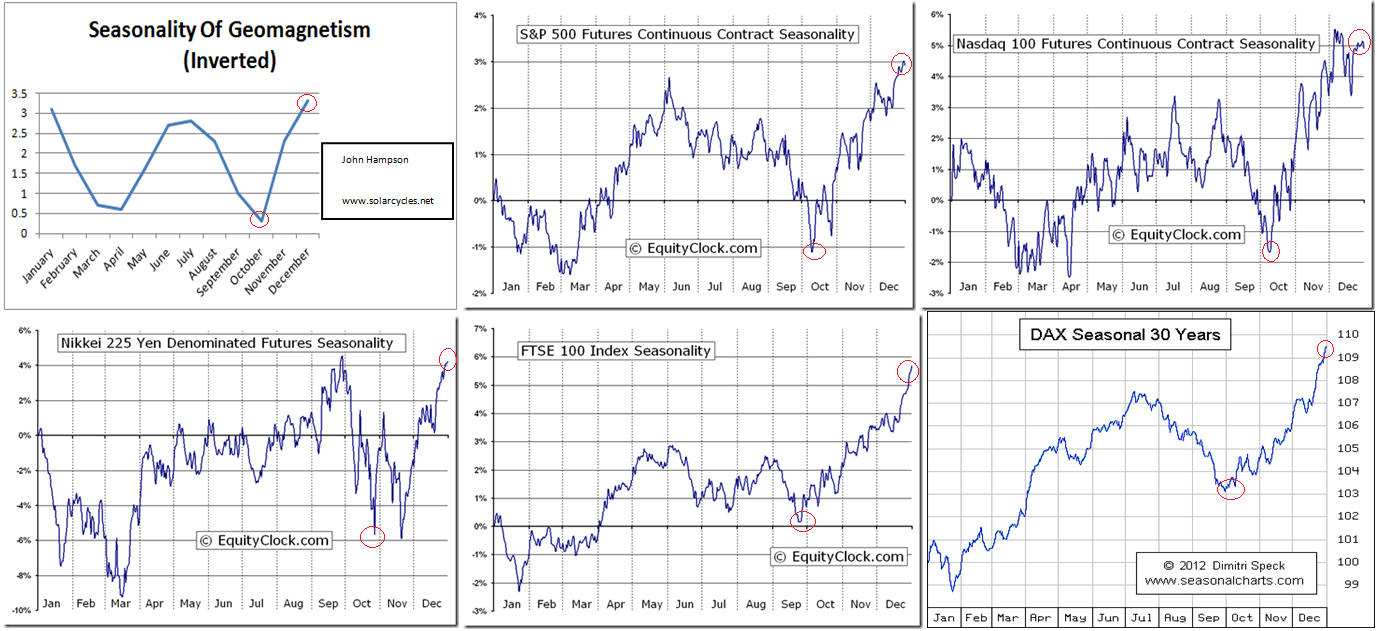
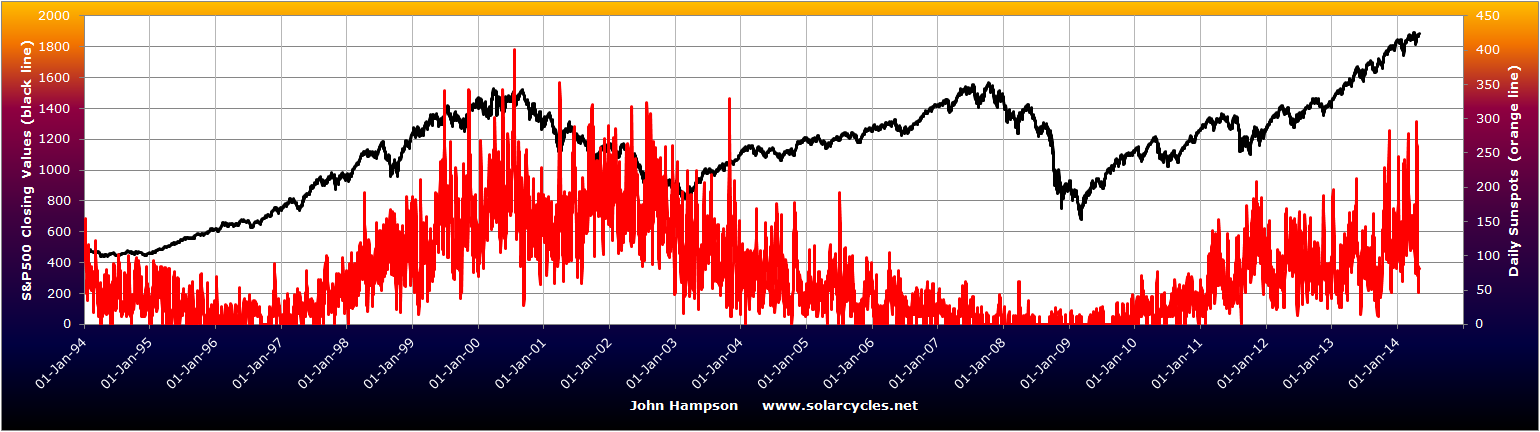
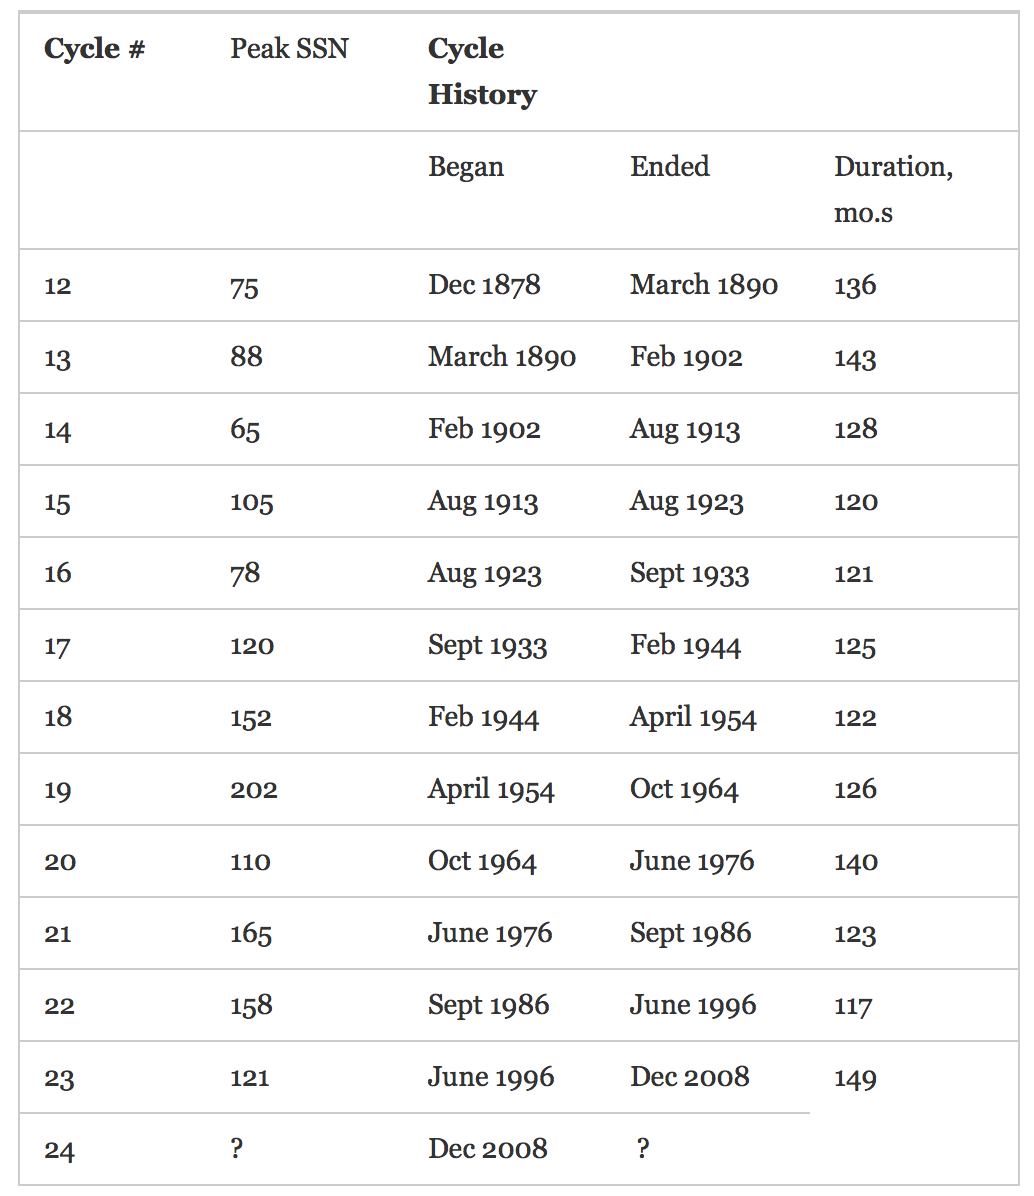
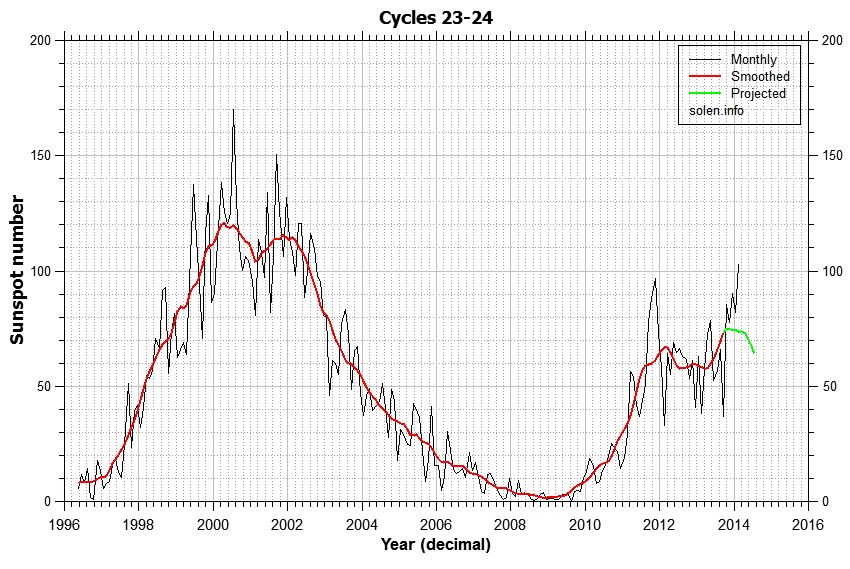
So, with that multi-angled case for a top, why have stocks not fallen decisively yet? I argue that the reason is the solar cycle maximum extending beyond the predictions of the major solar scientists, and its implication on speculation in the markets.

23ap1

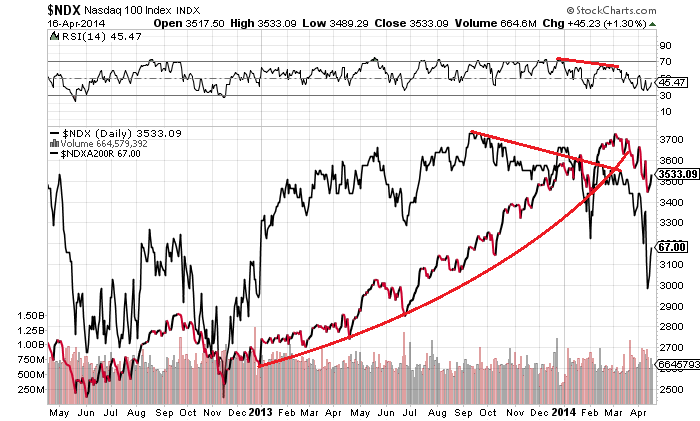
Therefore, my anticipated waterfall declines in March and April and analog aggregation did not happen:

23ap2

However, by indicator extremes and similarities, the set up remains for a crash in the markets and the delivery of those waterfall declines as the peak leverage is unwound. But, for now, the stock indices have morphed into sideways ranges, as the solar maximum has extended. The solar maximum, through human excitement, influences speculation and also economic activity. Once the solar maximum begins to wane I expect both to ebb together, and I therefore consider this one of the most important items to track.

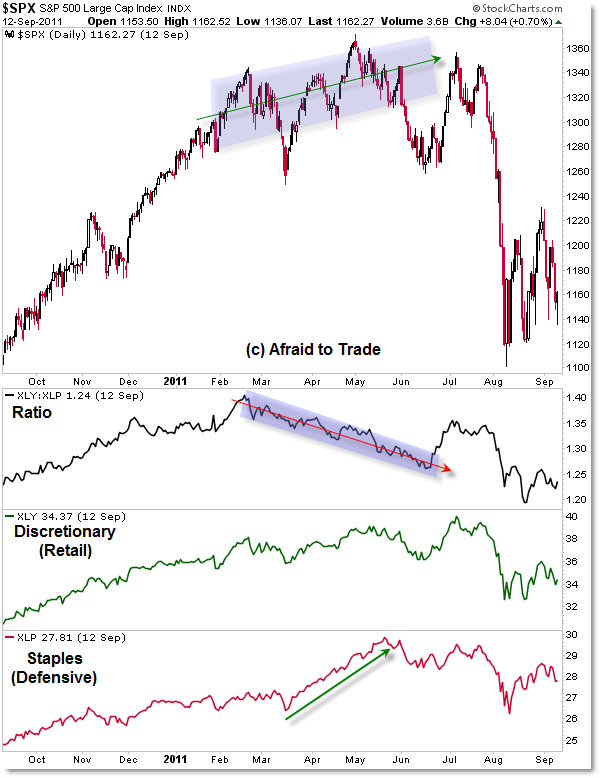
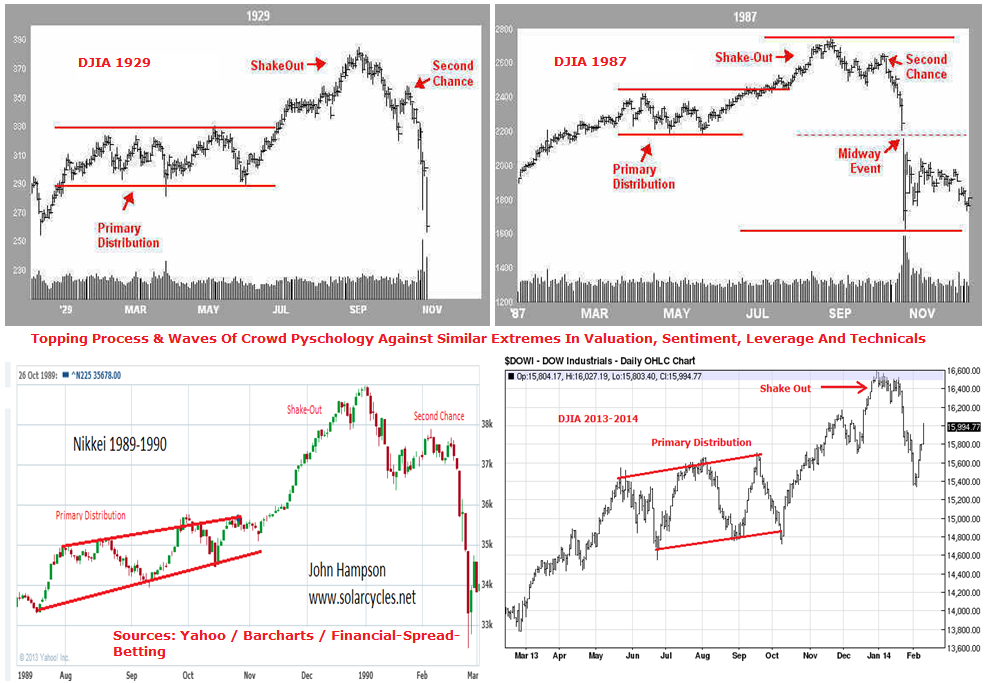
Should the solar maximum not peak out until mid-2014 then I would look to the possible analogs of 2011 and 1987 as price guides. Both these analogs shared similar indicator extreme readings and backdrops, and both saw waterfall declines in the Fall/Autumn. 2011 produced a long sideways range ahead of the falls, whilst 1987 eked out further price gains in the summer, before the falls. My approach is to stay short and attack short until we see the major declines, shearing off profits as I see fit based on the short term action, and should stocks eke out further new highs before the falls, as per 1987, then my current exposure can cope with that.

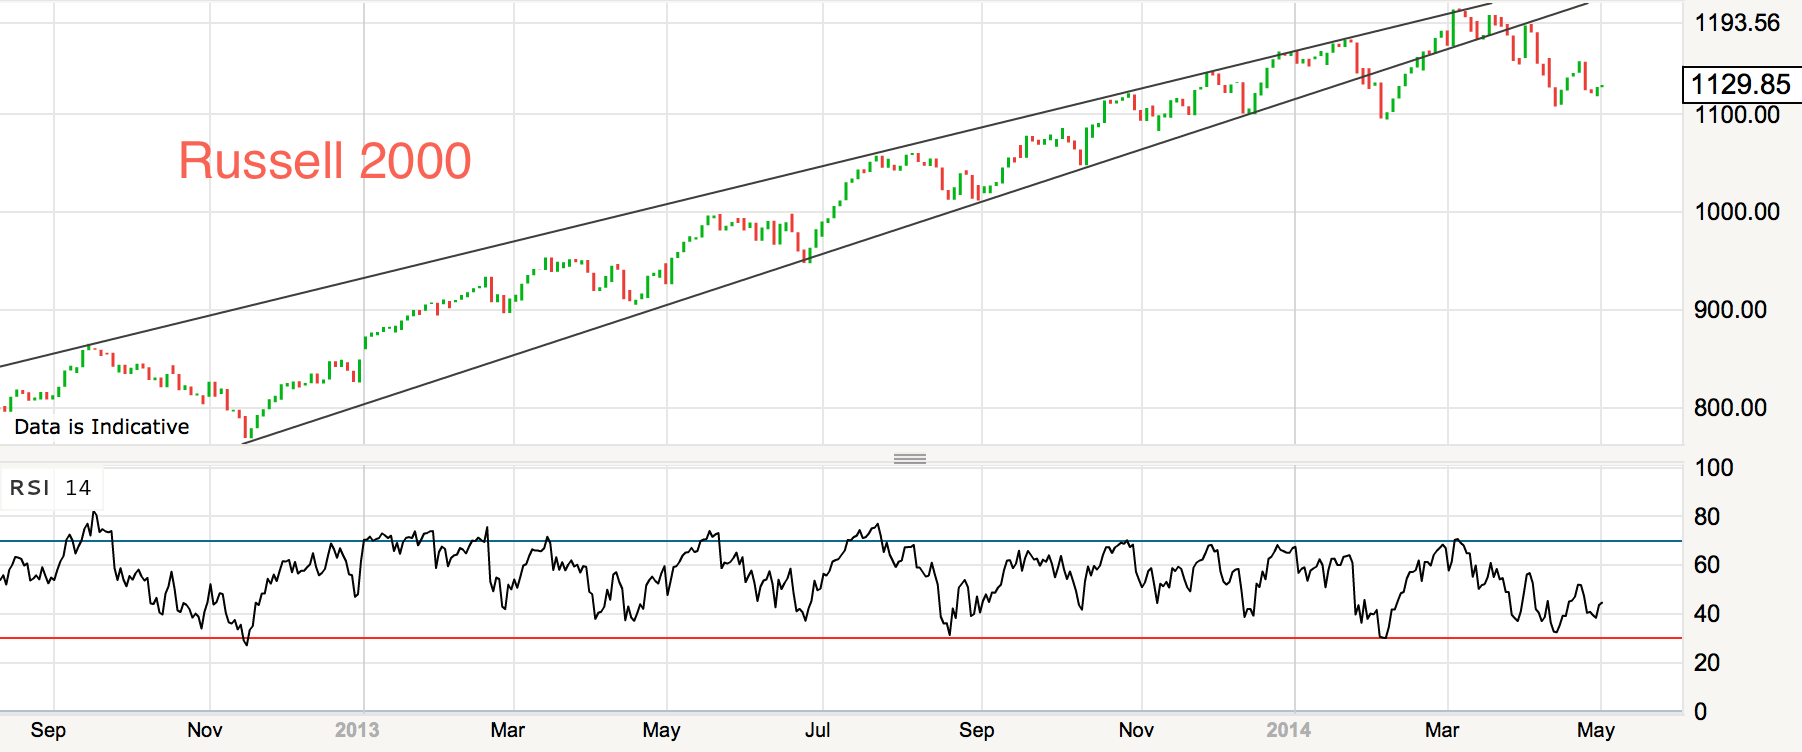
Should the smoothed solar maximum be behind us, and sunspots wane from here, then those Q1 2014 trading ranges in the indices may turn out retrospectively to be the beginning of a new downtrend, made clear by imminent sharp falls (declines from here would fit the Presidential cycle). In support of that possibility, my January call that the Dow and Nikkei peaked 31 Dec still stands at the time of writing, and my March 2 call that the Russell 2000 and Biotech sector peaked out around last day of Feb is so far accurate.

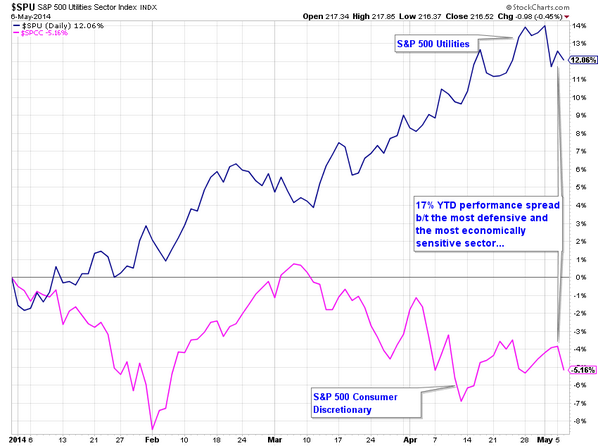
From a bullish perspective, cumulative advance-declines continue to support, and cyclical sectors recovered after their January sell-off. Gold and miners have fallen back since mid-March. Leading indicators suggest a pick up in global industrial production as of mid-May, so that could become a tailwind if stocks do not significantly sell off over the next couple of weeks. Q1 earnings are projected to produce an overall decrease in earnings, for the first quarter in some time, but thus far we do not see overall bearish price reaction to those that have reported. Economically, we do not yet see the tip into outright deflation or negative growth, but I expect that to come hand in hand with the stock market declines post-solar-maximum, i.e. sharp stock market declines will affect the economy and vice versa, all guided by the sun’s influence on people.

My Q1 2014 ‘misses’ in terms of analysis can be summed up as impatience over the sharp falls into a definitive bear trend, but I believe the reason for that is the extension of the solar maximum, which was unknown at the time. The bulk of my analysis still stands, and will continue to do so until that definitive selling erupts.

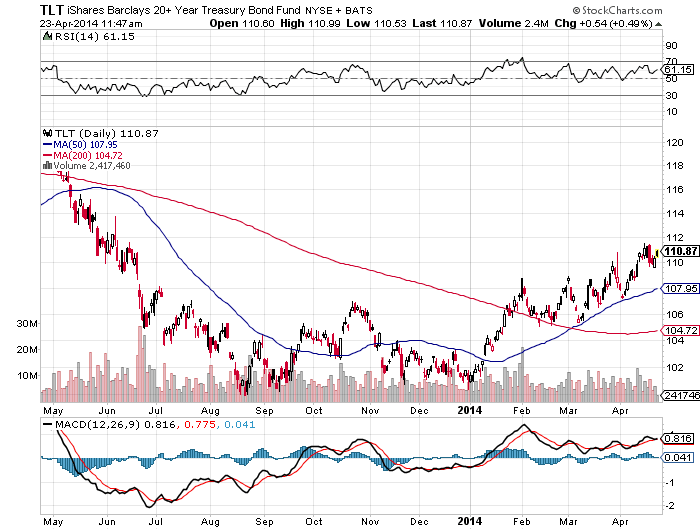
In the near term I am looking at market reaction to earnings, how price behaves into the new moon at the end of April, and the indicator reports at the turn of April-May for sunspots, margin debt, and more. I am adding short into the stock market rallies, such as this 6-day rally into today, looking to short term indicators for overbought/exhaustion. I am also watching commodities to see if they can continue to rally as a late cyclical class (considering gold separate) which typifies a top, but I have been taking profits on commodities positions as I have my doubts about the longevity of their rally due to deflationary/recessionary pressures. Potentially reflecting such pressures, treasuries have continued to perform since their turn-up as of the start of January and are another clue into what lies ahead.

23ap3


Solar Cycle 24

The solar cycle matters for this reason:

20ap1

Peaks in the activity of the sun produce speculative peaks by variation in human excitement, so it is a trading timing tool.

It has been a thrill to watch in real time this solar maximum unfolding and the associated congregation of indicators suggesting a historic top in equities occurring close the solar maximum again. Each of those indicators that I have aggregated has a reliable history on its own, so the question is why the stock market has not tipped over to the downside more decisively by this point. It looks like the answer may be that the sun is still increasing in activity:

20ap3

4 consecutive daily sunspot prints over 240 over Easter weekend keeps the visual in trend in ascendance.

Previous speculative peaks occurred close to the smoothed solar maximum and on a monthly spike in sunspots, so the question is whether this solar strength can be maintained for the rest of April and for the weeks and months ahead to drag the smoothed maximum from end-2013 to mid-2014. Either way, this continued solar strengthening was a bad miss by most solar scientists, with only SIDC in my congregation running such an alternative, and kudos to Mark for suggesting the maximum would extend.

Note also how at this solar maximum we are seeing a higher later peak in a fairly typical double peak, whereas previous cycles tended to produce the higher peak first:

20ap5 20ap4Sources: Solen and SIDC

This adds to the peculiarity of this solar cycle maximum.

The implications for trading depend on how the solar maximum continues to unfold. If the smoothed solar maximum is dragged out to mid-2014 then we may then be looking at the Autumn/Fall for a true stock markets sell-off. If on the other hand sunspots quieten down in the weeks ahead then the smoothed solar max may be retained as ~Dec 2013 and the stock markets may be about to decline in a more major fashion. But either way, the persistent strength in the sun’s activity beyond the end of 2013 through to now has been a key and unexpected factor in maintaining speculation and keeping the markets elevated despite indicators at historic readings.

I now look to the end of April to see how the monthly sunspot count shapes up, to see how solar scientists adjust their forecasts, and to see whether other measures of speculation, such as margin debt, show a peak or continue to rise.


Sell Into Strength

Or buy into weakness, what’s it going to be?

Valuation looks like this:

17ap1And the Russell 2000 trailing p/e is now over 100.

Bull market looks like this:

17ap2

Sentiment looks like this:

17ap3

Leverage looks like this:

17ap4

Solar cycle looks like this:

17ap5


Economic surprises for all the main regions continue to wallow negative, and US earnings season is kicking off with 84% negative guidance.

Biotech, Social Media, the Russell 2000 and the Nasdaq all broke down as of the start of March, fulfilling negative divergences.

17ap6We now await the large caps of the SP500 and the Dow to follow suit.

My calls for the Dow and Nikkei having topped out Dec 31 still stand. The Dow did everything it could to close above the 31 Dec high without actually achieving it this far.

No crash Monday or Tuesday of this week. Instead the market sold off into the full moon and then bounced intraday. So time to get bullish? No way! The waterfall declines are the last piece of the jigsaw. On the back of a 3 day rally we now look to earnings season to support the market, but earnings are projected to disappoint. We need a historic normalisation of earnings at this point to justify the valuations. The market could of course continue to range-trade rather than sell off, and so to the question as to whether it’s appropriate to sell into strength or buy into weakness here. For me it’s clear: the multi-angled case to be short is compelling and a rare opportunity. The rug may be pulled at any point, but will be pulled eventually. I’m short equities and still looking for opportunities to add short on the rips.