

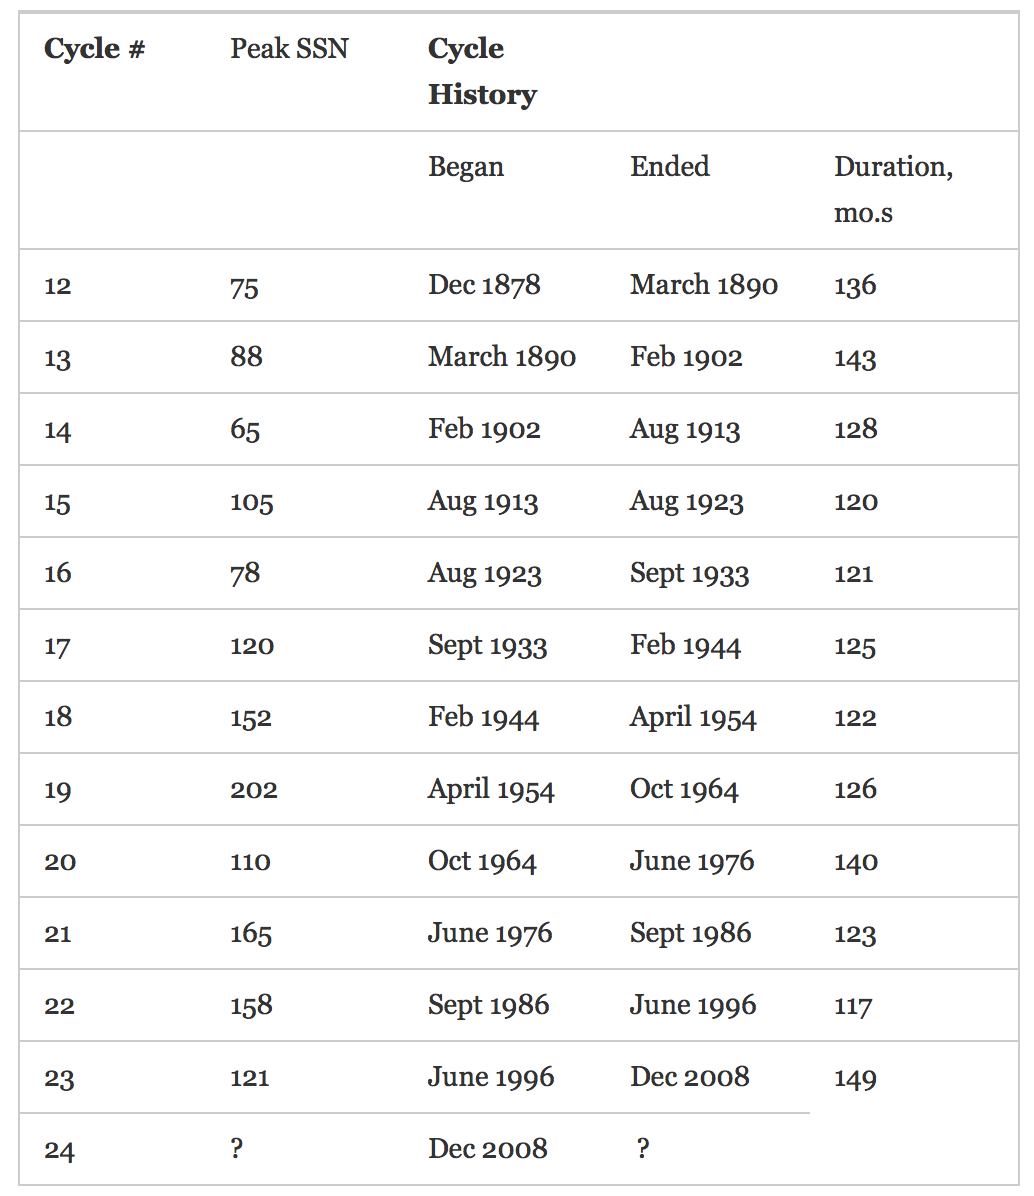
Solar cycle 24 is projected to peak with a smoothed sunspot count of under 80 (peak SSN), which makes it the weakest cycle since solar cycle 16:
 Source: CBDakota
Solar cycle 24 is also the first since solar cycle 16 to have a higher secondary peaking of activity at the maximum, rather than the higher peaking coming first:

Source: Livingston & Penn
Solar cycle 16 is also the most similar in shape and progress to solar cycle 24:

Source: Solen.info
The solar cycle 16 maximum ended with the 1929 crash and the start of the Great Depression. Demographics forecast a similar such period ahead and current stock market indicators point to both a bull market peak and a the set up for a stock market crash.
The chart of SC16 below shows that the stock market did not collapse until the final and largest monthly sunspot count:
Source: Solen.info
Have we experienced a similar last burst in solar activity in Q1-Q2 2014?:

Source: Solen.info
Or does the top need to extend further yet in time? Either way, the similarities are intriguing.
I maintain the solar cycle is key to the stocks bear. We have 30 bearish indicators, and max leverage in the markets. Now we need to speculation to top out and leverage to unwind, and I believe it will do so when the solar maximum starts to wane. It may have already begun to wane and stocks have already topped out, but the evidence comes in slowly. Patience and money management are the key.

We appear to be forming a “diamond top”. Whether it continues to play out remains to be seen.
http://stockcharts.com/h-sc/ui?s=$SPX&p=D&b=5&g=0&id=p77752505451
Longs purchased last Friday and Monday doing great. Tuesday always up as I mentioned. Will sell some at close today.
What euphoria looks like. People sell their homes to speculate. Everybody in the street talks stocks. Everybody’s making money, the stock market is the new economy – it will take off and take the whole world with it. The index goes up every day, sometimes a few % a day. Prices rise vertically. A few months later, those who sold their businesses to get fully invested in stocks, jump out the windows. We’re miles away from that stage.
Stocks are issued to satisfy suckers’ appetite for owning them – J. Livermore, King Speculator
Almost all tops are far less spectacular than that. 1929 and 2000 are the only 2 I can think of. The 2007 top was people selling stocks to buy houses.
Yes, but if we talk about ‘euphoria’ and compare current charts to the parabolic 1929, why not compare differences in sentiment. I am not saying that the Bull must end the same way.
Besides, I was drinking wine while writing that comment. Sometimes I may write something stupid. Maybe I am stupid anyway. I cannot play chess when drunk, but I can trade, sometimes better that when sober:)
Allan talking about corruption, broken market, etc. again. I don’t see the same thing. Markets above trend line support and no reason to be a bear except on very short term time frames. Put $NDX on a weekly chart and connect the lows going back to last Oct. See we bounced right off it yesterday at the lows. Easy long right with a stop close-by. No manipulation at all. Tuesday is almost always up. Why are bears blowing their money trading the easy setups? $RUT nearly double bottomed yesterday, found support and strong buying at 200-day MA. Don’t blame the market as hard when it is not.
Mate you are kidding about no manipulation aren’t you? What is POMO? What is HFT except to give an unfair advantage to a connected few?
I’ve spent years reading the tape. I saw similar action in the late 90’s early 00 as I am seeing recently. Buyers stepping up in big volume at breaking of crucial support levels for no reason and driving markets into end of day. HFT just happens to compound the situation.
IMO a market is broken when it no longer justifies the values placed upon it and the mechanisms that would normally rectify such a situation have been made invalid via external or artificial means.
The bond market no longer functions, rates are artificially held way too low, currency markets are destroying trade amd atop of all that corruption is systemic throughout the financial system.
Yeah things are just dandy!
Things are indeed just dandy. Cummins (CMI) hit 52-week high today on news “Cummins Raises 2014 Outlook As Demand For Truck Engines Improves”. You can continue to believe in the world is ending theme like Peter Schiff or Pretcher, or you can be more open minded and see what good news exist out there that could make your thesis wrong. It is your choice.
That should say Why are bears blowing their money trading the hard setups?
We are bears because the markets are completely disconnected from the real economy and we are also controlled by psychopaths. Hopefully, this insanity will not continue indefinitely and there will be sanity restored.
You need to stop believing the prostitute mainstream media. They were also asking why bears were blowing their money in 2000 and 2007.
John, “intriguing” indeed . . Really love that you have sort of cycled (pardon the pun) back to your roots on this site. I had not noticed the similarity of cycle 16 to cycle 24 and the1929/1933 debacle. Yikes!
I well believe that the recent sunspot spike (14april – 23april) may be the last of the cycle and I have all but cleared out of the positions I do not want to hold through a long deep valley of years. While I still believe the market could hold up into late summer/autumn, I am happy to have exited and will leave it to others braver/more foolish than I.
Hope you are well and so many thanks for your work as always
Thanks
I had just read an article on Seekingalpha, The Roaring Twenties are Back by John Overstreet. He compared the top in commodities from 1918 to 1921 to the recent tops in 2008 to 2001. Did the top in commodities cause an initial boom but then the 1929 crash and the great depression. Capex in the mining industry was $5 billion in 1992. By 2006-8 it had reached almost $150 billion. Think what low prices are doing to those guys. Their cut backs will ripple all the way up the economy. Plus agricultural commodity prices are down also. How are they going to pay for those beautiful $250,000 John Deer GPS air conditioned tractors plus the taxes on higher farmland prices?.
Saw one Chart at stocktwis.net with wave count suggesting S & P 500 could top around 1921-1929 in May 2014 and then fall.
http://charts.stocktwits.net/production/original_22402866.png?1398659143
Someone here cited 52-week high of a traded stock to justify “things are just dandy”, very well.
Even the bulls know that different markets are ‘managed’ to various degrees, what the new comers have not experienced is behind the mask of a raging bull it is in fact a bear, and vice versa. Old timers saw all that towards the end of the millennium IT bubble, and the US housing bubble some years ago, etc.
A hard fact, just look at the personal consumption (retail sales) which consists of 70% US GDP, any person who is “open minded” and has some analytical ability can see how the current US stock market is justified in face of :
Correlates with the death of the middle class. Working consumers are shrinking fast.
I think most would concede that a 10%
plus correction is due this year.
A new bear market looks to delayed until at least next year imv.
Risks are increasing following 5 years of fantastic gains,
attempting to call near exact tops is incredibly difficult
(under any circumstances) –
and if you are using margin, very dangerous.
Alan; please see previous thread for my feedback on your insights about market reality. (:-)
eclectic, thanks for that support.
I more than anyone understands the phrase from Mr K’s:
“The market can stay irrational longer than you or I can stay solvent”
This market is irrational, of that there is no question. One only has to look at a miriad of long term reliable indicators to know that to the case. John has done a superb job in compiling an unasaIlable list recently.
Alex may well be correct, the market may continue to new highs, but histor currently says the opposite and you know what they say about those that ignore history and doom.
Alex missed my point, of which I will get to in a moment.
Firstly however, if it wasn’t for POMO the markets would be nowhere near these levels. Anyone with the slightest modicum of understanding about finance understands that POMO is intervention. I actually prefer to say manipulation, because that is exactly what it is.
Artificially low interest rates have lead to wild speculation throughout the global ecenomy. They have lead to record levels of debt issuance by corporations(junk bonds), resulting in extreme levels of debt. At the same time corporations are using this newly raised cash to buy back shares at a record rate thus distorting the whole picture. Corporate debt to cash ratios are at historically high extremes.
This has created the appearance that things are much rosier than they actually are. The real story is that global GDP has NOT recovered from the GFC. The US nearly 2 years ago re-jigged the way GDP was calculated to make it look better and even that has failed. For every one bright spot Alex wishes to put up there I can show 10 negative and that’s without even searching far.
US unemployed figures are complete joke, US inflation stats are a complete farce and thus artificially low interest rates are destroying investment and stifling real growth, whilst at the same time fostering lax business practices and management.
Gone are the days where only the fit survived, nowadays any idiot could run a multi-national corporation and acheive a glowing bottom line, however those days are numbered.
The point I was making originally was that I made to conscious decision last week to remove all but a small percentage of my funds from this market. The MF Global
collapse should be viewed as a warning to all. There will be no winners. All market inverse ETF’s and long VIX ETF instruments will be suspended. Futures contracts will be voided. I say again nobody will collect. The banks will be protected 100%.
These markets are rigged.
John, what is the best way to trade your call? Would you buy puts or short S&P futures?
I use spread betting and the short ETFs
My broker has been pushing for me to buy one put and sell two OTM puts. But give your waterfall scenario, isn’t a naked put better?
I see a bubble in the energy/water sector. There is a ridiculous amount of money in a very antiquated system that is at the end of its sustainable life, and huge external costs are beginning to be realized. We are literally still lighting things on fire for heat and energy, building golf courses in deserts, and accepting this as normal. I see rough times for everyone as we make the expensive but inevitably necessary transition to renewable energy sources. In terms of demographics, the b.boomer age group in power over-utilized resources at the expense of future generations. Now that they are reaching their expiration date, it can be somewhat undone, but it will be messy and affect global economies.
Thanks all
Allan, you didn’t mind corruption, genocide by US army all over the globe, buying and selling companies which had made money dealing with nazi Germany, didn’t mind the biggest fraud of all which is the sole existence of the FED, while you were ‘making money’. Now the market is bad, because it doesn’t do what you want it to do; it’s called hypocrisy. You want to feel inadequate those who happen to make money and warn them of a total collapse, which you pray for; it’s called emotional sabotage. I recommend you a webinar by Simon Townshend:
“Evolve or Die”.
ps. You were ‘making money’ without cashing in/withdrawing profits? Wow…
despe, mate I don’t think you understand what occured with the MF Global collapse. Firstly it was a trading account and I had open contracts requiring margin.
Secondly my account was frozen overnight. I was given no option to withdraw, no option to close positions on either side.
My winning positons were never honored, not so the other way.
How would you feel if you left money in a susposedly secure segregated acc only to have it fraudulently misappropriated and the man responsible walked scot free because the authority responsible refused to enforce the law?
I stand by what I said and it s the last I will on the matter. The US is no longer the country it was. As all empires go, greed and corruption eventually destroy. Its days are numbered.
The US peaked 100 years ago, now it’s a downhill. I know what happened with MF Global, my point is that after winning some money investors/traders should take the money and put somewhere else, under the mattress for example. I use more than one broker and even if they collapse simultaneously, I am still safe, I risk in the market only some of money.
Bears kept saying market is only this high because of POMO, yet corporate profits have never been higher and the current PE ratio of 18.75 is not at all a bubble as this level has been seen many times going back to 1880. See this chart of PE ratio over time.
http://www.multpl.com/
I went long on Friday and bought more on Monday when $NDX hit long term weekly support (draw a trend line connecting the lows starting last Oct) and $RUT made a double bottom with strong bounce at 200-day MA. Tuesday is always up as I said. S&P500 hit 1880 and Dow is within 0.25% of all time highs. I sold some at Tuesday’s close as that is prudent and we may still be in a trading range. Rinse and repeat.
Most reliable sources I have read say that earnings are more made up than ever.
Your PE chart shows that prices were never allowed to correct to lows of ~5x during financial crisis, delaying the correction. Because the 2k bubble was so extreme, it should probably have gone done even further than that. I don’t see the chart as good support for value in the stock market.
Ref Astrology. Over the years many Grand Trines and Squares, oppositions have come up. They do not seem to have worked very well. I remember a book called the Jupiter Effect that said due to all the planets lining up on the same side of the sun, very bad things would happen. The line up was in 1982, so what happened, one of the greatest bull markets in history started. So it was presented as a top instead of the bottom it was. Mark and others, it reminds me of overbought and oversold, positive and negative sentiment. Over bought is presented as bad but it is frequently just a confirmation of a bull market until the final one at the top. Same for sentiment. So, is astrology somewhat misinterpreted like many technicals. IE by the time the Grand Trine happens most of the good things have already happened with a momentum overthrow and the same for negative configurations. So is the movement into a configuration possibly what counts, not when it makes the configuration on a static basis.
Hi Kent – I think you are fundamentally correct in that anticipation of an event (whether astrological configurations or market news releases etc) is more important than the event itself. That’s why markets typically react in the opposite way to what is expected – “buy the rumour, sell the fact”.
A market is where players come to take money from each other by anticipating each others’ moves and reactions. Anyone who’s had a period of success has been taking money from other players – and they don’t like that! So they change their system, or move their stoploss distance, or stop trading altogether, and your period of success comes to an end. For this reason, every successfull system must, by definition, fail; and to add insult to injury it must fail just at the time we become convinced that we have mastered the market, because everyone’s instinctive level of patience is similar.
I know from your previous comments that you’ve often had the opposite view to most others – and that you’ve mostly been proven correct!
A lot of emotional posts which is a poor mindset for trading,
if you don’t like the game then get out –
less of the lecturing of others who may share a
different viewpoint.
We are all responsible for our own financial decisions
and no one else is to blame for outcomes that may not
develop as anticipated.
This is will eventually as all market bull cycles do in a new
bear market, we all know this – the timing, duration and
depth of a new bear phase remains to be seen.
Alex, record dividend payouts as well,
very rarely gets a mention.
Do you guys who are bears even look at charts? $RUT tested 200-day MA again, triple bottom. Did you see if prices did not break it? And strong buying again came in right at that level? That was easy long trade right? Or are you so bearish that you won’t even try a long even though the risk is very low? Do markets EVER crash before Fed decision!?!
That was a good day trade, sold it already. Whether you are bull or bear, you should have a strategy “If market does this, then I will do that.” Also if day trading have separate strategy for hitting singles or doubles rather than look for home run. See how SPY tested yesterday’s low? No follow through right?. Remember Market always stays range bound into Fed. So easy for day trades as you can look for a range.
A lot of bears point to $RUT and say clearly we have entered bear market and SP500 and Dow will crash but $RUT very oversold already, a lot of momo names are pretty cheap. Finally since I don’t trade on my “feelings” or “thoughts”, CapitalObserver on twitter notes that $SPX/$RUT ratio near 1.75 is close to a bottom. Imagine what happens if people start buying the cheap $RUT and $NDX stocks now how high the market can go.
See here:
Folks; any system works until it doesn’t. Now, I know that’s not very helpful or useful or practical; when it comes to method application.
Everyone who cares to do so may repeat after me:
“I am a paper and contract loving stock market trader obsessed with short term movements; and I trust the system.”
But, this post is probably beyond the scope of interest for most on this site; so I’ll repeat my question.
Anyone experienced with these two astro software programs: timing solutions or Sirius?
Margin Debt — beta-levered/momo rout drives -3.3% drop in outstanding credit in March: back to levels last seen in January 2014.
What a lousy non-event FOMC Wednesday event. Maybe around 20.00 hours (UK time) there will be some move. I thought it would be either a down day or non event day.
One year ago, 1st of May 2013, there was also a non event FOMC Wednesday, with downward bias (bank holiday in Europe). After that a month long leg up started. History cannot that boringly repeat itself:)
Dow is going to make a new all time high at the close today (new closing high). I will sell more longs today at close as we may still be in a trading range which will free up cash to buy again.
Alex all your posts are extremely bullish. Is your view short term or are you a permanent bull? Stocks will crash heavily at some point so just wondering what your views are on that.
Russell 2K refused to go below its 200 day MA in 4 occasions in the past 2 weeks and it successfully defended the lower keltner Channel (so far). I can’t help but think that it is short term bullish even though its PE is 100X. …but the almost no growth GDP of 0.1 is no match to the 10 year treasury rate of 2.648% …so I am long term bearish…either PE ratio contracts or interest rate must come down.
It’s gone at last.
Krish, we are all aware that a new bear market eventually happens.
Bulls can switch to the bearish side, stay flexible.
There is no technical analysis that says we are not in a bull market. I pointed out 200-day MA support on $RUT, put $NDX on weekly chart and see that nice uptrend support line. For what it is worth, I sold my longs today. Not a permanent bull at all but NOTHING LOOKS BEARISH ON THE CHARTS.
Strong close so probably gap up tomorrow. Why do people talk bearish !?!?!
I sold all longs at the close at the highs too. As I said, I trade on charts. Why go to cash? Well, We have POTENTIAL triple top in Dow. But since I believe we are in bull market, no shorts for me. Just wait in cash now and see what Dow does next few days. Could breakout and leave without me, oh well, made good money this week. If short, you better use tight stop.
Dow could alternatively be in ascending triangle pattern. That is a continuation pattern and very bullish.
http://stockcharts.com/school/doku.php?id=chart_school:chart_analysis:chart_patterns:ascending_triangle_c
That is why no shorts for me. May go back long if break out, we’ll see. But if you are a bear before we even got to this level, why? What bearish pattern did you see that justified a bearish point of view? I really want to know.
Alex I was short from 16250 down to 16050 and was playing the trend but it turned round so quickly I got caught out. I should have closed out at break even but didn’t unfortunately. I am hoping John’s analysis is correct but if not then it’s my fault anyway for not using a stoploss.
Well today should prove without a doubt that news doesn’t matter. GDP +0.1% yet stocks ripped to the upside. Honestly if it was so simple, GDP bad = shorts make free money, everyone will be rich. And of course, shorts will blame manipulation, fake earnings, POMO, whatever. There wasn’t even any POMO today. I see comments like “Hopefully John is right” or “I hope this falls apart.” That’s the problem right there. “Hope”. If you are trading, you don’t “hope” for shit. You see a setup, which is never a sure thing but a potential, enter the trade and if wrong, you take the loss. You bears have all been baited with this “sure thing” like it has to happen. And when things go against the bear case, it is oh so unfair why is the world not listening, why why why. The problem is most intelligent people are bearish because they look at evidence, the data, etc. But market don’t give a damn about data. There is always some narrative that can explain bad data as good, or good data as bad. Best to not read the news and stick to the chart, using price alone.
Here is an example. “$RUT is weak, momo stocks are getting killed, so that must mean top” But $RUT still above 200-day MA. The 200-day MA is rising. What if RUT bottomed and now goes up? If you are short, do you have an alternate scenario, “if stocks does this, then bearish, but if stocks do the opposite instead…? Instead people just say hell ya GDP bad, it’s going to go down. When it doesn’t happen they just say well it can’t keep going up, I’ll just stay short. Can’t go up forever, blah blah. Only it can.
Right now, we have potentially triple top on Dow. I also noticed last 2 jobs reports were both tops in March and April. So POTENTIALLY a short which is AGAINST THE TREND and therefore has lower odds of success. You can short but if you are wrong then take the loss instead of being a victim. Market is not fighting you. You are fighting yourself. You read John’s analysis, so many things are bearish, and think you are going to get rich, only there is nothing that says it has to go down right here right now. High levels of margin debt can get higher. VIX is low but can get lower.
1st Quarter GDP 0.1% and the taper continues. 45 Billion a Month is still a large amount of money. I figure that when the taper reaches about 25-15 Billion this market will collapse. QE is the only reason this market is up and it is slowly going away.
Securities market credit ($ in mils.), 2014
End of month Margin debt Free credit cash accounts Credit balances in margin accounts
January $451,298 $126,563 $165,336
February $465,720 $128,676 $159,520
March $450,283 $130,251 $163,485
I think Alex needs to take a break or get his own website
Credit Balance
01/2013 -77,215
02/2013 -70,265
03/2013 -92,219
04/2013 -105,885
05/2013 -86,791
06/2013 -86,220
07/2013 -98,472
08/2013 -99,615
09/2013 -110,612
10/2013 -117,652
11/2013 -130,879
12/2013 -149,358
01/2014 -159,399
02/2014 -177,524
03/2014 -156,547
oh!
That’s right.
NYSE Margin Debt Declined in March after Eight Months of Increase:
http://www.advisorperspectives.com/dshort/updates/NYSE-Margin-Debt-and-the-SPX.php
In terms of sentiment, we are climbing the classical wall of worry : worry about valuations, economy, tapring, QEeing. In terms of charts, we are creeping up, this is not 1929, 1987 type of price action. Wake me up when euphoria comes around.
In terms of logic, there is lot of logic. Where to hide the money from inflation, bank bail -in schemes, confiscation of gold, no yield from treasuries…where?
This decrease in margin debt is definately significant. Similar declines over the past few years led to temporary corrections in the US indices.
The question is whether this time is the start of something bigger. Looking at the 1995-2000 rally, SP500 rose by 240% while margin debt rose by 355%.
For the current cyclical bull (since 2009) SP500 is +177% and margin debt is +163%.
Over the past year (up to February 2014 margin debt high) SP500 is +29% and margin debt +28%.
So we are nowhere near a 2000-type debt divergence.
Elliot of SPX by Caldaro places today in iii of 3 of extension II of Primary 5.
Ipso facto- SPX (presently 1884) must see at least 1921. If it turns so low then it’s a short leg down and then the final upleg which would typically see 1958 as the end of the long term bull, but in reality could be anywhere above 1921.
I have 1923 as a target high….square of price and time…..perhaps June ______th ?