

Or buy into weakness, what’s it going to be?
Valuation looks like this:
 And the Russell 2000 trailing p/e is now over 100.
Bull market looks like this:

Sentiment looks like this:
Leverage looks like this:
Solar cycle looks like this:

Economic surprises for all the main regions continue to wallow negative, and US earnings season is kicking off with 84% negative guidance.
Biotech, Social Media, the Russell 2000 and the Nasdaq all broke down as of the start of March, fulfilling negative divergences.
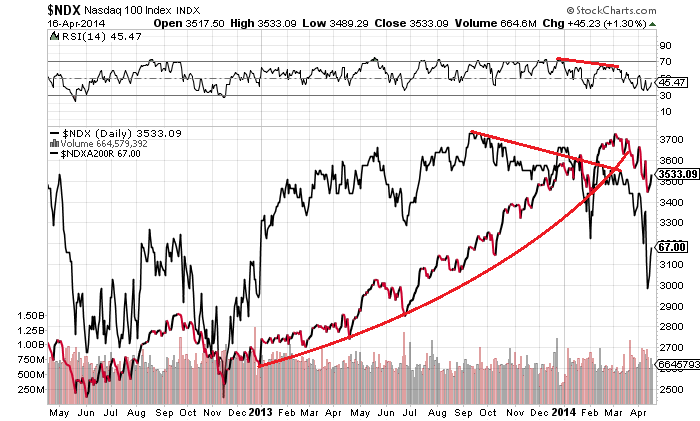 We now await the large caps of the SP500 and the Dow to follow suit.
My calls for the Dow and Nikkei having topped out Dec 31 still stand. The Dow did everything it could to close above the 31 Dec high without actually achieving it this far.
No crash Monday or Tuesday of this week. Instead the market sold off into the full moon and then bounced intraday. So time to get bullish? No way! The waterfall declines are the last piece of the jigsaw. On the back of a 3 day rally we now look to earnings season to support the market, but earnings are projected to disappoint. We need a historic normalisation of earnings at this point to justify the valuations. The market could of course continue to range-trade rather than sell off, and so to the question as to whether it’s appropriate to sell into strength or buy into weakness here. For me it’s clear: the multi-angled case to be short is compelling and a rare opportunity. The rug may be pulled at any point, but will be pulled eventually. I’m short equities and still looking for opportunities to add short on the rips.

I love your chart of the solar cycles and various peaks John, really beautiful and well done. Thanks.
It seems that we just had a VIX Buy signal in which the VIX closed back inside the bolinger band. McHugh says that ” we have had 7 of them over the past year, and in every instance, a stock market rally that rose 500 points or more in the Industrials occurred, starting with the
Buy signal. Most of the rallies were fast and strong.”
So I think we need to be careful being short yet.
“Past year” possibly an anomaly from euphoria.
If McHugh is bullish it’s best to be bearish lol…
John, Best of health to you and your family. I think the specifics of McHugh as stated by Mae above is one of the last confirmations that we need for the final breakdown next week. The last piece would be Gartman stating that he is long stocks again. Looking for this next break as an opportunity to cover shorts and go wait for the Dow to finally make a new high with the Naz showing a lower high as the public finally jumps into the market in the “safe” dividend paying Dow stocks. Next 3-4 weeks will be fast and furious in both directions I believe.
Ditto that!
Ditto again
Thank you both
John,
Are you looking at the new moon, April 28th, as a possible inflection point? It seems like it aligns well with a very weak period in the mid-term presidential cycle. As well as in close proximity to the next FOMC and NFP, which should/could further confirm the FEDs move to exit (for now).
Thanks.
Yes I will be looking at that date for potential.
I love your analysis BUT stop shorting based on funnymentals. Short when the market has broken for sure. Until then stay long or you will go broke and insane. Many stocks are still very very undervalued on a singular basis while some sectors or not. Your indicators here may go 2-10x more. There is no way to know until the market has broken on the chart. Broken and a catalyst event. Not war but a real market event.
I think what john is saying is that there has never been such a great shorting opportunity. We have a bunch of bubbles. The top 1 percent who own a lot of stocks, stimulus, housing, credit, sovereign debt. Once this bursts, it is going to be a waterfall event.
I actually want john to research sales divided by earnings. I bet this is the most expensive stock market for the median stock on that criteria. With these bubbles, based on sales, not earnings, this is one huge bubble. These margins or earnings may be fictional anyway.
I sense your concern for John, but we have all heard your doubts, they are duly noted, no more needs to be said. John is a very capable person, and I trust his judgements. There were times when John was going long and everyone thought he was either crazy, or had balls of steel. In the end he was right, so must have been balls of steel. So I for one will not doubt him. Topping is a process, and may not top out today or tomorrow, but soon enough. He has been known to take profits and re-load, so I am not worried about his “money management”.
John, were you short last year at this time as well?
I had the same list of reasons in 5/2013 — solar maximum (They were calling 2011-2012 peak then.), presidential cycle and Sell-in-May/geomagnetic seasonality. Second time the charm? I do hope so…
Versus the Nikkei in 1990, we are already late in this peak. The Nikkei peaked before demographics peak in 1991, while China demographics peaked in 2012-2013?
Nov 2013 I started to look short
That dshort chart comparing margin debt to SP500 growth is very striking. It appears to show that growth in margin debt has accelerated away from SP500 growth, especially during 2013.
Since January 2013 SP500 has risen from around 1464 to around 1884 – that’s a +29% increase. During the same period, NYSE Margin Debt has risen from $364,107,000 to $465,720,000 – that’s a +28% increase. http://www.nyxdata.com/nysedata/asp/factbook/viewer_edition.asp?mode=table&key=3153&category=8
At first I thought the disrepancy must be due to whatever deflator dshort used to get their “real” data – but surely that would have the effect of reducing the debt figures more than the SP500 figures?
So is it due to dshort picking 1995 to start the comparison, or am I missing something, or using the wrong statistics?
We are only weeks if not days from market crash. Still not sure if it is going to be mini crash or the real thing. This week’s rally was a bull trap.
The people talking about crashes sounds like desperation or just wishful thinking. What is the evidence that the time is here and now? Economic data such as Phily Fed, unemployment claims, are all great. Stock reclaim moving averages, and there was strong reaction in RUT and NDX off 200-day MA.
Btw, there is an important cycle that hit mid-March on the NDX, every hit on this cycle has caused a 10% move or more up or down. This same cycle also timed both the 2000 AND 2007 top. I don’t have a crystal ball, but the fact that this cycle hit when the market is expecting a hefty correction should not be taken lightly.
Weekly momentum is still pointed down and NYSI and NASI still on sell even after this move up…
Interesting article on IBM… http://www.zerohedge.com/news/2014-04-17/great-stock-buyback-craze-finally-ending
I believe Marc Faber said this market went up about 300%. For investors, sell high, buy low . Leave the rest for the players!
There is no technical evidence that Nasdaq and others should be followed by DJIA and SnP. Why shouldn’t it be the other way round, Nasdaq to join the range? That knot candle at support is a reversal pattern, so Nasdaq for me is aiming up. As to all those indicators, I won’t argue,because I trade the market, not the indicators. If someone tells me that bullishness is at all time high, while all wannabes seem to wait for the crash…come on. If I were smart money, I would read retail opinions, doing exactly the opposite.
‘You see the show, but you don’t se the thing’ – Big Shar.
This euphoria chart by Citigroup, Citigroup, my best friend, so passionate about helping me to make money. All those Fabers Soroses Buffets, trying to help me to become like them….as if they were not predators wanting my own shirt.
What that bull duration graph from shortsideoflong is telling me? That bull may last for one or 8 years. If it can go for 8, it can go for 10, why not? So why not another 250 weeks?
Tiho (shortsideoflong) went short the stocks in late 2012, long silver, long JPY (ouch!) and long sugar. If he trades for real at all, he’s broke by now or severly damaged, financially. I suggested to him in early 2013 to admit mistake and take the loss. He probably never considered he might be wrong. He digs up evidence that the stock market is overbullish, overvalued and overextended, that is his market ‘strategy’. Want to lose your shirt? Follow Tiho.
I am not saying that going short or being short now is a certain way to lose money. The stocks may bounce around for weeks or even months, giving opportunies to exit at break even or even take profit. But there is a big way from expecting a crash and profiting from it. Traders may move stop loss to break even too early, or exit out of impatience or stress before crash begins. Or go euphoric in early stages of crash, add to position in wrong place, and exit from the first position to get back the loss from the second…or try to keep the position for long, loo long, while the correction to come (the same for over a year now) may be short & shallow. My best daily session result is still May 6th, 2010, not because I expected a crash or was positionned for it. I was simply clicking on sell button and getting frustrated that no automatic tp is good enogh. If a day like this happens in future, I will for sure hold and add.
From Ben Hunt, a very thoughtful market strategist:
Anemic growth remains the Goldilocks scenario for markets, not so cold as to make for a recession but not so hot as to take the Fed out of play for “emergency” monetary policy implemented on a permanent basis. Good real-world news is bad for markets, and vice versa, because that’s the dynamic that impacts Common Knowledge around the Fed. The market is in a tough spot right now, as good news will not make the market go higher (Fed stays on the tightening path) and bad news can make the market go lower if it’s really bad news (or if the Fed gives more signals that they’re tightening regardless of how bad the news gets).
This tough spot is made even tougher by both a market fatigue with Fed jawboning (excuse me… communication policy) and a growing sense, fair or not, that the Yellen Fed is kind of flailing around right now. The dominant Narrative by a mile is still Central Bank Omnipotence, where the Fed is responsible for all market outcomes, but there are definitely signs of a growing counter-Narrative, one that I call “The Incompetent Magician”, that bears close watching. The Incompetent Magician Narrative is a story that’s very dangerous for markets, because it’s a story of loss of control. This is what makes private sources of liquidity dry up, this is what makes for a deep bear market, and this is what would drive gold into the stratosphere.
The Incompetent Magician Narrative has been around for decades, usually resting deep in the depths of counter-cultural media and the like, sort of like a flu virus that can lay dormant for years within an animal population. Over the past few weeks, though, I’ve seen a few outbreaks of this virus, or at least a strain of the virus, within mainstream media. Nothing to be concerned with yet, but like I say…something that bears watching.
There are some cycles coming into play that may give the bears a chance.
During this bull market there have been some important highs and lows that are about 18 months apart. First were the January 19, 2010 and July 22, 2011 highs. Next were the February 5, 2010 and August 9, 2011 lows. A similar situation has set up with the October 5, 2012 high matching the April 4, 2014 high, followed by the October 18, 2012 high possibly matching April 17, 2014. The chart patterns look similar.
Going back 84 years from yesterday was the April 17, 1930 rebound high out of the 1929 crash. As mentioned earlier, the eclipse setup in 1930 was close to the setup in 2014 with the lunar on April 13, 1930 followed by the solar on April 28, 1930. The corresponding dates this year are April 15, 2014 and April 29, 2014.
In addition, major crisis wars and other bad things very often hit near April 19. These would include:
Boston Bombing – April 15, 2013
BP Oil Spill – April 20, 2010
Oklahoma City Bombing – April 19, 1994
SF Earthquake – April 18, 1906
Start of Civil War – April 12, 1861
Start of American Revolution – April 19, 1775
I took a small short position at the close yesterday.
Don’t go broke before the game’s over, my love
I have been travelling with only very occasional Internet access so probably am missing a lot but has anyone heard about Austrian banks being in a lot of trouble? Maybe just a rumour…..?
J
Thanks all
I was on record here a few months ago as arguing that the fundamentals are too strong for anything more than 5 – 10 % corrections, and that a full-fledged crash was off the cards. Yellen’s remark over a month ago, that the unemployment target of below 6.5 % was being ditched, was another nail in the coffin of the bears (although markets initially tanked because they didn’t understand the meaning of her words).
Now super-dove Yellen has stated that the underlying economy is weak. This means less QE tapering. In short, don’t fight the Fed, and remember that a key bullish driver for stocks is the 10 year TNote which is a measly 2.65 %.
Notwithstanding the above, I sold 70 % of my stocks beginning April, not in anticipation of a crash but to repurchase my favourites, because I feel this year will be a trader’s market as each side (bull, bear) temporarily gains the upper hand.
I would be interested to know whether JH sees conflicting solar signals that could reinforce my fundamental view that 2014 will be a trader’s paradise, or whether he sees very strong solar cycles pointing in one particular direction.