

The solar cycle matters for this reason:

Peaks in the activity of the sun produce speculative peaks by variation in human excitement, so it is a trading timing tool.
It has been a thrill to watch in real time this solar maximum unfolding and the associated congregation of indicators suggesting a historic top in equities occurring close the solar maximum again. Each of those indicators that I have aggregated has a reliable history on its own, so the question is why the stock market has not tipped over to the downside more decisively by this point. It looks like the answer may be that the sun is still increasing in activity:

4 consecutive daily sunspot prints over 240 over Easter weekend keeps the visual in trend in ascendance.
Previous speculative peaks occurred close to the smoothed solar maximum and on a monthly spike in sunspots, so the question is whether this solar strength can be maintained for the rest of April and for the weeks and months ahead to drag the smoothed maximum from end-2013 to mid-2014. Either way, this continued solar strengthening was a bad miss by most solar scientists, with only SIDC in my congregation running such an alternative, and kudos to Mark for suggesting the maximum would extend.
Note also how at this solar maximum we are seeing a higher later peak in a fairly typical double peak, whereas previous cycles tended to produce the higher peak first:
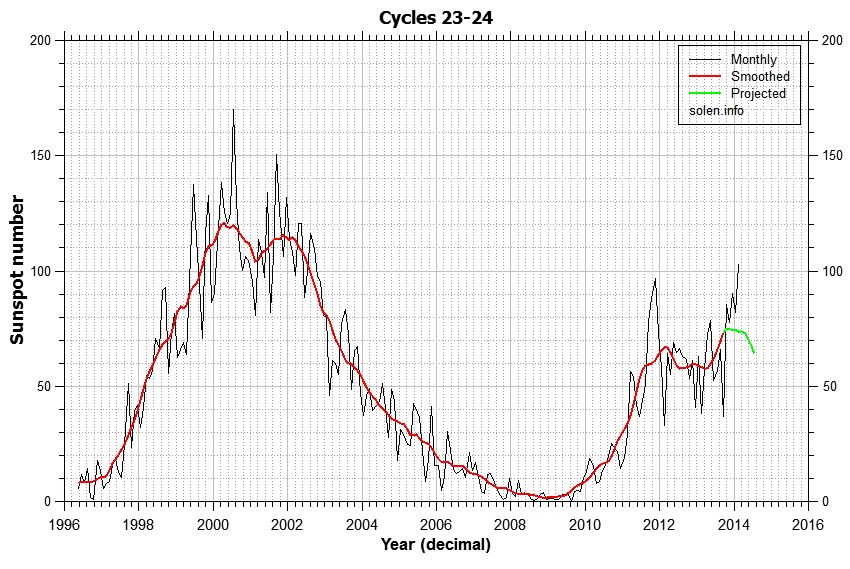
 Sources: Solen and SIDC
This adds to the peculiarity of this solar cycle maximum.
The implications for trading depend on how the solar maximum continues to unfold. If the smoothed solar maximum is dragged out to mid-2014 then we may then be looking at the Autumn/Fall for a true stock markets sell-off. If on the other hand sunspots quieten down in the weeks ahead then the smoothed solar max may be retained as ~Dec 2013 and the stock markets may be about to decline in a more major fashion. But either way, the persistent strength in the sun’s activity beyond the end of 2013 through to now has been a key and unexpected factor in maintaining speculation and keeping the markets elevated despite indicators at historic readings.
I now look to the end of April to see how the monthly sunspot count shapes up, to see how solar scientists adjust their forecasts, and to see whether other measures of speculation, such as margin debt, show a peak or continue to rise.

John have you listened to Rupert Sheldrake a well known biologist, on Youtube. He has interesting ideas about the sun and our thinking processes. The idea is we are in an interconnected living system – which is the likely future for scientific theory.
Thanks for the suggestion
Hi john,
If APR or mid 2014 does not peak out, when do you see peak again before crisis?
Some said that cycle may peak in 2016/7
Thanks
This Fall by the latest – too many indicators signalling a top
They will stimulate in an election year, but the true economy on Main St. will not benefit as much as in the past. For instance, student loan debt forgiveness is already at 72 Billion dollars, but that only benefits the “lenders” whose balance sheets are questionable, and bond holders who leave the casino in time.
http://www.zerohedge.com/news/2014-04-22/flood-students-demanding-loan-forgiveness-forces-administration-backtrack
Regarding cycles and tops, I follow Martin Armstrong, but who knows…
http://armstrongeconomics.com/models/
http://armstrongeconomics.com/the-business-cycle/
http://armstrongeconomics.com/the-princeton-models-and-methodologies-a-users-guide/business-economic-confidence/
I thought sunspot peaks create excitement, but geomagnetism peak create depression. Should we use the former to stay bullish, and the latter to decide bearish?
That’s roughly it. Geomagnetism tends to peak out some time after the solar peak.
Hi john,
If we meet crisis, how long to recover? What year?
Thanks
Something like this https://solarcycles.files.wordpress.com/2014/01/17ja6.png
John,
Barry bannister, one of the respected market analysts, put out a flat prediction of SPX 1850 at year end calling 2014 the year of consolidation. I link his analysis to recent buying of blue chips dividend stocks that lessen the market correction.
Many takeaways from Bannister’s analysis…. the most exciting takeaway(on page 55)…. waiting for Mario Draghi’s “whatever it takes” action plan in tackling the euro credit crunch situation.
Click to access 2014January14_Bannister.pdf
John,
Andrew Smithers has a fundamental reason for why the stock market only goes up nowadays: corporate execs have a choice of spending cash flow on 1) plant and equipment or 2) share buybacks. 1 creates an accounting decrease to earnings while 2 creates an increase in earnings per share via float reduction. As long as execs can borrow at 0% rates, they prefer 2 because bonuses amount to most of their pay and rising share prices create bonuses. This is why investment in plant and equipment has gone negative while share buybacks+dividends are now greater than US domestic earnings in the US market.
What will cause this mechanism to end? Negative cash flow, which Smithers doesn’t see happening any time soon.
$1.6trln on balance sheets at moment {usa} all time low % rates companies are using this to buy back their own stock and this is having a big effect on share prices and helps justify further gains, I love reading these blogs for and against the market but DO NOT HAVE AN OPINION just go with the flow until its proven wrong. lots of folk will search out bearish or bullish sites just to reinforce their own beliefs. then justify a losing position, yes there will b a pullback trouble is no one knows when, keep buying the dips {as hard as it is} im bearish and hate buying this bullcrap.
I been trading full time for 9yrs and the best thing I ever did was to stop thinking im right and trade what the price action is telling me.
stick to this and keep it simple don’t put too many indicators on your charts.
1. TRAM LINES
2. EWT
3. FIBONNACCI
4 MOMENTUM as a guide to timing tops/bottoms
I pretty much use nothing else, and make a good living from it.
Roberttheinlein, couldn’t agree more just read your blog after posting mine
Robert McHugh just posted his weekend Market Forecasting and Trading report at Safehaven.com
Click to access mchugh_2014_04_20.pdf
If you are patient enough to scroll past all his ads, he has an eye for patterns and waves and has 2 basic scenarios for where the markets will go in the next few months, pages 28 – 31. First scenario is a sooner decline than 2nd scenario, which consists of an intermediate top around May, a correction and then a final top later in the summer.
I personally think we have another bubble before it all goes down as they will likely do more QE if the markets don’t behave, so maybe that would be consistent with another solar maximum later in 2015 – 2016.
Mae, Although John’s work on sunspot maximum and resultant top is best piece of research I have read till date I agree with you that we have NOT seen major euphoria as yet. If you have read Grantham’s recent interview he argued unless we see big bubble S&P 500 will NOT make top and his target was 2350 in S & P 500. Some people think we may see double top in sunspot maximum around Early 2016 and if you see Dow pattern of 1998 and compare 2014 looks more or less similar. Even in 1998 Dow made marginal high the way Dow made high on 4th Apr 2014. Dow fell in Aug 1998 due to russian rouble crises and we have same ukraine issue now. Combining above I think we may see sharp swift correction of 20% in Dow by End May 2014 and then Dow may re-start its upward journey to say around 22000 by Jan 2016.
Someone said current Dow pattern look similar to 1946 etc but i do not find much of match. Barry bannister compared 2009-2014 with 1932-1937 which surely looks similar but in another chart he said S & P 500 will remain flat in 2014 and go up in 2015. So I guess that also means peak around Jan 2016?
You follow mchugh, and you’ll lose your shirt doing so. I can’t believe the guy still gets his stuff printed somewhere.
Hi John
we have had both (north and south) solar polar field flip recently. As Solen says: “Polar field reversals typically occur within a year of sunspot maximum.” Now the average polar field reversal of the current cycle happened in spring 2013 as nicely shown here: http://www.solen.info/solar/polarfields/polar.html.
So I think the solar cycle 24 peaked either in March or April 2014.
Would be perhaps of interest for other folks if you deal with this “predicting sunspot maximum based on polar field reversal” more in detail in one of your next posts (or small update of the current post). I thank you for your great work!
Sinuhet
Thanks for the information Jigs. That sounds logical. I also think there will be a good size correction before the Feds step in again with more QE – maybe why they are tapering now in preparation for that.
I think the PTB psychopaths that control the markets and our country and on their way to control the world would like to keep this thing going for as long as they. Keep the sheeple/slaves placated while they conquer the world.
However, they don’t control God/Universe and that is where analysis of the Sun and it’s cycles comes in.
Hi John-
Sounds like you are questioning the immediate bear case in light of recent bullish movement. If dow confirms a new high are you going to close shorts and run with bulls until fall? I remember you felt that if dow confirmed a new high that it was a game changer. Looks like biotech correction has also run its course and gold is headed down. However, May is around the corner, do you think seasonality will help bear case this year?
Thanks in advance.
I’m playing the short side until further notice. The progress of the solar cycle is what matters at this point I believe.
wot a load of cobblers!! keep buying dips till its wrong, trying to time a top is madness..a close above 16450 is bullish. read my posts on here, buy buy. yes i hate this market it stinks but we al, just wanna make money.
robbie, no offence but you are exactly the type this market is geared for 😉
We better have good weather this summer or the grains are gonna blow a gasket higher.
El Nino is coming.
The short term bearish case has been lost imv.
Thanks all
Have now hedged a large part of my short as the short case is starting to vaporise. This will probably mean the market crashes tomorrow but is rather get out my shorts and wait for the economy to really start turning down before initiating shorts as I don’t want to be sitting with a growing loss for months. I will use the solar analysis to further aid my timing.
I think that market will now return to the bottom of range (around SPX 1800) and then possibly attempt SPX 1900s for one more time. Mini crash or the real one may happen in late May. Indicators are too weak for SPX to maintain strength in the longer run
One thing that seem unexplainable is the beginning of 2003 where there was a clear pivot point but the solar chart shows declining sunspot number. Any ideas what happened there?
Solar cycles are roughly 11 years, but cyclical bulls and bears are shorter than that, so not all peaks and troughs in the stock market are solar.
Interesting, perhaps i’m just finding trends that don’t actually exist but if the sun’s magnetic poles flipped somewhere between 2013-2014 and theoretically that last flip should have been around 2009 (cycle minimum), then the flip before that would have been around 2003 (given timing of about 5-6 years) but it seems that the prior flip was more around 2000. Is there a way to confirm when the flips “officially” occur?