
I’m back and refreshed. Thanks for all the messages, and for all the comments in my absence. Here is the big picture.
1. Primary shift to defensives and away from risk occurred as of January 2014, as measured by stocks to bonds, cyclical to defensive sectors, small caps to all caps and high yield to treasury bonds. Clock ticking from that point.
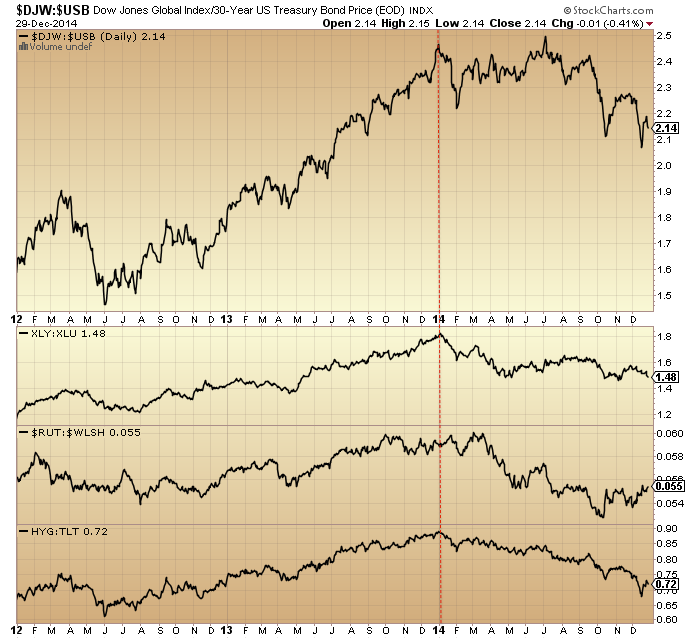
Source: Stockcharts
2. Solar maximum looks to have occurred around April 2014, marking peak speculation. Equities mania on borrowed time thereafter.

Source: Solen
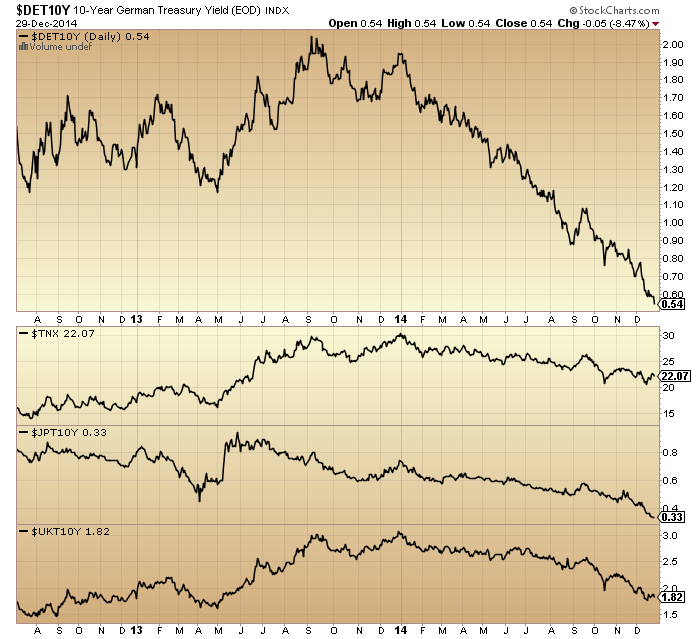
3. Game over effective start of July. World equities, crude oil, high yield bonds and the US dollar all turned at that point. Deflation in charge.
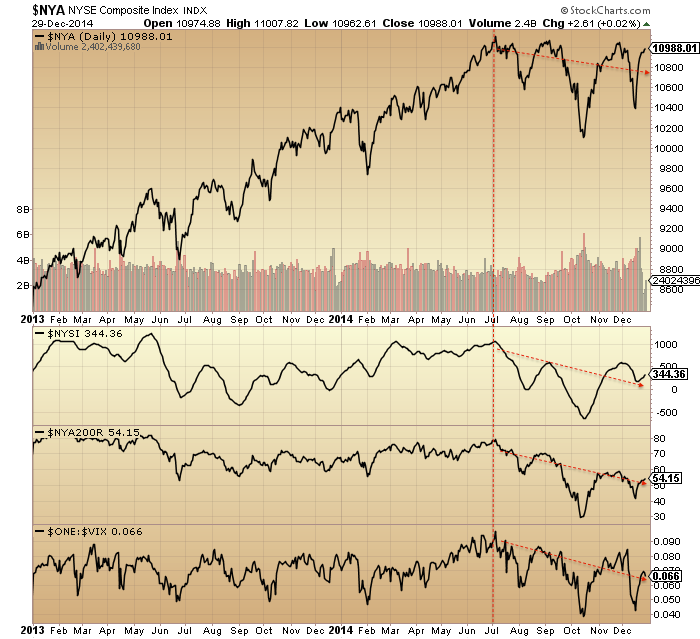
 4. US equities composite, breadth measures and volatility all show the same reversal at the same point: start of July.
5. Those twin peaks in risk appetite at the start of the 2014 and mid-year fit the seasonal model which is from the influence of geomagnetism:

6. Which sets us up for a final peak at the end of Dec 2014 / start of Jan 2015 for those remaining stock indices which have yet to top. I referred to this as my worst case scenario (latest peak) in 2014.

7. Developments in December support this now happening: sharpening falls in crude and government bond yields, flattening of yield curves, blow-off top in equities allocations.

8. A new bear market in stocks will be a cyclical bear within an ongoing secular bear market. No new secular bull market as many believe.

9. This secular position is dictated by demographics.
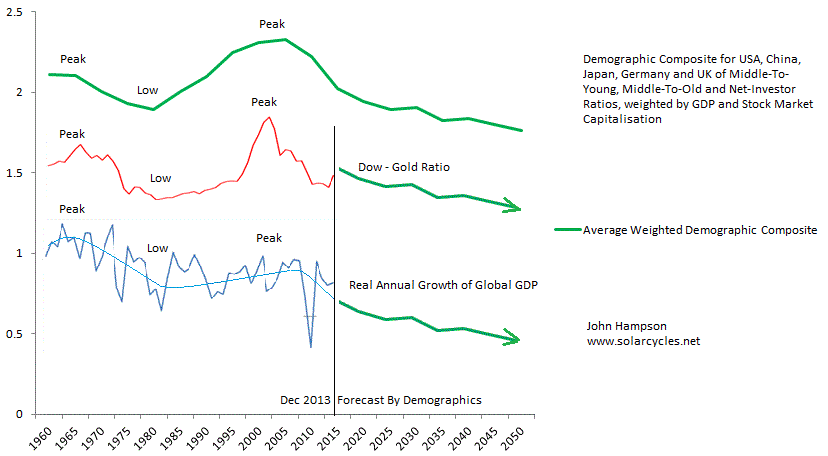
10. The other play from this is that gold should enter a new cyclical bull within an ongoing secular bull, and this is supported by recent signals such as miners:gold ratio, gold/miners sentiment and price basing patterns.
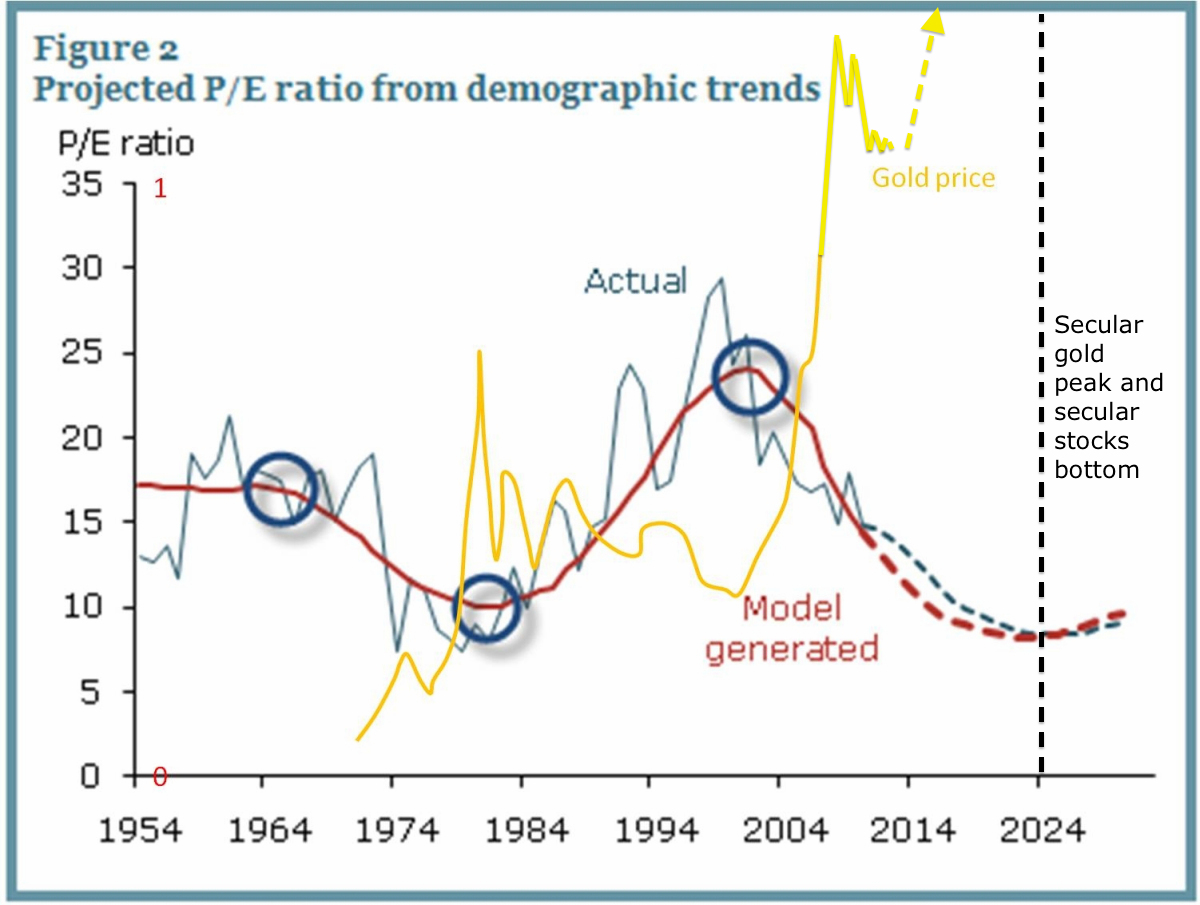
Source: Glenn Morton / My projections
11. A sampling of stock indices from around the world, below, shows 2014 has been clearly either a large topping process or a large consolidation range. If the latter, then we should have seen excesses in valuations, sentiment, allocations and leverage worked off with time rather than price, yet all those measures remain highly stretched, suggesting this is a topping process.
 12. Plus, the two strongest sectors of 2014 are the two that are historical associated with outperformance after bull markets peak out:
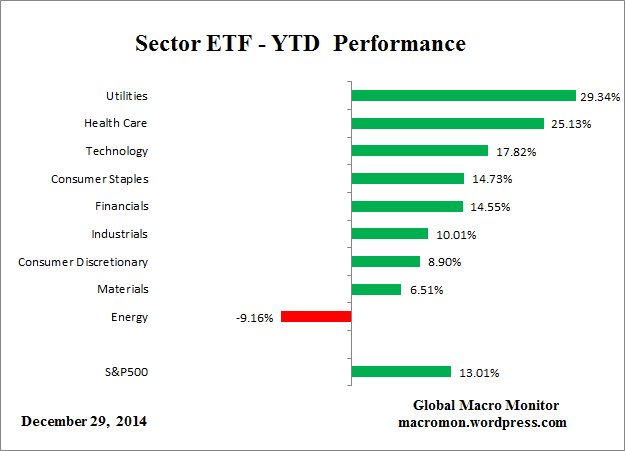
Source: Macromon
13. The peak-to-date in margin debt remains close to the solar maximum. This leverage, along with major extremes in sentiment, allocations, tail-risk, valuations and our post-solar-maximum status, is the set-up for a market crash. To repeat what I have said before, until/unless these measures are reset without a crash, then history dictates that is the most likely outcome. Crashes don’t occur often, but when they do, the set-up looks like the current.
Source: DShort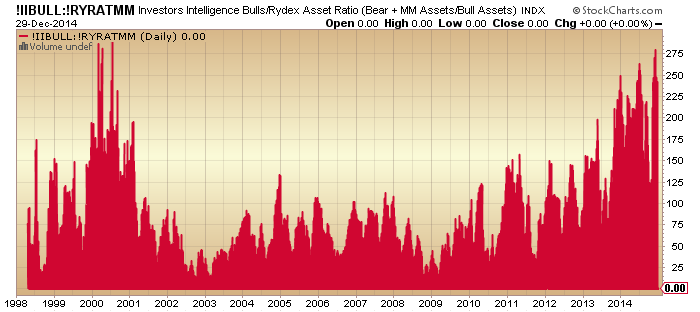
14. Leading indicators and the longer term stocks:bonds ratio resemble 2000, 2007 or 2011, suggesting a minimum 19% drop in equities. This is the percentage figure I quoted as my general target for short positions because, stretching the view to the last 100 years, this is the minimum we should expect without being greedy by aggregating various angles on the market. To be clear though, the set-up is compelling for a bear market, not just a sharp correction, so I refer you to the secular bear chart above for the bigger projection.
Source: DShort
15. Which brings us to the value of history as our guide, because 2014 taught us one key lesson: 100 years of reference points may not be enough, we need to allow for the unprecedented. An aggregation of angles shows how unprecedented 2014 became:
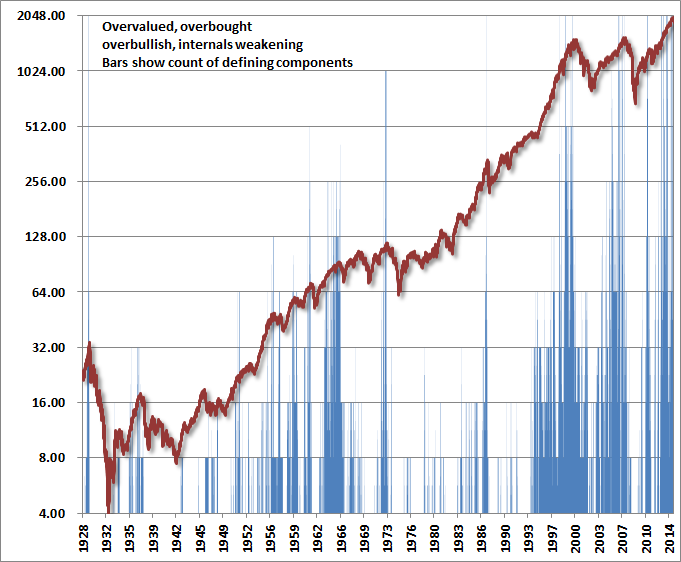
Source: Hussman
So what caused this? The most common view is that central banks brought this about with their policies of ZIRP and QE and unwavering verbal support. However, I maintain that ‘central bank policy trumps all’ was rather the mantra for this solar maximum mania than the driver. To prove this, we should now see equities collapse and gold rise despite central banks, and that is the final part of the real time test for the power of the solar maximum. If I am incorrect, then equities should continue their bull market in 2015 as central banks policies overrule. However, I refer you back to all the topping indicators and angles in equities that have amassed, together with the examples of 1930s US and 1990s Japan which revealed central banks’ true relative impotence. Ask yourself if typing numbers into a computer (ZIRP and QE) and saying a few soothing words can really work.
The crazy stretching of indicators delivered this year made for the most difficult year of trading since 2000, the last solar maximum. So if I can make one prediction for 2015, it is that it will be easier and more predictable. I am short equities and long gold and expect patience to be finally rewarded. I wish you all the best for the coming year.

Glad you are back and hope all is well with you./ Peter from Sweden
Thanks
Welcome back John and thanks for the update. As you know im still bullish. Do you have an exit plan should market continue higher next year?
Thanks. Reduce exposure, stay in the game.
Good to know. By the way that allocations chart scares the hell out of me. We are close but not quite there imo.
“Ask yourself if typing numbers into a computer (ZIRP and QE) and saying a few soothing words can really work.” It has done up to now
My argument is stocks have risen by price not earnings and economic growth is so weak that central banks had to act again this year. The solar max did the mania not the CBs.
On verra. The price will determine.
Another arbitrary mantra repeated over and over is that valuations are cheap compared to 2000, a point in time universally considered overvalued. It is idiotic. Welcome back John Hampson.
Didn’t say it wasn’t idiotic. John may be right or he may be wrong. But he has been wrong in recent months.
Cheers
Welcome back John! and Thanks for the beautiful charts.
Dec. 26 was a Bradley turn date +/ – a few days. McHugh has a target for the SPX to be about 2,100 – 2,150, not too far away.
Looks like oil according Elliot wave charting is starting a wave 5 down and has more to go, which could freak the markets out.
I found this really neat chart predicting a Voodoo U.S. Dollar yearly index candle for 2015 (long inverted hammer) – which would mean extreme volatility next year. http://www.safehaven.com/article/36225/oil-and-us-dollar-index-technical-analysis
Thanks Mae
Thanks John for an excellent post to round the year off. Although there is much of value as usual ….. for me its these 2 sentences:
====
To repeat what I have said before, until/unless these measures are reset without a crash, then history dictates that is the most likely outcome. Crashes don’t occur often, but when they do, the set-up looks like the current.
====
I agree ‘its NOT different this time’.
My Best Wishes to yourself and ALL here for 2015.
Thanks!
Welcome back, John and season’s greetings to all.
Interesting piece here on the deepening strategic ties between Russia and China:
http://vineyardsaker.blogspot.co.uk/2014/12/vineyard-of-saker-white-paper-china.html
Long gold but not in a big way. Still open to possibility of a final move down sub-$1k later this year. Looking to see if I get a miners long entry this week tho.
Thank you
Had a look at the Sunspot chart above but a bit confused. Why is there hardly any sunspots near 2007-2009 crash. Apologies if this is a newbie question as its not an area ive studied in any detail.
It was the 19 year cycle crash of the Earth, Moon, and Sun considered in only two dimensions. (South Sea Bubble, 1929, 1987, and 2007).
Thanks. Much appreciated.
With respect John, one other point. IMHO, I think 2015 will be one of the toughest and least predicatable years. I say this as I think the first half will frustrate both bulls and bears. With possibly the sexond half being bias towards the downside.
BTFD is the new CB subsidy/welfare program for traders and investors. It’s purpose is the promote the illusion of prosperity and confidence. CB’s have your backs, right! Investment genius is a short memory in a rising market. How much longer?
John’s #3 “Deflation in charge”. Right on!
All CBs aren’t doing enough to counter deflation. so my simple logic says we will see a panic (crash of 20+%), and the CBs bring out their nuclear devices…that will also reset the deflation/inflation debate.
What a mass. All cause by too much debts accumulated that needed to be deleveraged.
But let price be your guide when the panic will come.
The ASSETBULL:ASSETBEAR chart under point 7 above shows a current reading of 19. That’s a strikingly sharp increase recently, but given that it’s a simple ratio of bull assets to bear assets, what’s to stop it going higher? Potentially much higher?
And the BULL:RYRATMM chart under point 13 is showing a current reading of zero. Is that just a false reading?
Mark, I believe the point John is demonstrating is the ‘extremes’ to which these measures have been stretched compared to history.
I appreciate that purvez. I am not criticising the use of these charts. I’m suggesting that, rather than look at the likes of the ASSETBULL:ASSETBEAR chart and think “I’m not aware of that happening before, it shouldn’t be happening, and must correct itself”, that it is more prudent to ask “why is that happening now?”.
Comparing things to history means going back a lot further than 1998. These measures are only stretched compared to very recent history. There have been times in the past when assets increased by thousands of percent within a year or two.
It can go to infinity, so perhaps we should invert and calculate BEAR:BULL instead. I am not sure what is in the fund. For a short term bond fund, if the expenses exceed the yield, it would be very rational to redeem completely even if you were a bear — cash is better.
I like your proposal to invert the chart – we humans see something surging upwards and instinctively feel that its unsustainable. When we see something surging downwards, we find it very easy to extrapolate it to zero!
The Bull:Ryratym zero is false, don’t know why it says that. It reached its peak-to-date in 2014 in Dec.
Dear John,
Wishing you the best for 2015.
I have no good alternatives to explain 2014.
Either
(i) Solar maxes do not predict crashes, and yet by coincidence predicted >90% since 1763 (Solar Cycle 1)
OR
(ii) We are in the unlucky 10% of the time where there is no crash. From SC1 to SC23, I could not identify crashes in 1778 and 1959. (And perhaps there WAS a crash that I don’t know about. I know of the Kennedy Flash Crash of 1962, but did not attribute it to SC.) However, valuation/China/leverage would have to be explained.
OR
(iii) This crash will come as one of the latest ever in the cycle. It has already exceeded 1873 and 1929. This brings us to SC1 where the crash would be projected to be 2015-2016. I am not saying that this will be SC1 — we could crash at anytime I suppose. Just that for the 23 datapoints, I see 21 crashes and of which 20 crashes indicate that we should ALREADY have peaked.
None of this is convincing. Pick your poison?
John Li.
Regarding SC1, 1759 would look like 2011. The crash was the Amsterdam Loan and Banking Crisis in 1763 (~2015). My date is the date of the CRASH — I don’t have the date of the PEAK, which could have been earlier. Let’s say 6M earlier, but I am being generous here as the bears have little ammo left for error. Perhaps someone knows the date.
China is late to the “Shadow” banking game…it has been around since SC1.
https://www.frbatlanta.org/research/publications/wp/2012/12_08.aspx
Thanks John. Yes some things are anomalous this time. The full assessment needs more hindsight yet.
Two other possibilities:
1) The max has not yet occurred. It will occur in 2015 or 2016.
-OR-
2) The crash did occur and it was in oil and other commodities.
“max” = “solar max”
You are right. Adding your two options in, we have five, but still no good choices.
1) Scientists expected a solar max in 2011 or 2012, so option #1 would be abnormal as well. In addition, I based my time window on an average of indicators, such as a polar inversion, which has already occurred in 2013, or the time from the solar minimum. These should not change even if the solar max does change.
2) Perhaps the crash was in gold too. That feels wrong to me, because I did not detect the euphoria for gold or oil. But at this point, I accept any possibility. I haven’t lived long enough to know if there was euphoria in every solar max crash — it is just our hypothesis.
I was involved in gold during 2010 and 2011, and, believe me, among gold traders there was euphoria! Gold’s going to 5,000, gold’s going to 10,000… you get the idea.
Crude’s big runup was in 2008, so on second thought it probably doesn’t qualify, if you need both a euphoric top AND a crash to qualify. Gold would qualify but the timing is a bit early, having peaked in 2011.
Newt, I’m onboard with#3 deflation as well. In 2007, Housing/subprime was falling apart and few paid any attention. Now, deflation is very pronounced in oil, commodities, Europe, plus the deflationary effects of the economic collapse in Russia, Iran, Venezuela, developing world. It is all interpreted as positive. I expect similar results like 2007 next year. I expect the turn now, but acknowledge it could go all the way to the fall.
Per Gann, next year is the year of Ascension, but also a year of panic. The 2 eclipse (Puetz) cycles have the solar eclipse before the lunar eclipse. That is the most favorable alignment for crashes. That fits with Duncan Smith’s very difficult year scenario
One could easily see crashes from fundamental economic deflationary factors, immediately followed by CB’s panicing to save the day. The big panic will be when the realization that QE INFINITY does not work.
so if and when you short a panic, you must take your profit quickly. CBs can’t allow the confidence to be broken. They will destroy the shorts.
The mirrors from history took 2-8 weeks, so very swift crashes/panics. I don’t see CBs can stop the forced redemptions washing through once they start. No doubt they will act, but I don’t think they can stop it.
In early December Gold failed at its 100 day ma. This time, will it break above its 100 day ma or fail and set back for the second time to new lows?
Is February’s Gold futures rallying to retest its 100 day ma a warning that Stocks are about to decline in a meaningful way? Even though Gold’s 50 day ma is below its 100 day ma which is below its 200 day ma, when it touched its 100 day ma and set back in early December it did not break to new lows even though it did fall below its 50 day ma. Now it is back above its 50 day ma and looking to retest its 100 day ma once again. All this recent price action in gold may be pointing to a serious decline in stocks is at hand.
Even in severe bear markets like gold and oil now, you get bear market rallies above the 100 day and even the 200, but it ia still a bear market. The first major bear market rally is not due until the end of 2016. Prechter of Elliott Wave, Rosen of Delta, and Flannagan of Gannglogal are all bullish on gold. If all three of tjose guys are right at once, it would be a new era.
So far today the big movers are Gold and Yen are up and stocks are down. Hmmm….seems to me that something is afoot.
Another aspect of simply ignoring the bad news of deflation. S&P IQ expects a 21% drop in oil company earnings. Another is the strong dollar will blast earning of major internationals, one of the strongest groups. With the market at all time highs, apparently nothing to worry about.
Sharing one(1) tool. $NYLOW currently at only 28. At this level, there is no TA basis to justify initiating a short today. The market is doing its “healthy” consolidation.
The market is teasing John’s work until it is ready to plunge.
Nice to see you again, John.
@apanalis
Thanks Antonio
Tomorrow is last day to signup for two week trial at greedometer.com for $1. Current outlook is for SPX top 2150-2200 end of Jan with ECB approval of
full QE for Euroland.
https://www.greedometer.com/subscription-level/temp-signup/
Welcome back John, I wish you a happy and healthy new year.
A comment by Chien-Jen on the previous post contained a link to a blog that seemed to suggest that the current solar cycle had not peaked yet. Here is a link to a chart within that site:

This was the site linked: http://time-price-research-astrofin.blogspot.tw/2014/11/ar12192-biggest-sunspot-in-two-solar.html
I wonder if this explains why the markets haven’t yet rolled over? Any solar experts have an opinion on this matter please, which would seem to be very important for establishing short or long positions?
How/when exactly does one definitively know the solar cycle has turned down for good (is it only in hindsight I wonder)?
Good luck everyone.
PS…the FTSE firework is now falling gracefully back to earth, hooray for gravity!
Thank you. We need more hindsight to be sure the solar max has passed. Just working on probability.
John,
Glad you are doing better
Happy healthy New year to you.
Yhank you for all the insights you and the site have provided.
Thanks Len
GM, for SC1, I had mentioned the Amsterdam Loan and Banking Crisis in 1763. That would be the longest wait of all SC1~23 with the exceptions of the two non-crash scenarios.
However, the red line was not updated past where the correlation broke down. The black line here equals the same red line, and shows that we have turned lower.
Thanks for the update.
thanks for posting this. it is in line with the top still ahead of us!
GM – you need to decide what measure of solar maximum to use, if you’re going to use it for timing purposes. For example, the SC1 chart you posted quotes “SSN” (ie. the Smoothed Sunspot Number) but it in fact shows the ISN (International Sunspot Number, which are monthly numbers).
The timing between them can be very different. In SC17 the SSN peak was May 1937 and the ISN peak was July 1938 – if you’d shorted US stocks at the SSN peak you’d have made a lot of money.
But in the previous cycle SC16, SSN peak was around May 1928 – going short then would have lost you a lot of money. But if you’d waited until close to the ISN peak in late 1929 and shorted then – well, you’d be more famous than Jesse Livermore! http://www.solen.info/solar/cycl16.html
John Li has already pointed out that the red ISN line in the SC1 chart is a couple of months out of date (having since dropped to 60, then bounced to 70). But tomorrow’s new ISN will show it back just above 80 again – so the SC1 comparison is still valid. But my own view is that ISN will more likely stay within its current plateau range between 40 and 100 for most of 2015, rather than reach new highs (I base that on cyclical magnetic models which have been reliable so far, and also the current downward trend in neutron counts which probably doesn’t have much further to go).
My view is that when ISN eventually drops out of its plateau, then the rug will be swept from beneath the current speculation.
Respect to Mark for promoting an alternative to my own. We are working this out as we go along.
Thanks John. Just focusing in on those SC16 and 17 SSN timings in this chart reveals the extreme risks and rewards of trading at times like these: http://www.chartsrus.com/charts.php?image=http://www.sharelynx.com/chartsfixed/USDJIND1920.gif
Shorting the Dow at 185 during mid 1937 SSN max would have been very profitable.
Shorting it at 220 mid 1928 SSN max would have been the opposite.
Absurd as it may seem, but I still believe there is an 80% chance we will soon witness a 1928/29 style bubble in US stocks.
Mark,
Agree 100% to what you said. I consider you technical expert when it comes to understanding of sun :-).
Mark, I too had always assumed SSN just meant the generic term for “sunspot number”. Thanks for clarifying.
Is it often true that SSN peaks before ISN?
Can you point to where I could get the ISN data from 1929?
Yes, SSN has aften peaked before ISN in the limited 23 examples we have to go on.
In common relatively strong cycles there will, by definition, the two will not be far apart because ISN builds up and then declines steadily and quickly. But in a weaker longer cycle like SC24, ISN forms a wide and fairly volatile plateau so that the SSN peak becomes relatively indistinct – like this: http://www.solen.info/solar/cycl14.html
That’s why I don’t attach so much importance to SSN timing in a weak cycle.
You might find suitable ISN data here: http://sidc.oma.be/silso/datafiles
John, I have a reply to you in moderation at the moment – in the meantime you could try here for the ISN data: http://sidc.oma.be/silso/datafiles
Thanks Mark.
My interest is more academic, as I don’t trade, rather I position funds for the cyclical changes, and ultimately for the deflationary collapse that cannot be rescued by the CBs, but is likely to result in hyperinflationary outcomes, and a reset to a new global monetary system.
Hence, gold is really the only option, as it becomes the only safe asset in a deflating world where currencies are being destroyed. Highly likely that it will be used once more for settlement purposes IMO in the next system (so no more debt build up at a sovereign level), and it’s an easy buy/hold for the long haul.
I always stress that I refer to real physical gold, paper positions will fail in the currency collapses in my opinion, counterparties won’t be able to pay you, so I buy the real thing.
The world faces a hellish 3-5 years, I just hope we avoid WW3 en route to the other side.
All of that makes perfect sense to me.
WW3 may occur in AD 2012~2018
Tang Empire.
Prophecy time since AD 618-907
Five chaotic.
Prophecy time since AD 907-960
Song Empire.
Prophecy time since AD 960-1279
Yuan Empire.
Prophecy time since AD 1206-1368
Ming Empire.
Prophecy time since AD 1368-1644
Qing Empire.
Prophecy time since AD 1644-1911
ROC.
Prophecy time since AD 1911-1972
People’s Republic of China.
Prophecy time since AD 1949-2033
Five Kingdoms.
Prophecy time since AD 2033-2096
Biochemical war to world harmony.
Prophecy time since AD 2096
2014, a year that will live in infamy. I just read David Stockman’s Commodity Prices are Cliff-Diving Due to the Fracturing Monetary Supernova. It explicates the incredible over investment in the mining industry and how the decline has only just begun. I think a good analogy would be most are mistaking the beginning of a supernova with a coronal mass ejection. The supernova is the massive money printing had no where else to go in 2014, as real estate and commodities had been broken, so it went into stocks blowing them past all previous top signals like a tsunami at spring tide.
one man’s opinion. Money printing has been going on since our present banking system came into being back in the early 20th Century. Most of the money printing was done by member banks, not by the Central Bank. Whenever a bank loans money it does not have, it “prints” money. Banks generally loan many multiples of their reserves, so they are the culprits, they are the money printers.
The “money printing” of late that’s been done by the CB’s is a drop in the bucket compared to the money printing from all the member banks, so I can’t get too excited about theories like Mr. Stockman’s. As I said, it’s just one man’s opinion. There are many other well educated economists who believe Stockman’s conclusion is incorrect.
True. There is around 3% cash and 97% debt in the money system. If everyone in the country decided to withdraw their savings on the same day only 3% would get it back due to fractional reserve banking.
The difference here is that banks can only ‘print’ money when they receive deposits or raise funds from the interbank market. Central banks do the ‘printing’ as they wish,… Simply out of thin air!
T34, just wanted to share with you that banks can and do create money from thin air, and in fact, they do it by making loans to customers, it’s these loans that create new deposits, not the other way round. There is plenty of material online explaining the process, but here’s a video from the Bank of England covering the issue, amongst others:
T34,
Banks create money out of thin air by loaning out money they do not have. They are required to keep only a fraction of their outstanding loan debt in the form of cash reserves. That’s why it’s called fractional banking system. A bank has a million dollars in cash. They can loan out 20 million or 30 million (whatever the current multiple allows). So they end up creating (printing) 19 or 29 million dollars. It’s the banking SYSTEM, not the Central Bank, that is responsible for the dollar losing 97 percent of its value over the past 100 years. The banks create money out of thin air, more money in circulation means more dollars chasing after goods and services, the dollar is worth less and prices rise.
John, I believe you mean that only 3% would get it back in ‘physical’ form. Of course all 100% would have it in electronic form anyway. Given today’s technology driven transaction system the electronic form would be the preferred method of ‘holding’ cash.
That is why I believe ‘bank runs’ are no longer an issue.
Now if you want to talk about ‘counter party risk’…..that’s an entirely different topic, although not very far removed from ‘fractional banking’.
John, you mentioned you were long gold. There is an article over at marketoracle with a prediction on gold over the next year. The author is predicting down to 1050 then rally but nothing to strong. The author has been consistently correct in calling stock markets and remains a bull.
http://www.marketoracle.co.uk/Article48824.html
I can’t be as sure about my gold prediction as my short stocks, due to the limited history of gold performing under deflation. But I see gold as the best long investment out of a very limited choice.
Here is the corrected sentiment&allocations combined chart:
Still points to a second chance peak. I actually wonder if 9/1929 was a second chance peak too. Both 9/1929 and 12/2014 are at ATH, but I am referring to the matter it unfolds thereafter.
Very interesting question John Li. A perspective that could change the way one thinks about this lot. Thanks for that.
Not sure if I am really helping. It has been a tough year, and we are back to Jan 1st a year later, thinking the peak will be “soon”.
FED’s internal report sees deflation threat growing:
http://finance.yahoo.com/news/fed-heed-market-view-deflation-033037784.html
John, good to hear you are feeling mentally refreshed.
I agree that the primary theme of
this bull market is the omnipotence of CB’s, in
particular the FED.
It is a seductive and understandable position based
on the power of the FED to alter the business cycle,
however there is a significant difference between altering and
abolishing a cycle – the latter is merely illusory which
will become apparent as the US earning cycle ultimately turns.
Timing this precisely is exceptionally difficult as always.
Wishing everyone a great New Year and hopefully a
prosperous 2015.
Thanks Phil
NYSE going down last 2 days but 52 week highs going up.
http://www.theguardian.com/world/2015/jan/01/japan-suffers-lowest-number-of-births-on-record-as-population-shrinks
A huge bear market in crude
and another incredible year for the SPX,
how may would have forecast that combination
for 2014?.
2015 – increasing equity volatility, would agree with
Duncan on downside bias for Q3/4.
as this is when slowing global growth and a stronger $
may combine to bite on many US multinationals.
The huge fall in crude could be a major net positive(globally)
boosting disposable incomes, reducing production and
distribution costs – this may be currently underestimated.
On the bearish side outside the US, where is global growth
coming from, increasingly difficult to see which would tie in
to a major equity ’15 top, followed by a new bear market.
Thanks Phil. A bear market starting next year would be my guess but thats all. Based on cycles my thoughts are a cyclical bear should run for a bit longer. However, I only trade what I see and right now I cant see much in terms of bearishness from an economic perspective. As an example, the margin debt chart above certainly shows a peak early last year. However, it should also be noted that each bear market was quickly followed by a recession. It certainly doesnt feel like the US is in recession or approaching one. Have a look at Chris Puplavas recent articles which shows cur a 1% chance of recession.
Link to Chris Puplavas article
http://m.financialsense.com/contributors/chris-puplava/hindenburg-omens-caution
I continue to struggle with the ‘net positive’ outcome because globally someone (oil producers / producing countries ) is losing for someone else to win.
I think I would agree with jegersmart that its net positive for developed non oil producing countries.
Not sure how we would calculate whether it would be a “major net positive globally” , but it should certainly be good for developed countries not overly dependent on revenues. Certainly it can and is causing destabilisation if it persists on a more medium term which may be a bonus for the more predatory countries like the US. How it affects the artificial world of markets we will of course find out, however I am ready to start building a long position in oil, at least in tranches.
Good luck all and Happy New Year to all.
J
Time to revisit the 1921-1929 analog to 2009-2017?
From time to time I like to revisit the daily price patterns. In 1926 (=2014), the Dow fell 2% the last week in Dec and an additional 3% in Jan for a yearly low Jan 25, 1927 (=2015). This would be about SPX 2000 (125 dma). The market regained its high by the end of Feb, Was flat thru Mar, then took off in Apr to reach Dow 200 (x100 = 20k today) by mid-Dec. This roughly fits in with the inversion of the 2015 Bradley turn cycles hat I predicted last Oct. Step 2 of 4 for melt-up scenario is full ECB QE by Apr.
Thanks arthurk. Mark was also making reference to a possible 1928/29 meltup with reference to solar cycles. Mark, would appreciate your insight on which year in that cycle we could compare 2015 against?
What I see as key to the melt-up in stocks is what happens to bonds. There was a great graph posted several years ago that leads up to the bond crash of 1932.
http://thehousingtimebomb.blogspot.com/2009/05/great-bond-crash-of-1930s.html
The trend fits Euro bonds better than US, but the implication is clear. when people start selling bonds (mid-1927) the money will propel stocks (and probably gold) much higher.
Duncan,
Looking at sunspot numbers alone, we are already into early 1929, with the market due to peak around September 2015 (interestingly, that date is the same whether looking at an SSN or ISN comparison).
Also, if SC24 percentage gains were to follow SC16 gains (as well as timing) – ie a +90% increase in US stock prices between SSN peak and market peak – then SP500 would be at 3450 by September 2015.
Technical analyst JC Parets recently discussed the S&P. He remains bullish for 2015. Price remains inside a rising channel.
http://allstarcharts.com/fox-business-us-stocks-crude-oil-2015/
IMO bears had their chance in October. A bearish rising two year wedge, QE switch off, perfect October window to mark a peak like in 2007. Yet bulls won through and turned it into a channel.
Welcome back John and Seasons Greetings to All!
Just in relation to Gold. i susbscribe to Jeff Kern who writes a regular article on 321gold. For those that are unaware he developed a mechanical/technical system over 30 years ago for predicting short to long term buy/sell signals based upon the global gold fund USERX.
I have been a follower of Jeff for many years. Over ten in fact and his system whilst not perfect is IMO the best system ever developed for giving reliable and consistent signals on gold stocks and as such gold. In particular the SKI record for nailing MAJOR turns is virtually 100%.
Now, to get to my point. …….I have said constantly that I have been accumulating gold stocks aggresively for several months and I continue to do so because I belive that they are the only sector in the eonomy that offer ANY form of long term value or acceptable risk/reward.
Jeff Kern turned bearish gold stocks and gold in 2011 based upon several signals he obtained via SKI but not least of which was a run pattern of 2 down days followed by 5 up of over 10%. this type of run pattern is rare but is seen at major bottoms as well as tops.
Jeff has been looking for a similar pattern,amongst other things, but in reverse ie,2 up followed by 5 down over more than 10 % to signal the end of the horrendous decline in gold stocks off the 2011 highs.
Well just over two weeks ago that signal was obtained. Based upon my assessment of long term factors in gold, including my belief that a major stock market rout will benefit gold and gold stocks as in 2000 and the SKI system itself, I believe that gold stocks and by proxy Gold, represent the best buy in over a decade and possibly in over 3 decades. I say that because the decline from 2011 to 2014 is very similar to the move in gold from 1975 to 1976. Those that bought gold and particular gold stocks in 1976 made obscene profits heaing into the major blow off in late 1979.
thanks Allan, started a long position early this week but the big down day a couple of days ago made me wonder i may be early…will check into Jeff Kern’s articles.
the 2 down, 5 up pattern–how many of these has Jeff looked at? How many are on record? Same question for the reverse 2 up, 5 down, how many of these are on record historically?
My concern would be that unless there are at least 25 or 30 such instances, the sample size is too small to give any reliability regarding its predictive value.
pC, the SKI system can be back tested over 3 decades and is based upon the longest trading gokd stock fund in the world.
I can vouch for its timing in terms of picking MAJOR tops and bottoms. In regard to the run patterns a 2 up 5 down of more than 10% is very rare.
You have to realise that this buy not based on a singular signal. More importantly Jeff uses run patterns in combination with a series of indices based upon back prices, based on previous trading days ie16-20, 35-39, 92-96 and so on upwards. It is these back prices, which when crossed in a particular pattern that give buy or sell signals. When given in combinatiin with run patterns, particularly one as rare as 2 up or 5 down( the 5 down of more than 10% to new lows) they have always as far as I have been able to confirm mark major tops and bottoms going back 3 decades. Jeff refers tomthem as “life run lows or highs”. The last was in 2011 at the top.
I can’t say anything else other than I have followed SKI for over 10 years and whilst not perfect his system does and has worked to the degree that he has avoided every major decline and caught every run higher. At times he has received false signals but gets stopped out so as to incurr very minor losses.
The system can be very confusing to many but it works. I know it works. So I am confident based upon his system and what I kow of history and markets that gold and gold stocks have bottomed.
There has never been an instance in history to equal the level of fear that we just witnessed in the gold stock sector. That alone is goid enough for me.
Allan
wouldn’t gold stocks also fall with a stock market meltdown?
this has happened before in 08 and way back in the 1930s even with a rising gold price
Brian I have discussed this before with others. This cannot be compared to 08.
In 08 gold stocks were on thetail end of a long run and gold had also been rising.
In the 30’s gold was regulated and only later revalued so how can you compare it to then?
The best comparison to now is 2000 when gold amd gold stocks had been smashed to new bear market lows only to explode higher as the tech bubble burst.
That is where we stand now.gold and gold stocks have been smashed to new lows and offer the only value when to stock buble bursts. It will arttact massive capital on a stock market sell off.
Martin Armstrong for one has put the fear of God into investors over gold and yet back in 2011 he was talking $5000 gold prices in a few years. Now he blasts investors for talking of higher prices.
Sure he got the decline right, but only well after the fact. Now he is talking still lower gold prices but as in tje last time he will be late to see the bottom.
In 12 months time MA will finally join the bull camp.
Agreed, I also noticed this about MA. He talks big because I think he charges a too much for his reports.
Happy New Year, John! Glad to see you back, and look forward to a prosperous 2015. US stocks plunged to close the year weak, but the SPX weekly candlestick chart of December 2014 appeared to be mimic December 2013 almost exactly. If it continues, it means we will get a rally back to recent highs by end of next week before finally peaking:
The panic selling on 12/31 led to VIX filling gap while TRIN spiked above to 1.92. Historically this also points to a ST bounce.
https://davinny.wordpress.com/2015/01/01/201511-happy-new-year/
Happy New Year ! John ! ——-Jia Chunyuan,from China
Allan, Thank you for that information on gold. I will look into Jeff Kern. My intuition says that there is something of value there.
I have invested in gold and gold stocks starting in 1999 for reasons other than just market analysis. Bear with me here. We are suppose to be going into a “Golden Age”. This also means an age of gold. Where people will realize the spiritual qualities of gold and will start to use and accumulate it for the betterment of themselves and mankind.
According to spiritual teachings – gold is precipitated sunlight!! It has a very high vibration, which is one of the reasons it has historically been so highly valued and used as money. And gold in our environments, in our hands, will help humanity to raise its consciousness, help transmute negativity and the downward spirals of our civilizations to reach this “Golden Age” we are destined for.
Maybe this is why the Central Banks don’t like gold. Too much gold in existence would raise the vibrations of earth and the lowly Central Banks and Banksters will no longer be able to exist.
I believe gold and its stocks are a great value now, not only for our portfolios, but for the future of humanity and our planet. Those poor mining companies really need help and funds to start mining more of the sun’s essence and light. As our sun starts to shut down in the coming years, I hope that more gold will be present to balance the darkness. 🙂
Mae, thanks for that. I can’t disagree with the fact that gold has a certain allure and always has amd always will.
I also agree with the idea that gold is going to be seen once again as a significant vehicle to preserve wealth. I know many find it difficult to understand why or how gold is of importance in times of turmoil but history proves it to be the case, so why should I or anyone else think it shall be any different next time?
Just in regard to Jeff, his system is quite involved and needs some devotion and time to understanding, however it is IMO the best system ever developed for giving reliable consistant signals on gold stocks.
Like I said previously it can give ocassional false positives but it is usually quite quick to sell again thus stopping you out before suffering very much loss.
The beauty is that it also gets you into the market very close to the bottom of what can eventually be mega moves of well over 500% and thus more than compensates for a few minor losses and also gets you out before major delines.
SKI warned in advance of every major decline of the last 3 years. Pretty damn impressive IMV.
The hardest part of the system is being able to adhere to signals as it is very easy to want to ignore some signals when euphoria or pessimism abounds. You have to at times, put emotion completely aside otherwise it will not work.
Cheers
$/¥ is going to new highs and stocks will follow. My targets are $/¥ 24, SPX 2170 and Gold 950.
Allan
Apparently gold stocks fell heavily with the GM in the 30s,but did recover strongly and was then out of sync .I agree gold was regulated at that time.
However 08/09 was a scary time to own gold shares.
I think long term you will be well rewarded , short term not so confident.
Good luck, I too am a gold bug.
I think MA is onto something, but I really don’t think he knows how to interpret it.
Thanks everyone, new post