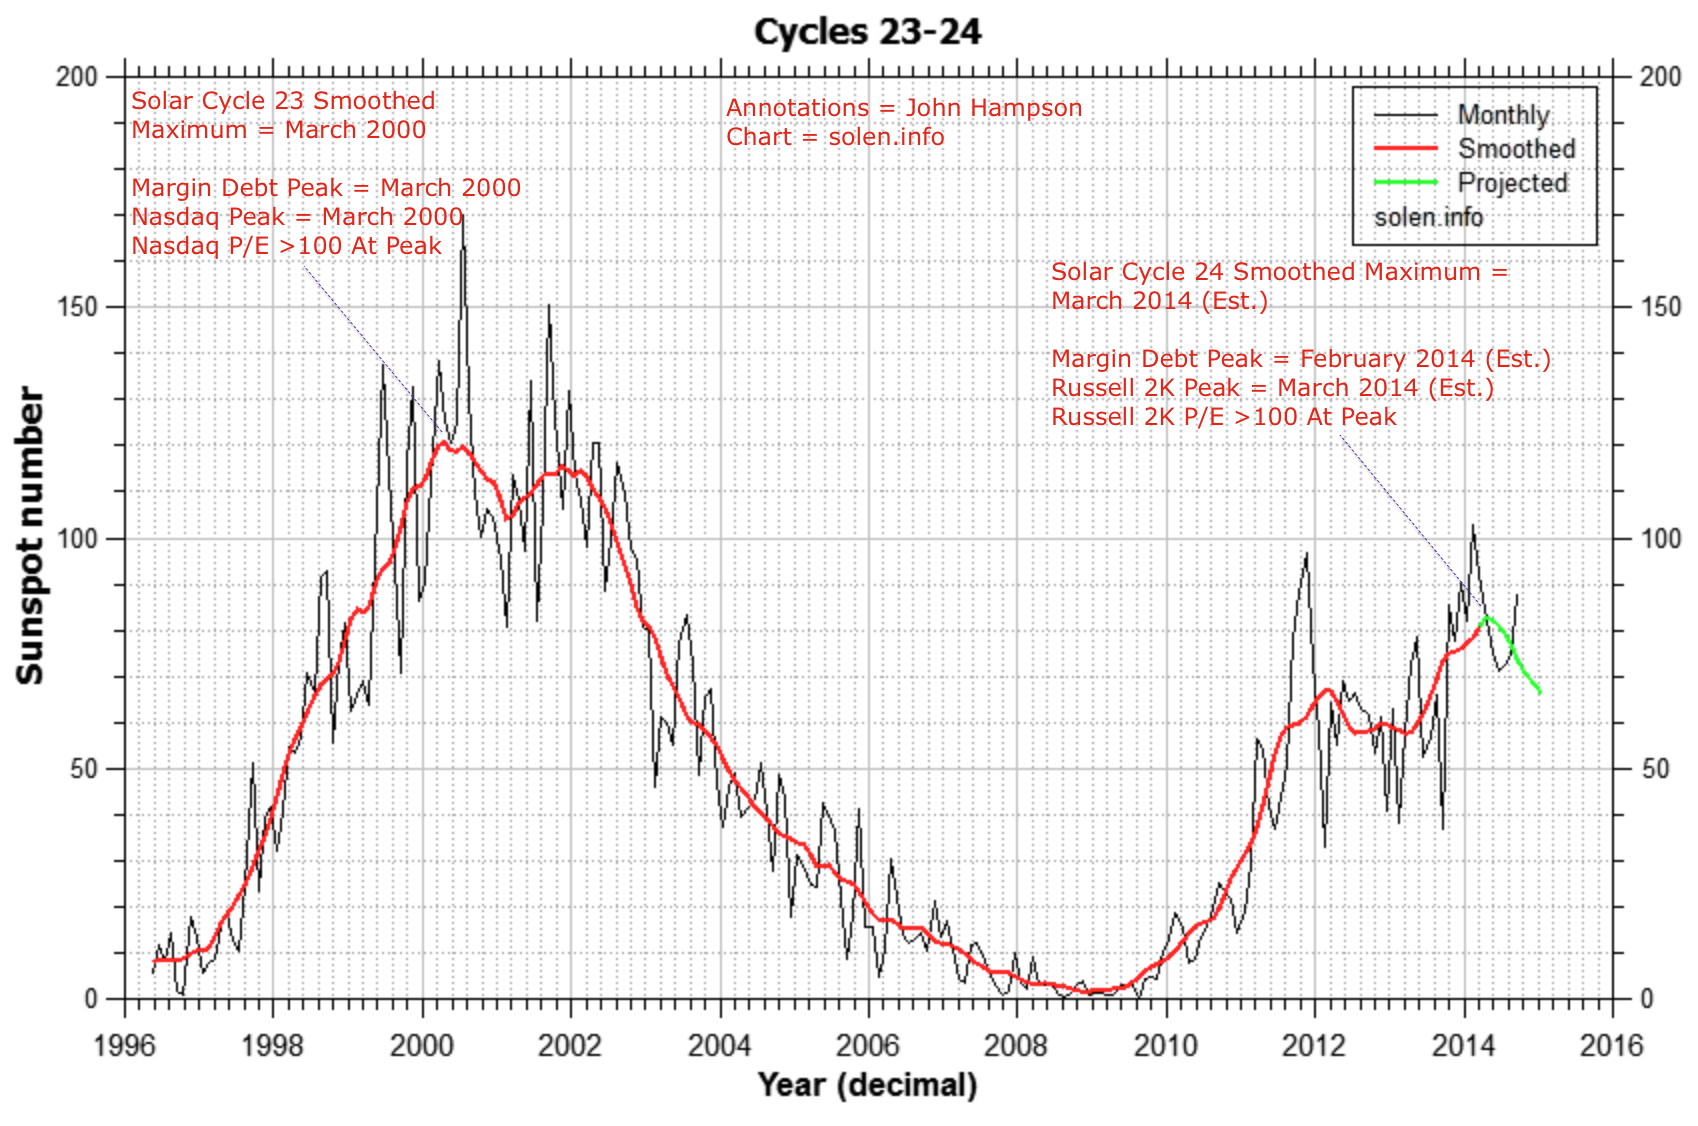
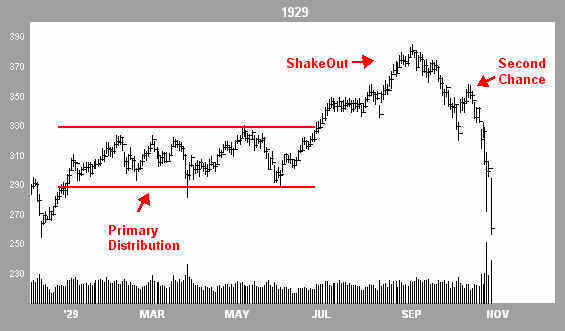
Here’s a reminder of historical analogs (manias of similar valuations, leverage, bullishness extremes, etc), and their common topping pattern:
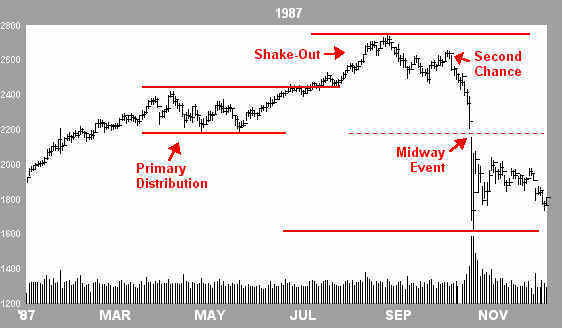
Source: Financial-Spread-Betting
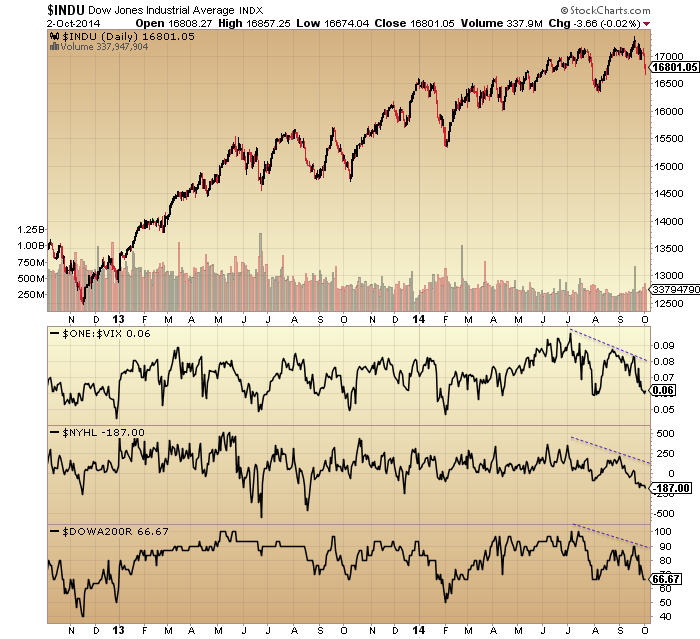
Here is the Dax in 2014, with a similar topping pattern:
 Source: Stockcharts
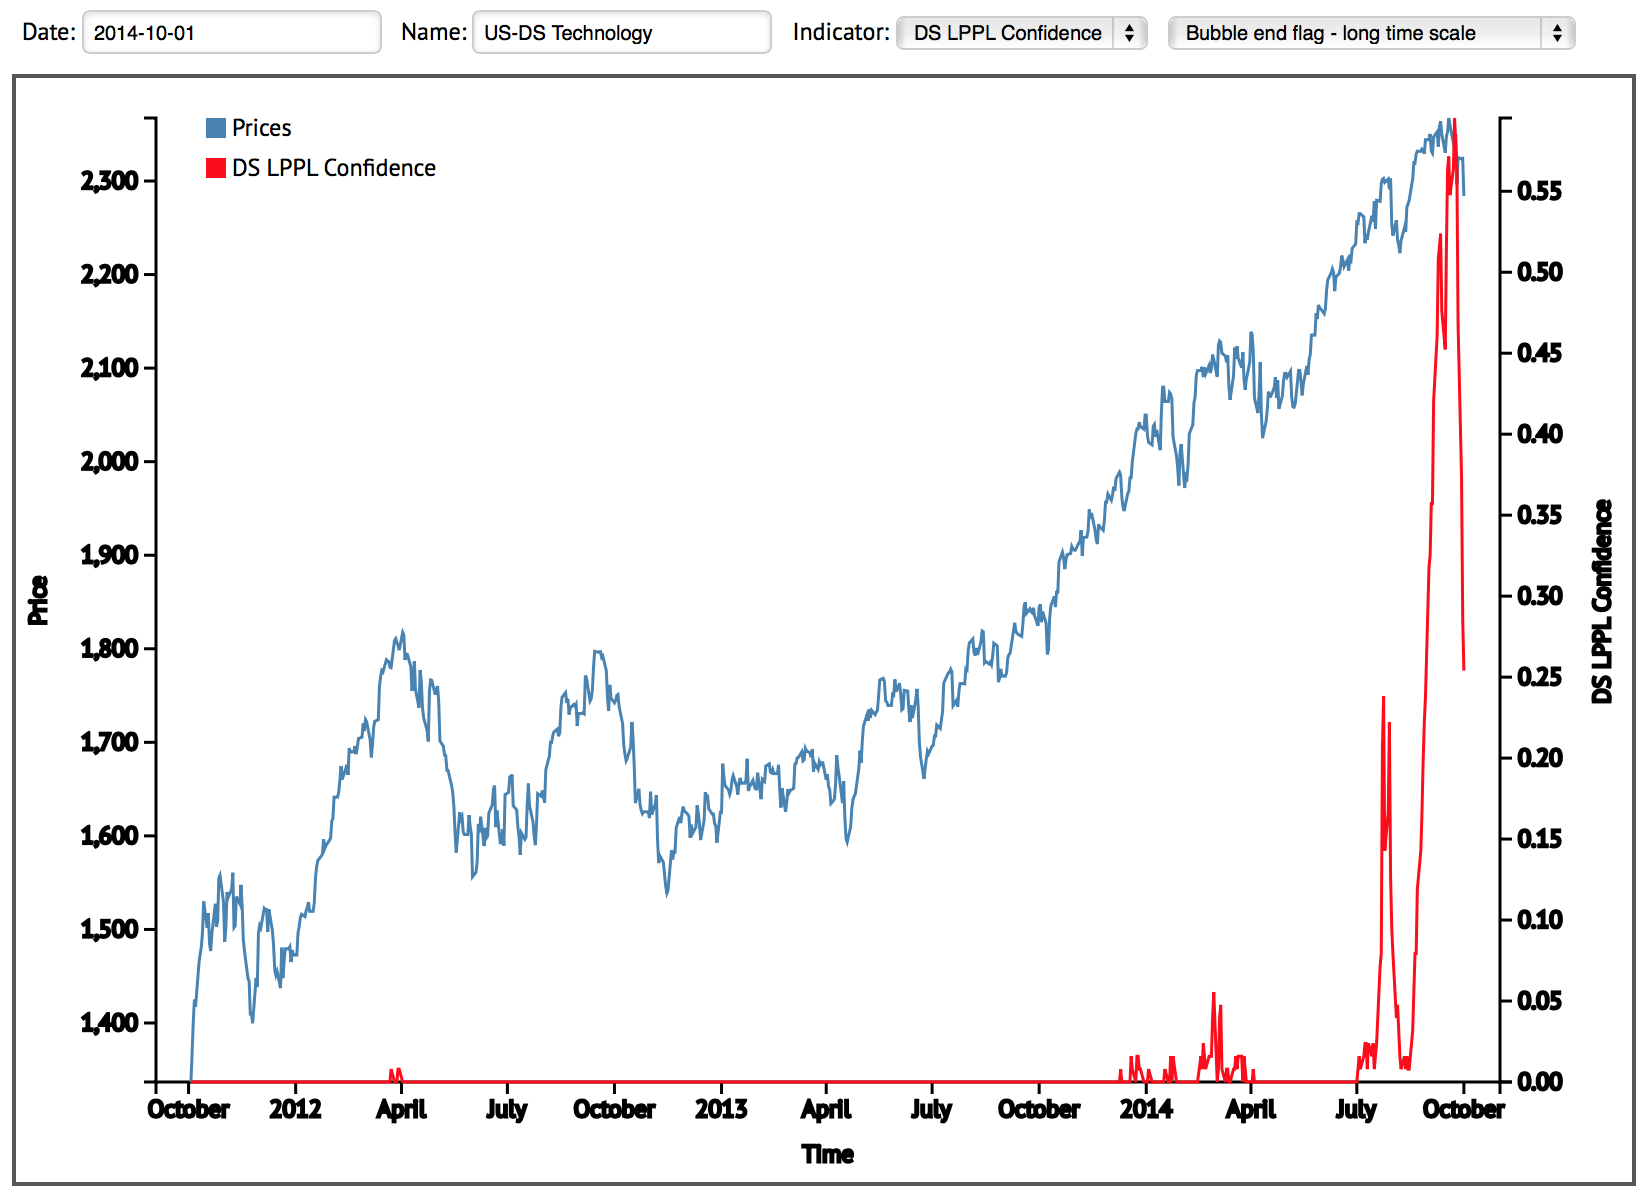
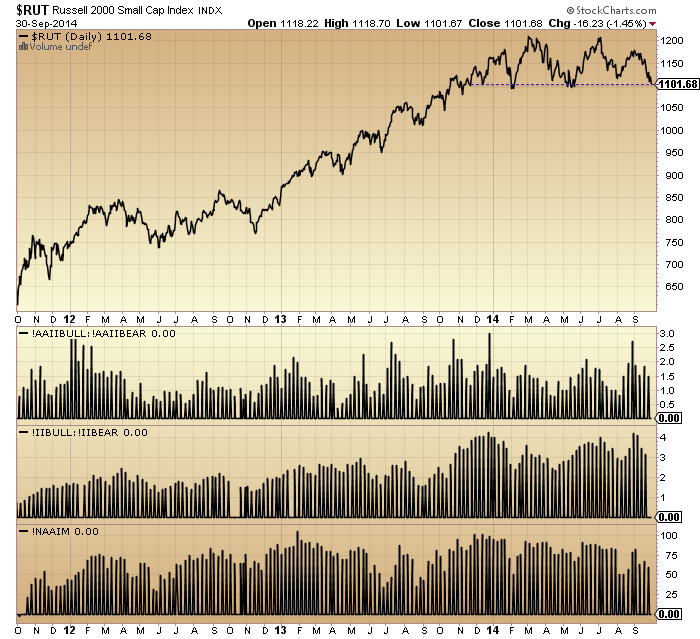
If we look at the Wilshire 5000, the broadest measure of US stocks, then these developments over the same timeline look like this:

The ‘second chance’ sticks out, being a higher high, so there’s the question mark.
That WLSH chart shows the importance of last week’s action. After 18 months of higher lows and levitation above the 200MA, we now have a lower low and a break of the moving average.
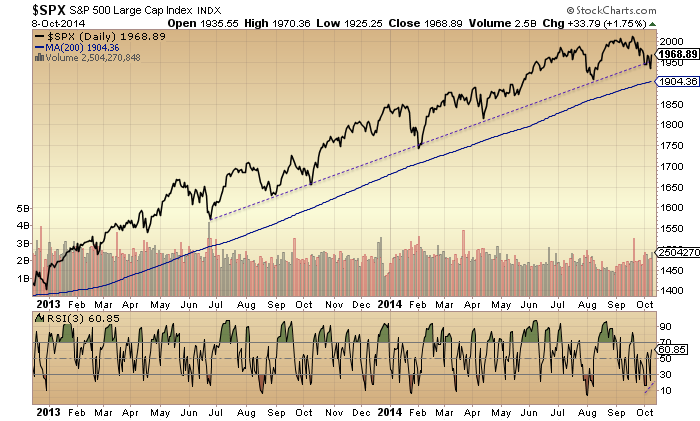
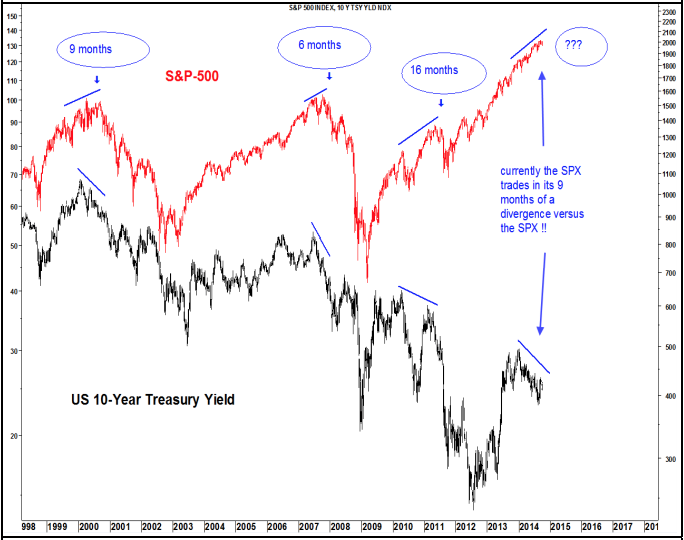
The SP500 ended Friday pretty much on the 200MA and at a double bottom with the August low, so hasn’t broken yet, but the leading action in RUT, DAX, FTSE and others, plus the selling into the close on Friday suggests the SP500 should follow suit and print the break and lower low.
Historically we have seen a phenomenon of strong selling into the close on a Friday bringing about major Monday sell-offs due to weekend stewing. The Nikkei chart above shows some examples. Meanwhile, the waterfall declines post-second-chance on the historical analogs occurred when a technical breakdown of a key level in price took place. Combined, they present the potential for this Monday, 13th Oct, to be a panic selling day, if buyers do not step in early and defend the SP500 $1900 support. So back to the question mark of whether we are post-second-chance.
I’ve shown before that various behind-the-scenes indicators suggest we are indeed post-second-chance, e.g. HYG:TLT, NAAIM, Investor Intelligence, Rydex and margin debt. So, despite US large caps having made higher nominal highs through to September, these indicators plus charts such as RUT and DAX suggest the September highs were rather a second chance peak. If so, then a quick look back up the page at the historical analogs show things rapidly fell apart after that point. Bears engulfed bulls in a steepening trend which snapped once key supports were broken and became several days of panic selling. It happened very fast. The steepening engulfing trend is what we saw in the markets last week, which adds weight to us being now on the cusp of the panic selling.
Therefore, if we are indeed post-second-chance and closed Friday under strong selling at the key twin support on the SP500 of $1900, then there really is a compelling set-up for Monday to be a major sell-off – a crash – should that support fail to hold from the outset, as weekend stewers press sell. So, all eyes on how the markets open overnight Sunday-Monday. If we do see the panic selling on Monday then the analogs suggest a rapid collapse could ensue over several days, taking us very swiftly to my targets. As a reminder I am looking for a minimum 18% off the peaks and large caps closed Friday about 6% down.
If, conversely, we are not post-second-chance on US large caps, and price needs to make a true lower nominal high, then we should instead see no panic selling and either the SP500 defended at $1900 or at a lower level, before being bid up again to perhaps make a ‘right shoulder’ beneath $2000. Whilst this may be considered the more likely option by many, I just reiterate that indicators and other indices instead position us post-second-chance, with the September higher nominal high in large caps being the ‘red-herring’.
Below is the longer term picture for the historical analogs. After the swift and devastating waterfall declines came a multi-month partial retrace of the falls, before the long bear market kicked in properly.
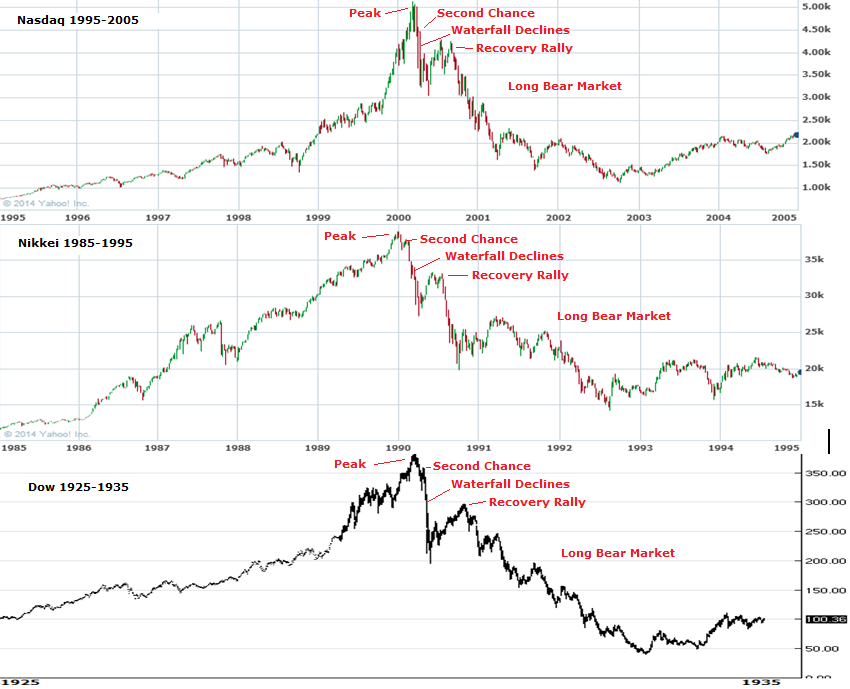
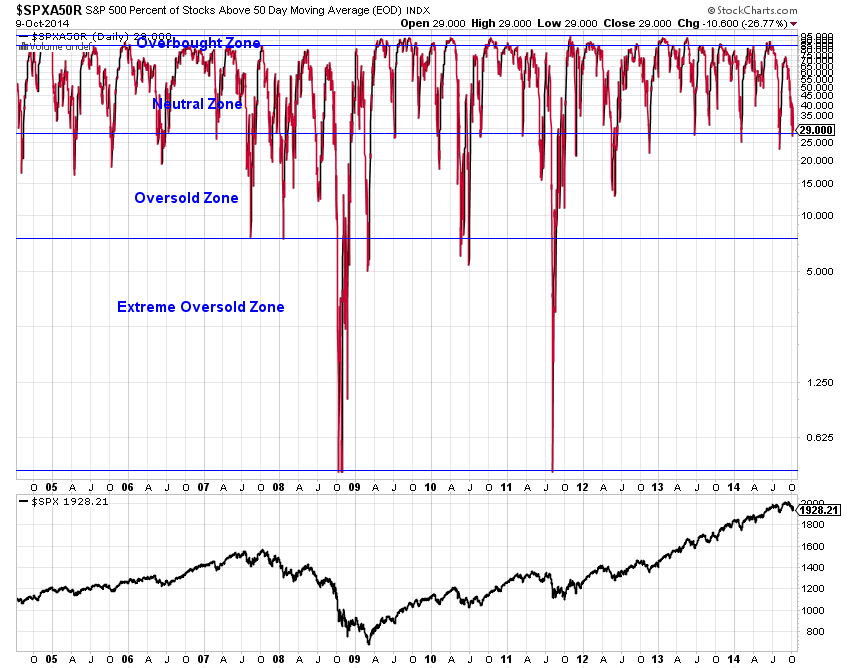
My aim is to try to exit my short trades after the waterfall declines and before that recovery rally erupts. To this end I will be looking to indicators for signs of exhaustion. At the end of Friday, capitulative breadth was still below 10 so the short term does not look washed out, whilst indicators such as stocks above 50MA show we would need to drop some way yet for a true correction:
Source: Charlie Bilello
Because we have levitated in a mania for so long, postponing any meaningful correction, I believe the correction has to be nasty when it hits. For example, with this intensity and duration of investors intelligence skewing can we really avoid a repair like 1987?:
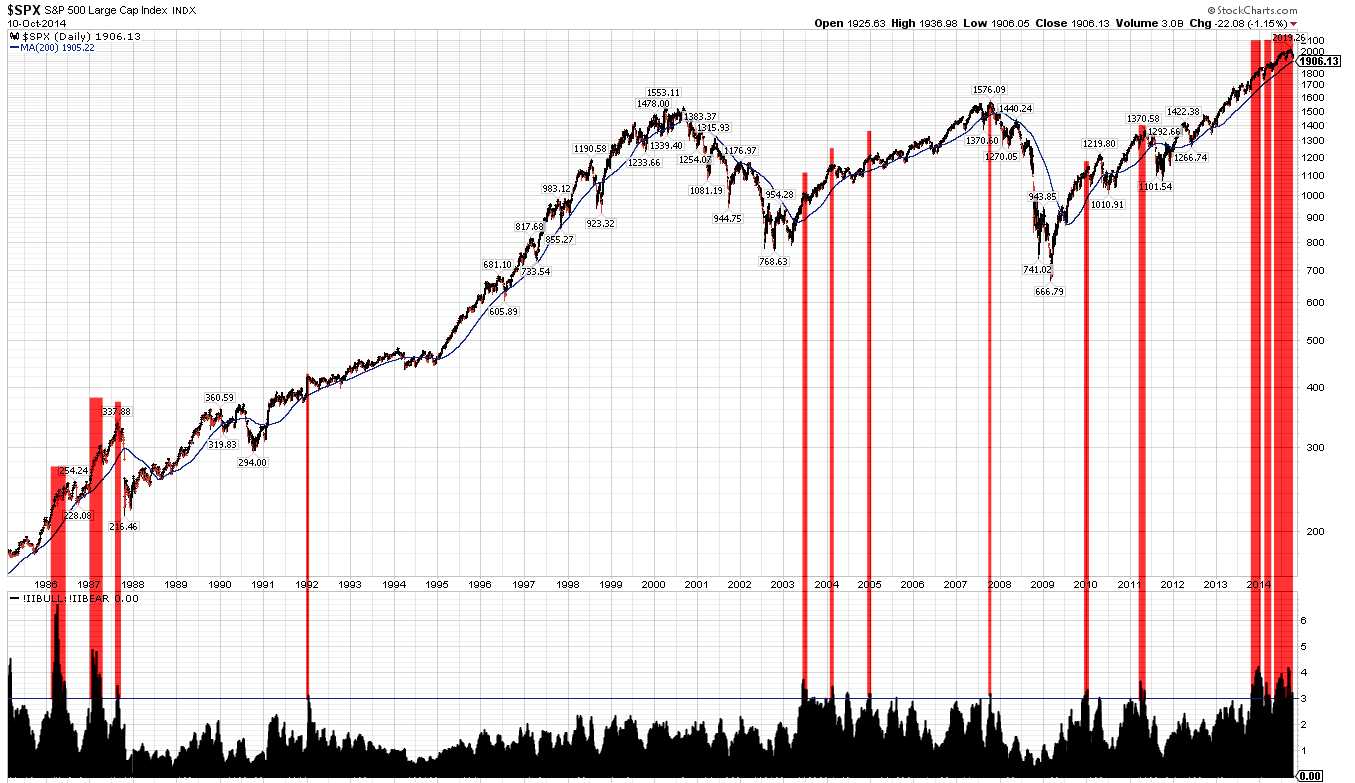 Source: Fat-Pitch
If we draw in the 1937 analog we see a less panicky decline post-second-chance over a more measured 8 weeks:
However, I believe the odds favour a more sudden collapse like the other historical analogs, because we can see in asset allocations, leverage, sentiment, volume and complacency that a limited group of buyers are all-in and leveraged with no bears left to convert, in an extremely lop-sided positioning historically. Therefore, if selling erupts it will be like an exit through a key hole and margin calls will quickly generate further selling in a series of forced redemptions.
Nonetheless, we can draw a range from the various analogs displayed of anything up to 8 weeks for the waterfall declines to complete, whilst the average falls were 30% with a minimum 18%. With this time and price guide in mind I am then looking to cross-reference with indicators that can signal exhaustion (e.g. CBI, II, stocks above MA, positive divergences, a volume surge etc) and see if we can pick the bottom before the recovery rally emerges. Important to get these parameters in perspective in case things occur very fast this coming week. If they don’t, then maybe the bulls can come back and generate a lower high in large caps. Anything more bullish than that now looks improbable, given the breakdowns in RUT, JNK and others.
So a big week ahead. Opex is usually positive, but this week’s proper kick-off of US earnings ought to be negative. If the panic selling erupts on Monday then neither will matter.