
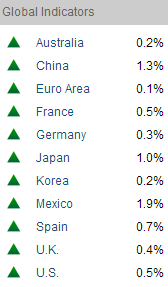
Starting with leading indicators, the latest Conference Board table is a sea of green:
 Source: Conference Board
Global money supply suggests a flattening out of industrial output in mid-year, but at good growth levels:
 Source: Moneymovesmarkets
US leading indicators remain positive:
 Source: Dshort/ECRI
In short, the global picture looking out on the horizon is good.
However, with coincident data, things look different. Economic surprises have tumbled of late:
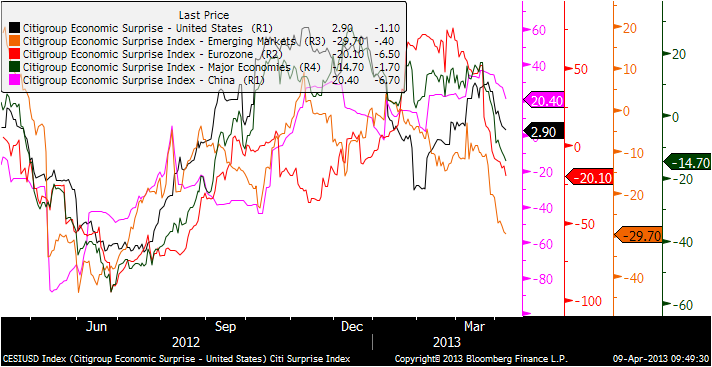 Source: Brokenmarkets
If we look at relations between the CCI commodities index, the MSCI World stock index and major economy economic surprises, then we see they generally move together, but typically economic surprises lead the turn:
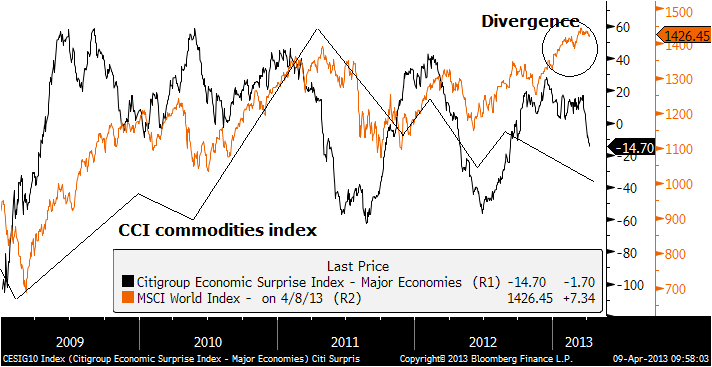 Underlying source: Brokenmarkets
What is notable is that equities have diverged over the last 6 months, whilst relative weakness in commodities has been more in line with the trend in economic surprises. It suggests equities may be overdue a correction.
If we aggregate 10 year treasury yields, Euro-USD, the CCI Commodities and MSCI World Equities indices, then the collective trend changes over the last 12 months appear like this:
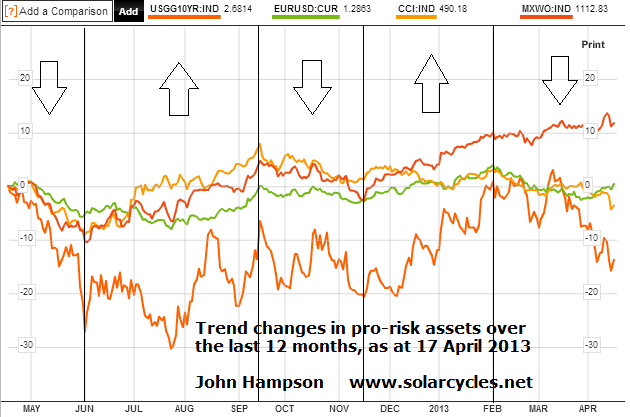 Source: Bloomberg
We see a notable downtrend in pro-risk since the start of February but with equities diverging. To be specific, it is the US and Japanese stock indices that have diverged, as we see corrections more clearly over the last couple of months in the Hang Seng, STI, Dax, FTSE. And a result of outperformance in US and Japanese stocks is more expensive valuations, with both now having p/es of around 17 (compared to the other country indices listed which are between 11 and 14 p/e). So are US and Japanese stocks due a period of underperformance, a belated correction? Or do the two biggest QE programmes in the world make for a difference that will endure until those policies are reigned in?
There is a potential topping pattern in the Dow Jones currently, as shown by the historical mirror below:
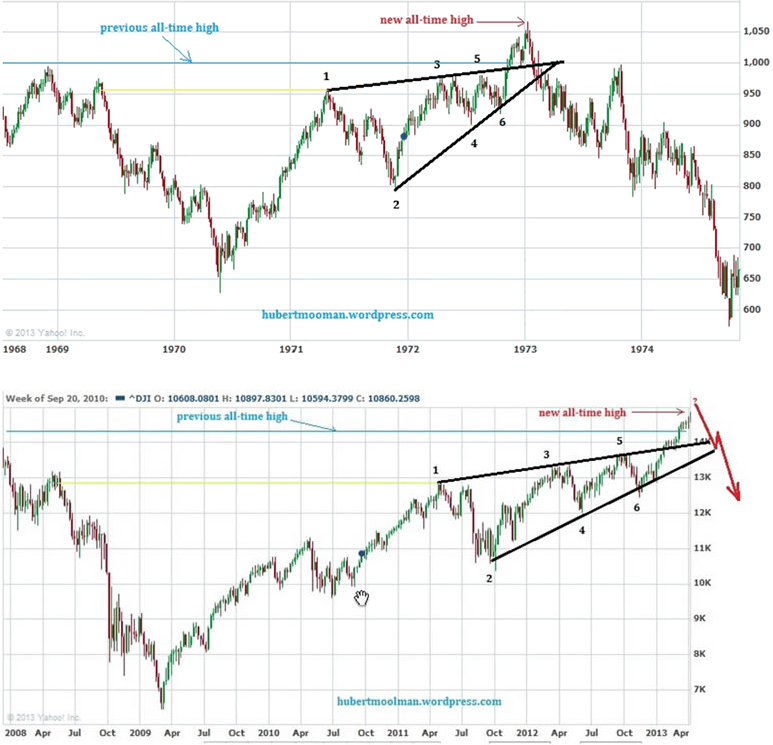 Source: HubertMoolman
The overthrow out of the wedge could be reversed. Monday’s action – when gold toppled 10% – added to the likelihood of this topping pattern. However, yesterday we saw a partial retrace. The trend in economic surprises suggests they are overdue a proper pullback, however on the flip side the geomagnetism trend has resumed upwards. If I remove lunar phasing and show the short term geomagnetic trend only versus the SP500 it looks like this:
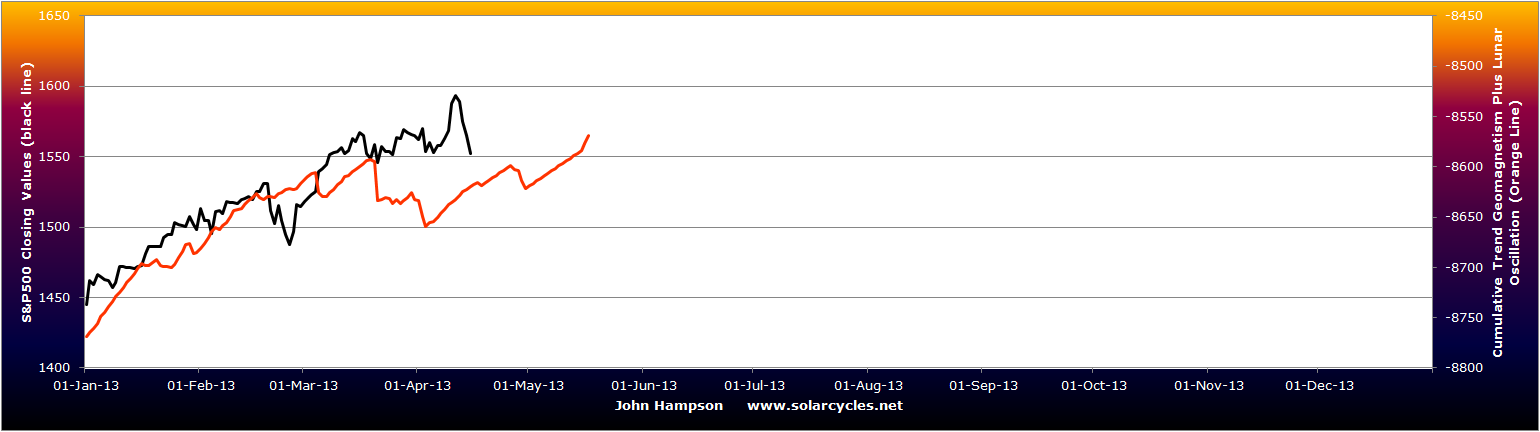
A correction has given way to a new uptrend which currently extends out to mid-May. This could imply that the pro-risk chart aggregate above is due a turn into a new uptrend, in line.
If equities were to make a proper pullback, then the question is whether commodities would outperform, as they historically tend to as late cyclicals. Below we see this occurring in both 2000 and 2008.
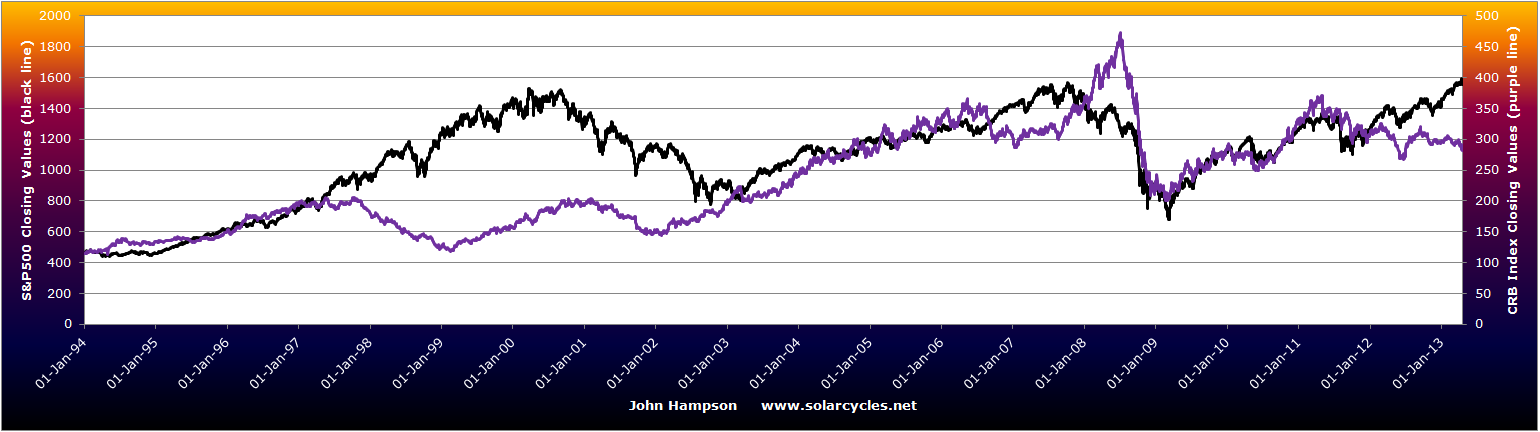 There is a distinct gap between stocks and commodities formed over the last 12 months. If there remains a secular bull in commodities, then we should see that close again and commodities to perform well despite a pullback in equities. On the other hand, if the secular bull in commodities is over, then we should see that divergence continue. The CCI commodities index remains tantalisingly in a triangle, as shown:
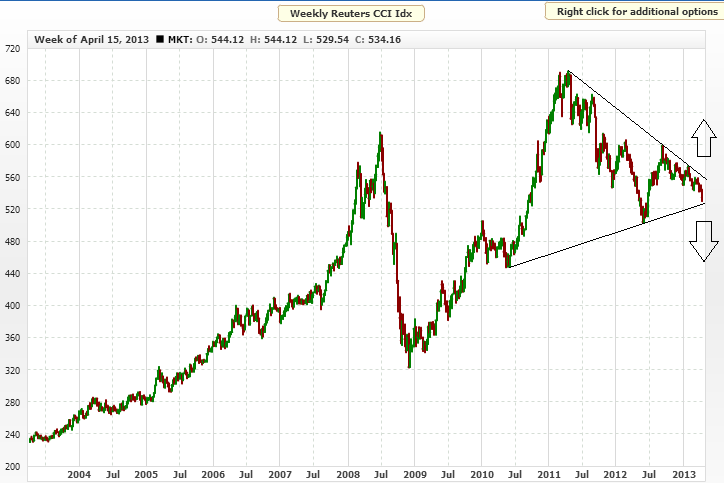 Source MRCI
The breakdown in precious metals has pulled it to the support line, which makes the next move in commodities the key.
So imagine commodities made their secular peak in 2011 and the sharp breakdown in gold is to be followed by general steep commodity falls that take the CCI into a breakdown. Resource stocks would get hit hard, and we would see a pullback in equities accordingly. Equities would fall, commodities would fall harder, treasuries would be a likely beneficiary. However, I can’t square this scenario with the positive picture in leading indicators. Unless we see a rapid deterioration in the general picture of growth ahead then I see it as more likely that commodities will hold up, and at worse continue to build out the triangle sideways. To add to this, from my recent post on money velocity, we see a potential bottoming out in progress in money velocity and treasury yields, that I suggest could have begun in 2012. We similarly see a potential bottoming out in UK gilt and Geman bund yields below, as of mid-2012:
 Source: Fxthoughts
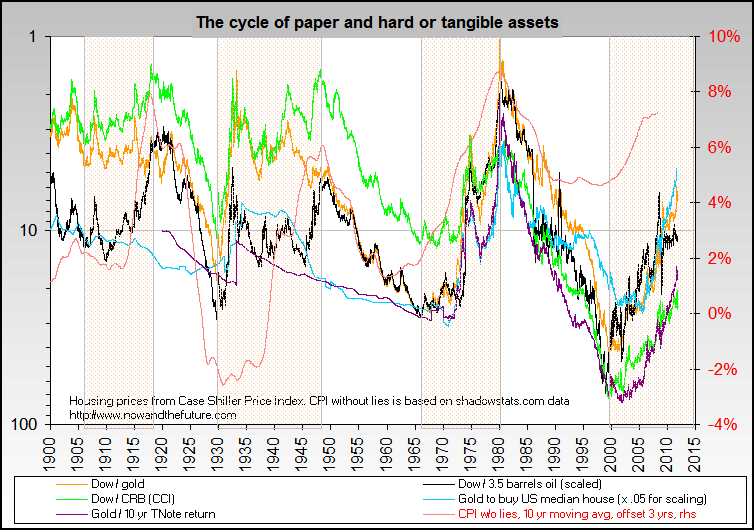
If the wall of parked money begins to circulate a little in the economy, based on a more entrenched picture of growth, then we ought to see a pick up in pro-risk asset inflation and a pick up in price inflation. So I continue to watch leading indicators for evidence that growth is becoming entrenched or for evidence that we are cycling down into danger again, to be met by another central bank response. Right now the evidence is for the former, and so I have my doubts that the commodities secular bull is quite over. Below we see the secular bull progression in commodities since around 2000, in terms of relative expensiveness versus other assets:
 Source: Nowandfutures
It is clear that there has been a large relative repricing of commodities in that period, but it is also clear by the various measures that we have not seen levels reached in the 10s, 40s or 70s. That said, we saw a much more extended repricing of equities into 2000. So my question would be: has the exponential rate of technological evolution brought about a change whereby we see future Dow-gold ratio tops and bottoms at ever higher levels (as human progress is captured in equities)? Or is this offset by increasing scarcity of commodities and increasing demand (more humans chasing fewer resources), which means the secular commodities bull still has work to be done to drag those ratios to normal historic levels?
Below we see the Dow-gold ratio and the author (not me) questions whether what we just saw in gold was the equivalent of a 1987 event for stocks, namely a crash that appeared to spell the end of the bull market in stocks and a breakout for gold, but was swiftly reversed.
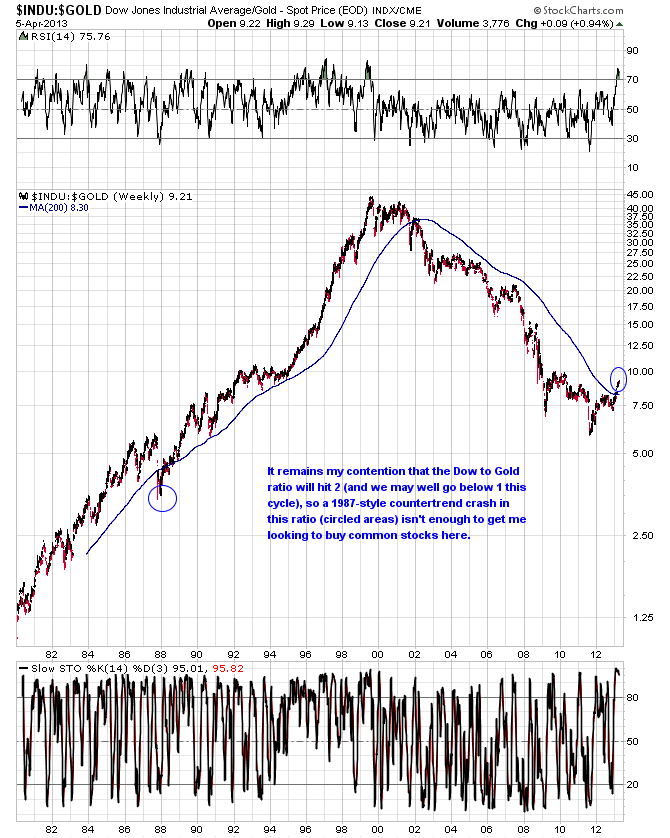
Source: Goldversuspaper
If that is so, then we should see buyers step back in on precious metals and retake the breakdown level of 1550 in due course.
A look at gold monthly in log scale shows the crash so far like this:
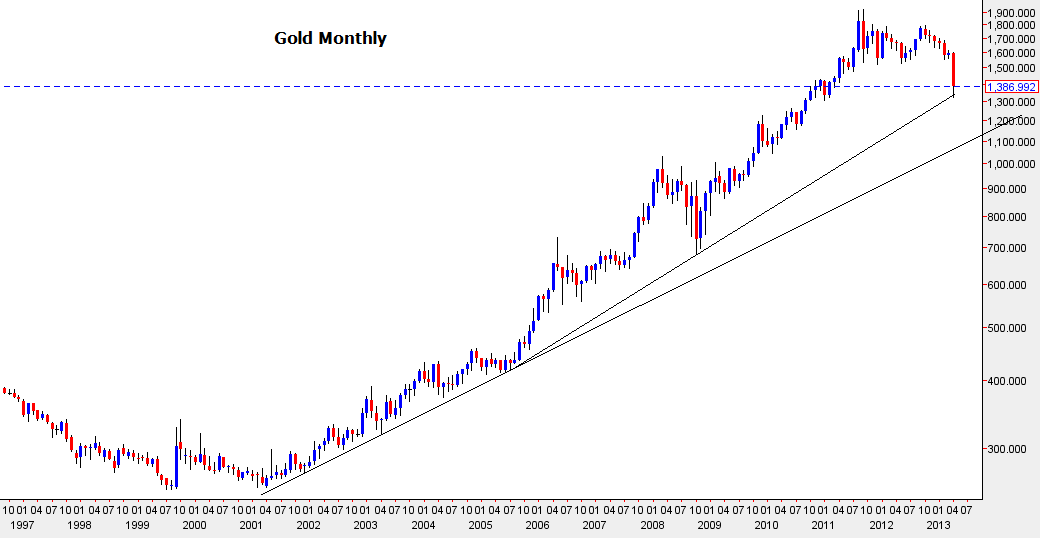
As things stand this is a correction that does not violate the secular bull market. UBS echo Chris Puplava’s view that the correction in gold will turn out the start of a new up phase:
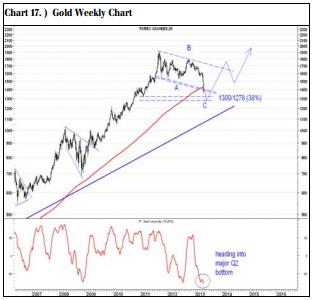 Source: UBS
And a reminder of real yields globally is still a positive environment for gold:
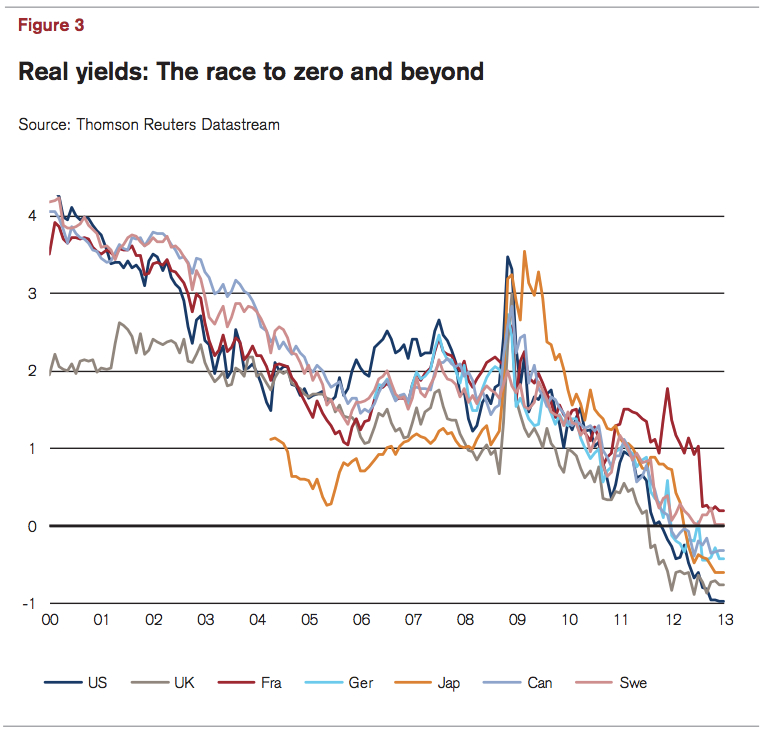
However, I maintain the picture for gold – and commodities – is very much in the balance. As you know I can write a broad-based case for commodities having peaked in 2011, aligned with a sunspot maximum in 2012, as well as a broad-based case for the secular commodities peak being ahead, in line with a sunspot maximum in late 2013. The breakdown in gold adds weight to the former. Piece by piece we will see the clear winner, and right now I look to see if buyers step in on gold to reveal a weak-hand shake-out whilst retaining its log support and whether commodities attract interest here to prevent a CCI breakdown. Sunspots have picked up, but not to new highs, and so it remains in the balance as to whether the solar maximum was in Feb 2012 or is ahead.
If gold did make its secular peak in 2011, then we could point to similar technical shaping at the end of the last secular bull:
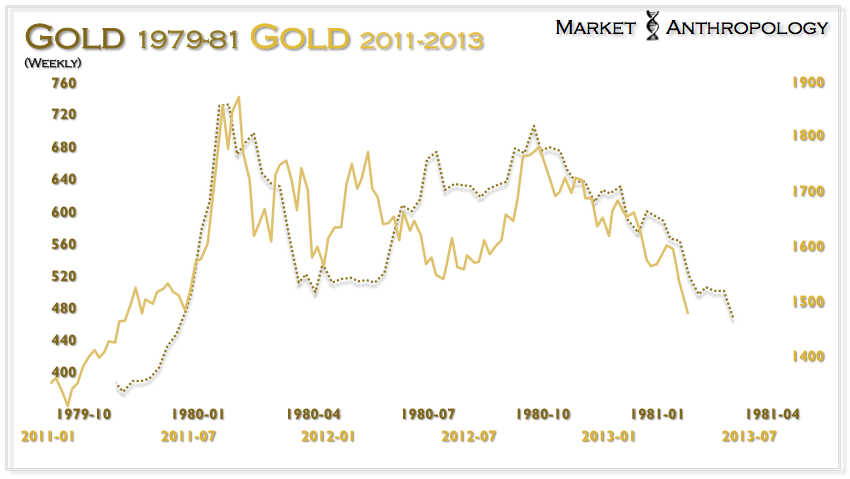 Since that chart was produced, gold dropped to a low of 1320, which would be equivalent to around 350 in 1981. Looking at what happened next in the 1980s, gold was then not far off a bounce, which retraced half the falls before failing again.
 In summary, I still think it remains in the balance as to whether the secular bull market in commodities and gold is still in play and has one final (biggest) leg up still to come. Since selling my stock indices longs, my positions consist of short treasuries, long multiple commodities, and long gold, silver and gold miners. I doubled up on these last three into the sharp falls. My exposure is significant, and it is going to get expensive if the secular bull market is over and more falls are ahead. However, if this was the last correction before a bull market finale, then those positions would conversely turn out highly profitable. It’s a risky business, but I am leaning towards staying put and watching developments for further clues, rather than lightening up.

Interesting article on Oil and Gold, on the subject of overpricing http://www.marketoracle.co.uk/Article39981.html
Oil could be overpriced by as much as 25%, whilst Gold production costs, as estimated by Barrick are $1050 per ounce, so Gold is about another 25% overpriced, it would seem. If Gold and Oil were to fall back to these levels, it will probably be a more gradual, grinding downwards movement, extended over many months and years.
The implications of a falling Oil price, as I mentioned in the brilliant Russia post you did, are that Russia, as a petro-economy, would see the Ruble lose value and the country would risk entering a recession, given the fragile state of growth it’s been experiencing since 2010.
Thanks Pete. I read that earlier.
Gradual grinding downwards over a long period would be the definition of a secular bear.
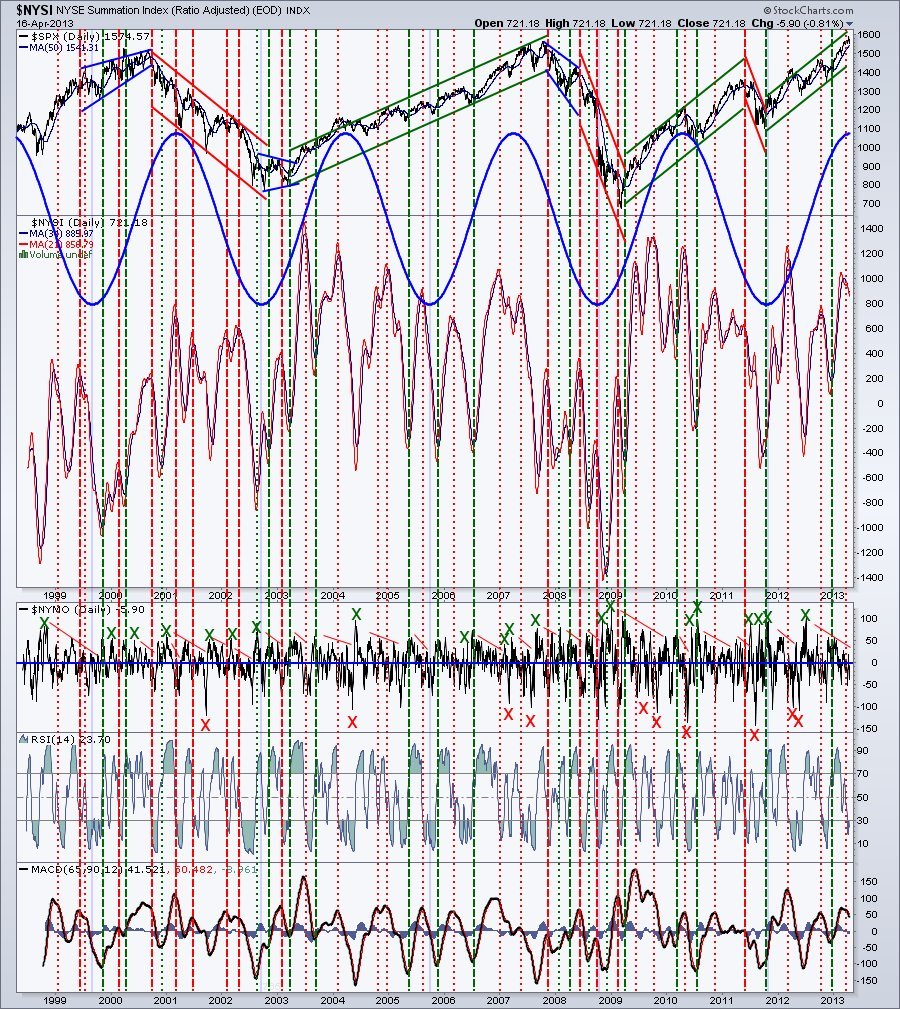
Breadth, as measured by the summation index, has been declining since Feb:
http://stockcharts.com/freecharts/McSumNYSE.html
So versus US stocks we have 3 divergences over the last couple of months: economic surprises, performance in other pro-risk assets, and internal breadth.
Have opened a short on the Dow Jones. The lunar negative period began at the weekend and lasts until the 28th.
Congratulation on your timing on the Dow Jones.
CT
Thanks
Sneak preview of a NYSI chart for you. No explanations, yet – surely you and your readers will not need them. Will do a post on my blog with it, complete with explanations of course, when the time comes, ahem, when it gives a long term sell signal. 😉
Hi John
Both my ~6month cycle in solar wind and ~4month cycle in solar activity are bearish for markets into late May or June sometime.
Many markets topped early in this 6month cycle. Some as early as January-February, which means bearish left-translated cycles. Others more symmetrical with highs in March, while SPX (mostly defensive sectors) topped as late as April (bullish right translated).
I think the majority of markets are correct, while US and Japan are “wrong”. If so, it could be “crashy” for US, as they have divirged som much. Lets see… soon SPX must go below 50MA, and then it could get interesting 🙂
btw symmetrical and left-translated 6month cycles means that markets should go down to previous low (Nov-12), and probably lower
here is the 6month cycle since 2003 (Norwgian index shown). It failed only once, in 2006 (extended bullish wave). Also we had two collapsing cycles/waves in 2008 and 2011.

Many thanks Jan
Jan: Could you explain the thinking/background with solar wind? Much appreciated. God bless you
hi robert
send me an email on bigbud at broadpark.no and I will enlighten you some 🙂
Even though p/e ratios in many markets look reasonable to low, I always wonder what portion of these earnings has come straight out of the monthly QE sweepstakes.
Eventually it’s going to dawn on investors that earnings (and thus p/e) are going to look a lot less pretty somewhere down the road…
e.g. when QE turns over into QE: quantitative extraction.
As I wrote days before, my proyection for Gold is to see about 1.000-1.100$, -47% from the top in 2011, similar structure from 1975-76, retracement about 0,5 from the bottom in 2000 and in 1968-71.
After that, we could see new hihgs.
From 25-35 to 197 *8
From 250 to 1923 *8
From 103 to 873 *8
From +- 100-110 to —- *8
(Understanstanding 1923 is not a secular top. If it is, we are in a drop about -47%!!, similar from 1980 from 873 to 453$!!, but in that case it w be a rebound next to the top)
Summary: If we touch 1.000-1.100 area, I have the intention to buy.
Me too. Will be the time to buy physical bars and store in the basement =).
My scenario for the Us Economy is not Hiperinflationary Enviroment, just the opposite, if you see the CPI:
http://advisorperspectives.com/dshort/updates/CPI-Headline-and-Core.php
Or you regard the PPI we Us economy is heading to a deflacionary enviroment in mid-term:
http://advisorperspectives.com/dshort/updates/PPI-Headline-and-Core.php
In my case, as you know, I bet last year for a retracement about 0,618 from last top in the Dow Jones as the historic standard for the Dow Jones after a 100% from the bottom in the 9th year from the first peak (2000), in a 17 sideways-years-cycle, like 1966-83; 1906-23.
Nevertheless, as we see new highs in 2013, more than 2000, more than 2007, we see similar pattern in 1906-23, and in 19th Century (prospections) and always with a retracement about 0,76, a drop +-40%, or more.
In summary, I see the bottom in The Industrials in 9.000, even 8.000 points.
agree on deflation (gold is probably showing the way). Look at CPI YoY and find three waves since 2008 (QE1,2,3). And the latest wave from QE3 looks very weak. Could mean that FED is loosing the main (hidden) objective – fighting deflation…
If US CPI starts to trend downward and lead to deflation, the US will likely embark on a Abenomics-style QE package, or devalue the Dollar some other way to spur inflation. Due to the fiscal situation, it’s not likely there’ll be an inflationary fiscal stimulus until the debt ratio is low. However, as it stands, CPI is close to the trend and if that holds, there will be little pressure on the Fed to act.
The Fed will probably only raise rates under the following scenario:
1.) Unemployment is substantially lower (4.5%-6.5%)
2.) Inflation is substantially higher than the trend (4%-8%)
Raising rates at a time of high unemployment would have very messy consequences for the US. ZIRP looks set to remain until both criteria have been met. They probably won’t be met until 2016-17 at the earliest.
QE 4 may be around the corner. CNBC had inflation hawk Bullard (typically against QE) now sounding ready to maintain that 2% inflation target.
John, you were looking for the “ah ha” – get ready. This guy has been hawkish unto QE for years. He supports it but reluctantly. All we need is for the equities to turn on sour news in June down rest of year.
http://economy.money.cnn.com/2013/04/17/the-feds-bullard-thinks-inflation-is-dangerously-low/?source=cnn_bin
Go to google news… search on bullard inflation for more.
We are in a deflationary spiral ahhem recession since last year and last solar peak? Stick in warm water overnight and watch it expand.
One thing to note, perhaps misunderstood in last post. QE traps money – the fed keeps paying itself in inflation protected bonds. The wall of money shall not cometh until they unwind. My posting yesterday to refer to the loss in years to come will all be fictious money provided the bonds are not sold off to others. M2 can decrease without a dent in credit and other interbank rates can be raised gradually to calmy deal with this. If we do get QE 4, I’d expect to see a delay in unwinding from 2017 to 2019 or even 2025.
The USA is different from Japan also, we keep letting in immigrants, our population will grow, this works in favor of fiat currency.
Also just so I am clear, I say bond, I am referring to mortgage backed securities owned by banks, transferred to fed, and cash in lieu is debited to a special account that financial company has with the fed. If anything this fees up other capital in financial companies balance sheets to become liquid. This is what drove up price of stocks thru 2011. Debt pay down and stock repurchase also led to increase. US GDP was only positive due to energy exports in 4Q 12. Expect same or worse in 1Q 13 and worse in 2Q 13. Guess we shall see if April 26th and 29th reveal up or down. I always find it fun to fold a bill of currency into 8ths and pass it around to 4 people. With each pass it gets unfolded once. My 6 yr old grasps it.
I liked this and also the chart Danny had out. It shows again that there is no trend =). On daily GLD looks like a train reck but on monthly we are still in an uptrend.
I do not believe in those inflation numbers. The definition of inflation changes all the time to fit politicians. Visit shadowstats to see GDP and inflation numbers. In Sweden interest rates are included in CPI but interest rates are supposed to be used to curb inflation. Maybe I am stupid but the feedback look mathematically I do not understand. Maybe someone here can explain. 😉
If the inflation rate that ShadowStats present was the true inflation rate, then the GDP Deflator would have to be revised up, and as a result, you’d get GDP figures that are ridiculously negative. It’d give the impression that GDP’s been slumping for years and years. The website Dshort has a constant criticism of the ShadowStats inflation rate.
What might be true is that inflation is slightly higher than what we’re given, but a lot of surveys conclude that the official stats the Fed and the ONS provide us are actually close to what is really going on. It’s all about the weighting of various goods and services. Some things have much less of an impact on CPI than they used to. This is because CPI reflects the average change in prices of a rotating basket of consumables. Items in the basket are updated, removed or replaced with more contemporary items that you’d expect the average consumer to buy.
Like residential units you mean? They tend to be included as a contemporary piece. I mean it is probably the largest expense most people have in their lives. But why then is it not included. 😉
If those numbers worked then every economist would be rich but most economist can not pay their way out of a paperbag. What they do know is to borrow money and spend other people’s money.
There is nothing such as “the economy”. It is just a social construct that has nothing to do with the financial markets.
I always take shadowstats inflation rate to be the perceived psychological pain rate. Ergo its a good indicator of purchasing power and demand-pull inflation. Folks like to always talk about inflation without saying which type. CPI is actually fairly accurate to Google’s inflation algorithm but both in my opinion are cost-push inflation.
http://www.netplaces.com/economics/inflation/types-of-inflation.htm
CPI doesn’t take housing costs into account, but the UK’s RPI does, so you could say UK RPI reflects the burden on UK consumers a bit more. So in answer to your question, UK inflation does actually take residential costs into account.
I mean asset price inflation – does it take into account the price of flats in London etc?
Ref the tantalizing triangle of the CCI. There are so many triangles all over the web (almost always supporting a bullish case), which I do not consider a triangle, I got out my very old Edwards and McGee. Well, you can call anything you want a triangle. But I think a triangle should all be contained within the same elliott wave degree. The one you show, looks like a clear downtrend of one degree and just convenient line between two lows. Otherwise, every time a bear market hits a ma or trendline, you have a triangle.
The grains still hold out a small hope of a parabolic run, and some softs like cocoa and coffee haven’t doubled old highs. These plus bear rallies of others still hold out hope of a triple top in commodities, but this sure looks like a breakdown, not a final washout prior to the final run.
Kudos to you Kent for laying out on here a year ago what has thus far transpired with commodities.
Thanks, John
Great stuff on solar wind Jan: Forget hyperinflation and deflation talk just follow price. It is just something an economist made up. In theory the Fed could print money and buy shares outright like John Law did. I am sure “inflation” would go up then. Those funnymentals just screws with your head. Sorry for the way I am ;). But I hate fundamentals. I have this sign above my trading desk that says:
FUNNYMENTALS KILLS. It has taken me years to get rid of the brainwashing ;).
very true Robert 🙂 Focus is cycle lows in May-June, and let price tell us overall picture…
Opened a long on ETC Copper at 33. Daily sentiment index for copper down to 7 and down another 3% today.
Added to Market vectors gold miners ETF at 2905
and again at 2875. No more now, I’m full.
are you taking long-pos here John? My work says longs are forbidden into mid-May, except some 1-2 rebounce-scalping…
And there is also a higher than normal crash-possibility, which means a ~5% drop in few days is possible (SPX) 🙂
Long commodities, long miners, short Dow
we are at one of those great moments in markets where across the markets we are within a percentage point of make or break…the downside target in AAPL since the top using the tools i use has been 396-398…. will be watching carefully
Amazing 91 percent correlation between 1952 S&P and current S&P that even mirrored the plunge on Monday. I.m wondering if correlation has something to do with the 60 year cycle. If correlation holds then expect S&P low around May 1 then peak around Aug 11 before plunging to around Oct 22.
http://www.mrci.com/special/dspi52.php
John, great work as always. The log scale chart of gold helps keep things in perspective. In their most recent post, Market Anthropology had a couple of other charts in their Value Trap series suggesting that gold has more to go on the downside though (their work of course). http://www.marketanthropology.com/2013/04/relatively-speaking.htm Interesting work they do.
I also like your Dow Jones historical mirror. Greg Schnell of the Market Technicians Association did a great video back in January covering 80 year’s worth of similar mirrors on the S&P 500. I did a post back in the beginning of March reminding readers of that video. http://www.highrevsopenhouse.blogspot.com.es/2013/03/a-friendly-reminder.html All those fractals were followed by corrections, some huge, with the average coming in at about a 33% decline.
Finally, I just did a special mid-week post covering today’s price action in Europe. Critical support is being seriously challenged. For everyone’s reading pleasure, and hopefully something of more tangible value as well, you can find that here: http://www.highrevsopenhouse.blogspot.com/2013/04/europe-following-gold-already.html
BTW, I’m looking for a short term cycle low sometime soon. 😉
Thanks
Video shows Charles Nenner’s gold chart vs actual gold price since 2001. Nenner’s chart appears to indicate a gold low around May 1, 2013 then a rise to December 2014. In the chart notice the steepness in the rise from May 2013 to December 2014 in comparison to previous rises in gold since 2001 indicated by Nenner’s chart. The steepness in the rise may go along with John’s predicted blow off top. However, Nenner is cautious in the video.
http://finance.yahoo.com/blogs/breakout/still-too-soon-buy-gold-nenner-164824040.html#more-24362
The red line is what?
Red line is Nenner’s gold future projections based on his cyce work. Nenner newsletters have his projection line at bottom of chart and whatever market he is observing at the top of the chart. If you compare his past projection line at the bottom of chart with what actually occurred in the market at the top of the chart you may get an indication of the accuracy of his projections.
Interesting, thanks for that. He also calls a bottom soon in crude around 85.
Isn’t HUI crashing here signalling the end of the bull market? How can something crash from 625 to 250 and still be in a bull market?
250 might not even be the bottom….Looks like this thing can go to single digits….
A fair point. I’d say the bull market is in commodities rather than commodity-related shares. So the CCI arguably gives the best picture.
John, Looking at gold long term and the US dollar backing GDP. http://pricedingold.com/us-gdp/ Still within the trend. Any thoughts?
Interesting thanks. Like other gold relative charts, it has reached low enough to call a secular switch – or – it has not yet reached previous extremes, depending on your viewpoint.