
I maintain the late 1940s is our closest historical mirror, as per this chart:
Then, as now, they had a problem with money velocity. But it reversed course and took off as of 1946.
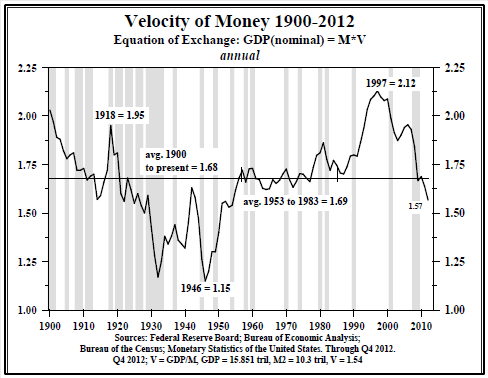
Source: Hoisington
Yields also reversed course as of 1946.

 Source: Milton Friedman
As per my last post on money velocity, there is a historical relationship between the two. Here we see it clearly:
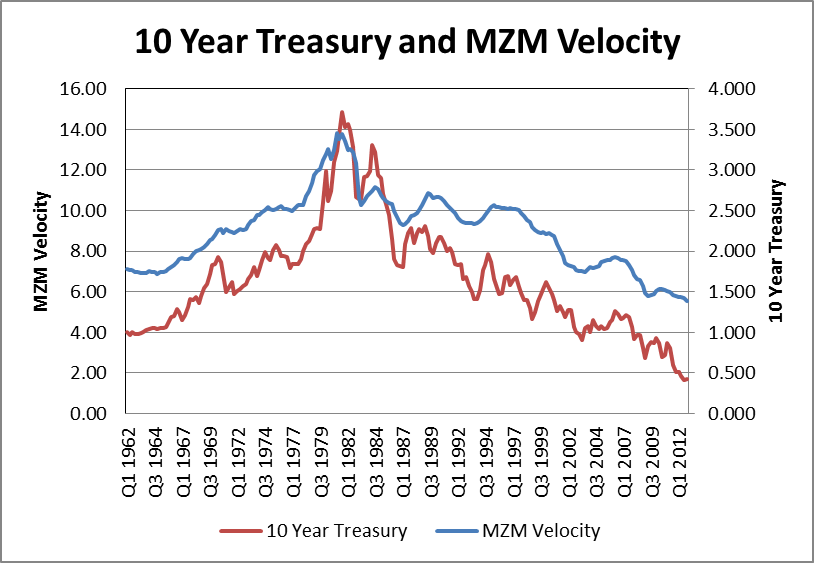 Source: BNVInsight
Essentially, expectations of rates, inflation and growth determine the path of yields and velocity. In 1945, like now, there were very low expectations in these three areas due to excessive post-war government debt, government controls and growth that would not stick. But then in 1946 yields and velocity began to increase and inflation took off and peaked in 1947. The picture changed.
In my recent post on money velocity I showed a selection of charts that show a current potential bottoming out of both velocity and yields, though only tentative at this stage. If this is the case, then we could also be set to see inflation take off and potentially reach a peak within a year in line with the historical mirror. If the solar peak is ahead later in 2013, this is a very good fit with 1947 which was also a solar maximum.
Here are 5 year treasury yields versus core inflation (excludes food and energy). We can see yields are overdue a catch up. Money is parked in bonds paying a negative real return. The divergence captures a lag in belief and sentiment that is overdue a reversal.

Source: Scott Grannis
Yes the Fed is manipulating this market, but it is not the difference since 2011 – it was doing this before. Rather it is the mired perception of unsustainable growth. However, since mid-2012 we have seen a sustained positive picture in leading indicators that still persists at the time of writing. Unless leading indicators turn down again sharply soon, then I give good odds to a belated change in perception, a belief in growth, that should generate an upturn in yields, velocity and inflation.
What would that mean for commodities and stocks? Using the late 1940s historical mirror, we can see that commodities were the beneficiary, with corn and copper charted here:


Both accelerated as of the turn up in yields and velocity of 1946, and had made the bulk of their parabolic rises within a year. Oats and wheat performed similarly, crude oil escalated in price by 50% from 1946 to 1947, and the CCI index as a whole made its peak by late 1947.
If we turn to the Dow-gold ratio, we can see that by 1947 the ratio was already in an uptrend, because stocks had been on a tear, much like now.

Source: Macrotrends
Here is the Dow Jones chart from the period in question:
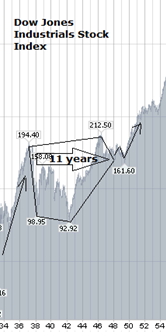 Source: Stockcharts
Stocks rose fairly steeply into a 1946 peak. That stocks perform well in an environment of low rates and low growth was in evidence then, as it has been into 2013. In 1946 stocks made a pullback and then traded sideways, before the secular stocks bull momentum ‘go’ point as of 1949. So whilst stocks consolidated around 1947, commodities esclatated.
But let’s not get too carried away with the historical rhyme. Back in 1946 in the US, price controls, that had been implemented during the world war, were lifted, which along with weather-related bad harvests, helped drive up commodity prices. There are no such price controls today. The government also abolished the buying rate it had set for treasury bills, which helped free yields. In short, the government took several measures at the time to reduce its controls over the economy. Clearly there is a chime with today: the US government has supressed yields and taken controls over the economy in terms of ZIRP and QE and other policy actions. What we do not yet see is the relinquishing of such controls. However, if the US government were to announce it was stepping back from QE or eyeing an end to zero interest rates in the future, then this could have the same effect as in 1946 of yields rising, which would be accompanied by velocity, and inflation could then logically follow. Perhaps then an end to QE would not be a nail in the coffin for gold, but the opposite.
What 1946/7 and 2012/13 do have in common is the solar maximum. If you subscribe to the theory that sunspots drive human excitement and this manifests itself as speculation, buying and inflation, then we have another angle. This alone should encourage money velocity, bullish policy actions, and drive money into pro-risk.
Now if you don’t buy into the solar idea, or maybe the solar maximum passed already in Feb 2012, and you don’t buy into the historical correlation with the late 1940s either, the we nonetheless still have an unsustainable situation of negative real rates and yields, and money supply and velocity at opposite historical extremes. Unless the system is broken, then at some point growth is going to stick and accelerate, and these extremes will mean revert. Is it broken? Is the US the new Japan? Unable going forward to get growth and inflation to entrench? As it is by far the largest contributor to world GDP, this would be felt globally for some time. Well, the US was keen to avoid Japan’s errors, i.e. being slow to react to deflation until it was set in. It was aggressive in response to the 2008 crisis. We also have an exponential trend in technological evolution, which at an even faster rate of paradigm shifts going forward, should be the fuel for a new secular stocks bull. The US remains a world leader in technology. Plus, through natural gas disoveries and shale oil the US has its own ample energy resources again to power growth, which Japan lacked. So time will tell, but there are reasons to believe that the US can make a normal transition into a new K-spring, and so likewise the global economy.
I suggest the natural cleansing cycle, a regular secular bear, a K-winter, has worked through within normal parameters, and we are in the realm of a secular transition. Unless you do believe the system / the US is broken, then a new cycle of growth should be emerging, and yields and velocity should be undergoing a reversal. As that occurs, it would be normal to see the fresh circulating of the parked money bring about inflation, and for commodities to enjoy another leg up. If you draw in solar cycles (assuming the solar max is ahead not behind) and the 1946/7 historical mirror to this, then the prediction is refined further: we should see stocks pull back and give way to commodities outperforming, for yields and velocity and inflaton to rise up, all around now. The Dow-gold ratio having bottomed should not be the death knell for gold, but instead reflects the environment being positive for equities as it was into 1946, and such a pullback on equities (as occurred then) would be a buying opportunity for a forthcoming momentum ‘go’ point in stocks.
In the worst case scenario, the current status quo would persist for some years longer. Yields and rates and velocity would remain trapped at ultra low levels as sustained, entrenched growth remains elusive. Therefore, I continue to watch leading indicators closely. I believe that if they can remain positive and healthy into mid-2013 then we would have a long enough run behind us to change perception, and this should inspire the moves I am imagining.

Really well done, John. Thanks.
Thanks Gary
Interesting stuff. Here is a good one that I also posted on my wall together with Funny Mentals: http://stocksonwallstreet.net/wp-content/uploads/2012/05/ptj_2.jpg
You not a fan of averaging down then Robert? It’s as valid a tactic as any other. Averaging up on shorts a little more dangerous.
Not a fan but I agree it is valid. Prem Watsa “specifically states that the worst mistake an investor can make is not to average down”. But I prefer not to go there although it happens from time to time. It is a martingale strategy mathematically so you need to have cash ready of course and a limit so that you do not blow up or your mind gets haywire into rage trading. Calculated doubling down I like to call and adverse excursion trade. There is probably a nice mathematical graph you can do where doubling down becomes lethal ;).
And where it becomes genius 😉
http://en.wikipedia.org/wiki/Martingale_(betting_system)
http://en.wikipedia.org/wiki/Taleb_distribution
What is even more interesting than cycles in trading is this i.e. martingale or anti-martingale, pyramid, optimum f, smooth ratio etc. Money management. There is a lot of math out there and I spend countless hours thinking about it. I do not think the math that is used is necessarily correct in financial markets as compared to betting. It is more important than weather you think GDP is up/down or an elephant.
In essence my view is the all math aside is the following. Not rocket science but:
The closer to the bottom i.e. the closer to the reversal the safer and more acceptable it is to average down. The close to the stars the more dangerous. The problem is that the bottom may not hold even when it seems so close to the bottom/reversal. So I prefer not and only use it as a backup and pray every time. Most of the time just to get myself out of the position and start fresh.
There is nothing better than a fresh start. Losers average losers is a good starting point to keep on the desk – it kicks you in the stomach each day.
Not all “averaging down” is equal. Many funds and seasoned investors use “scaling in” when they build up a position near a perceived bottom. So they decide the size of the position they want to obtain, then they buy one third @ $120, the next third when the price hits $110 and the final third if the price falls to $100. So it is planned that way.
Other investors buy a full position at a price they perceive as low. But it goes on falling and they buy another full position, “averaging down”, and then maybe a third position if it falls even further. By then they have three times the position size they would normally take, and are praying for a quick rebound, so that they can unload their excess stock at their breakeven price.
This latter variation is known as “doubling down” or “fighting the tape”. It will “work” sometimes, but it also known to be a method that leads to outsized losses.
If you use leverage do not double down or be very vigilant – seasoned or not.
The smallest loser is the biggest winner in a losing gaming such as trading.
As it happens I backtested a version of the martingale on the lunar edge trades – i.e. buying for each lunar positive period and adding leverage the next time if it was a loss. Perhaps unsurprisingly, like using it in a casino, there were just a couple of runs that stretched it to beyond palatable leverage. And you just never know when that run is going to strike.
If you trail your stops in the right way the martingale may work – it is difficult to backtest as it requires you to trail your stops the right way each time to minimize losses and amplify gains.
I prefer smooth-ratio money management – ANTI-MARTINGALE. I know there is some guys that became very wealthy with Kelly (Buffet) and one famous trader (forgot the name) with Optimum f (but he goes to church and prays over his trading each Sunday)
I rather not pray for this ;).
Your comparisons are VERY suspect I am afraid. The abject demise of Europe stands out. Where is the “Marshall Plan” coming from ‘this time’? Additionally, newly ’emerging’ economies are a tremendous difference from the mid-late 1940’s. And those are decelerating rapidly, not expanding rapidly. Look at Brasil and China. So far off on their ‘pro-formas’ that much delevering pain will ensue. A company like Caterpillar exemplifies the ‘problem’.
No, I am reasonably certain of a delevering, deflationary period ahead, not the ‘growth’ sentiment your outlook portends. Actually, in many ways, we are at the complete opposite end of the spectrum you portend.
If that’s the case then we shall see another down turn in leading indicators. Until then, do you not see growth ahead in these?:
Click to access CLI_Eng_April13.pdf
While the OECD indicators are mildly up from the interim bottoms, we must get a serious devaluation in the Eurozone, particularly against the Japanese and their unilateral dismantling of the Yen. Germany is stuck in between the proverbial rock and hard place. Domestically things are weak, it’s E Z partners are in abject Depression or on the precipice of such and Japan, a major competitor in ‘value-add, highly engineered products, has done a 30% pancake re-price. This necessitates the Euro move.
I suspect it will be in two phases. First, a ‘sudden’ risk-off mode will precipitate a significant drop in the Euro and later a German exit is assured, perhaps even leading into the election. Germany has made it’s restricted bed. Their funding to the flawed ESM is capped, unless Bundestag expanded (NOT happening in front of the election..!!), AND Germany cannot engage in mutually encumbering “Euro Bonds” UNLESS a Constitutional referendum is presented to the people and garners the required 75% quorum. I do not believe that can happen. Therefore, the Euro MUST go..!!
And as I said the other day the real start of Bretton Woods. I suspect this has to be economic in a sense. Rebuilding after war and the K-phases being different concerns me? Global indicators I think does speak to geomagnetism or lack thereof? I wrote a late post last night about QE3 being expanded or turning into QE4. Operation Twist regarding money velocity would be a good discussion as a point int time between the start of Bretton Woods and the its demise. In the past you have looked closely at 1968-1969 and Twisting like QE under a slightly different name began in 1961. Since some twisting reoccurred in 2011 any comparison?
I think the big difference between now and 1946 is the enormous amount of rebuilding that was to take place in Europe and Japan after WW2. Building and equipping of homes and factories requires big amounts of commodities.
Now we have more or less the opposite situation in a lot of countries. Instead of factories and homes to rebuild, countries like Spain have about a million newly built apartments for sale and in China we have pictures of empty ghost cities.
Many sectors have overcapacity, so the building of more factories is also not exactly hot. And nowadays we recycle a lot more materials than we did in 1946.
Unless some country starts throwing around bombs, there is not going to be this kind of (re)building effort.
Thanks danny
Fantastic point. Europe has undergone demographic and economic maturing since WW2. The post-war period was one of Keynesian stimulus, high birth rates and economic growth being boosted by low interest rates. The post-2000 era signifies a major moment in Europe’s history. The time to get the necessary reforms done was between the 1970s-1980s, but many European countries failed to make that step towards further economic liberalisation.
Now, Europe is facing decades of inevitably slower economic growth. Europe’s workforce will stabilize and shrink a bit over the next century, whilst more people will be retiring than entering the work force, putting pressure on pensions. Japan was the first country to undergo this jolt to its economy, with Italy and more similarly Spain following suit. Spain had a fascist dictatorship until the 1970s, meaning Spain was blighted by political instability, which Italy shares, so the reforms to prepare it for the future weren’t put in place. Spain unwisely gambled on the idea of a housing bubble, and unless it finds a new way of powering economic growth, Spain loses decades to a slowly zombifying economy.
Russia has a strong outlook on the surface, but unless political problems are resolved, Russia will approach the end of its demographic/economic sweet spot (by 2030 at the earliest), having failed to prepare for the pressures of an ageing population. Countries like the United States and the UK have rosier outlooks, as they managed to engage in economic liberalisation, just in time for the demographic transition, whilst also having economic freedom that the Eurozone countries don’t have. Asia, South America and Central America are the continents where growth potential is being cited at the moment, whilst Africa may have to wait many decades before it catches up with everybody else. Going back to the points on Europe, better ties to these growth-potential markets is the only realistic way forward, growth-wise.
Good read. I have been keeping up with most of your posts, and it seems that you went from “commodities are going to explode higher and stocks will go to zero” to now “well, commodities may go up, but we are on the verge a longing equities for life.” All your other analysis was well concentrated in items that may “trigger” a new cycle, rather than the specific timing of the cycle. Notice, no cycles are even close to perfect when you’re in the trenches. Look back at valuations of those times and how all multiples got close to their bottoms (PE10 in single digits, tobin’s Q, etc.), which then allowed for a “great rotation” into equities. I do not believe a rotation will occur until these multiples are seen. Investors will remain in bonds into 2020, when rates have finally “smoothed to a bottom” and begun on an upward trend. Also realize expected returns for the S&P is negative over the next 10-15 years. This would imply that either a major correction must ensue (30-60%), or we will remain sideways in the equities markets for quite sometime.
Your views have been good, but I just don’t want you jumping ship into equities right when it’s all coming down.
Hi Sam, thanks, I appreciate your thoughts, and I’m with you in part.
I wasn’t ever in the equities to zero mindset, I was looking for a shallow final bear. Then the evidence made me draw in an alternative (further along in the cycle), and so I proceed keeping both under consideration.
But as it happens I’m going to be back on this in tomorrow’s post – the secular position of equities.
It is good to have a longer term view based on some “model” or other, but then the need to adjust the shorter term picture based on recent observation will usually arise along the way. I think that’s what John tries to do.
Of course, one of the things with models, and this is a mistake that 1000s of scientists have made before us, is that at some point we can become quite confident in a model, and then we kind of start “changing the reality” in order to fit the model, we start picking up more pieces of info that confirm our model, and we turn more of a blind eye on the pieces of info that don’t. Or in other words: we start seeing the world through the colored glasses of our model. It’s not easy to avoid that.
For all practical purposes stocks bottomed in 2009. If all we get this year is a brief 10% correction, then we can hardly credit solar max for it. Because 10% corrections happen all over the place. Periods where the S&P goes without a 10% correction for more than 500 days have been quite rare.
In commodities, the CRB peaked in 2008, the CCI peaked in 2011 and we will have to see what happens in the coming years. There is obviously a big difference between a “parabolic finale” and a few commodities staging rebound rallies from oversold conditions.
I largely concur Danny. It is a constant challenge to remain fully objective. I would add that everyone has a bullish or bearish bias to some degree too. And to validate my solar max theory, I want to see a broad commodities rally and an inflationary peak – that is if the solar peak has not already occurred. I’m looking forward to your post on commodities and sunspots.
I plan to finish my post about the long term commodity cycle over the weekend.
Completed the work about the eclipses first because that’s more actual at the moment
State of the climate is in for March. Around 10th warmest on record. Jan-Mar temps for the southern hemisphere land the 2nd warmest on record. So some potential there for agri commods, if extremes are maintained.

Hi John,
Our methods may be different but the conclusion is the same – a pull back in mid to late 2013 is an excellent buy and hold opportunity in equities to ride the next long term bull market.
Regards,
Kerry
That’s how I see it, assuming developments continue to fall into place. These are the tricky times, trying to navigate the secular transition. That’s the big prize: riding a new secular bull in stocks.
Paul Tudor Jones quote I love and include in my trading: “If there is a sudden range expansion in a market that has been trading narrowly, the market is sending you a very loud, clear signal that the market is getting ready to move in the direction of that expansion.
Interesting idea. Makes sense, narrow trading ranges would involve a repetitious price movement, and if say stocks had a sharp move upwards, the pattern is broken and a new pattern emerges. The miniature sideways fractals have the potential to point to a huge down or up pattern.
Look up episodic pivots.
Doug Casey comments on the recent gold crash: http://www.caseyresearch.com/cdd/doug-casey-gold-crash-not-what-either-bulls-or-bears-are-telling-you
I don’t normally do this (spam that is), but given the fluidity of the situation, and in interest of time, I just want to quickly mention that I just did a big update to my last post in the comments section. Star the discussion and vote up the update if you thought it of value. Thanks.
http://highrevsopenhouse.blogspot.com/2013/04/europe-following-gold-already.html#comment-867223495
All my respect to your stuff, John, I appreciate your work, but I can´t see inflation anywhere, CRB index (the old one and the new) is in a clear down-trend from the 2011 peak, Oil also is very weak, copper is in a very dangerous structure in a long time frame chart; Honestly I can not see the similarity btw 1947-48 and 2013, except the first chart you showed us above, by the by, very interesting, but by approximation, may be not accurate?
In the other hand, the structure is so close to 1906-23 period, with higher highs in 08-16-20 with followed with A 0,76FIB retroc. Fib, or -40% dropping process in the Dow Jones. Until last summer the structure was close to 1966-83, but the Cycle has been altered.
Time will tell the truth
For inflation eveidence what about US stocks being at all time highs despite being in a secular bear market? P/es have dropped from over 40 to currenly around 17, but nominally stocks are higher.
I see inflation in the S&P 500. It is there plain and simple. =)
First, I see a drop about 10% that occurs in a top process in the Dow Jones, 8/12%, and from now to summer-time see new highs or double top, to initiate the real down-trend that sholuld has started in 2012, by the Secular-standard of the Dow Jones, after the 9 year from the first peak (-50%+-) and after a +100% revaluation in 2-3 years.
At first, thank you for sharing your work.
I haven’t seen anybody working with solar cycles.
I haven’t seen any analogy with 1947, even if secular top in treasuries should make many thinking about it.
And Nikkei. In 1945 Nikkei had it last big drop after two decades of bear market.
With analogy: earthquakes 1923-1995, and nuclear disasters 1945-2011, and actual situation, maybe we should look for the first green shots in Japan?
It’s a very spring index.
I’ve seen analogies with 1979, caused by behaviour of JPY/USD and CHF/USD.

Big drops of silver in 2011 and gold in 2013 made some analysts thinking about early 80′.
It’s hard to place cycles very exactly, because of the length of those secular cycles.
But Winter and Fall winning Gold is almost ready for top.
Commodities had to top earlier, than 2013

Midcycle high has had time to top till 2005-2010.
Anyway, equities folowing 10- 11 years after commodities have some other observations:
http://www.mcoscillator.com/learning_center/weekly_chart/oils_leading_indication_for_stocks/
And now we are in analogy with the period of 2003 and 2004 on oil. Similarities – big ending diagonal, with attempts to break up.
I think, that next 2 years are the time for forming top of treasuries, and correction in equities. If the last secular Fall ended with inflation beat, this secular Winter should end with the last deflation beat.
The only question is: flat or sharp correction.
Many thanks for your thoughts. One of your points has inspired some research which I will share this week, so additional thanks.