

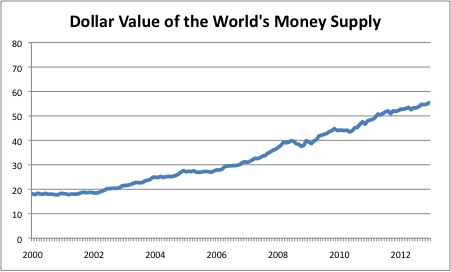
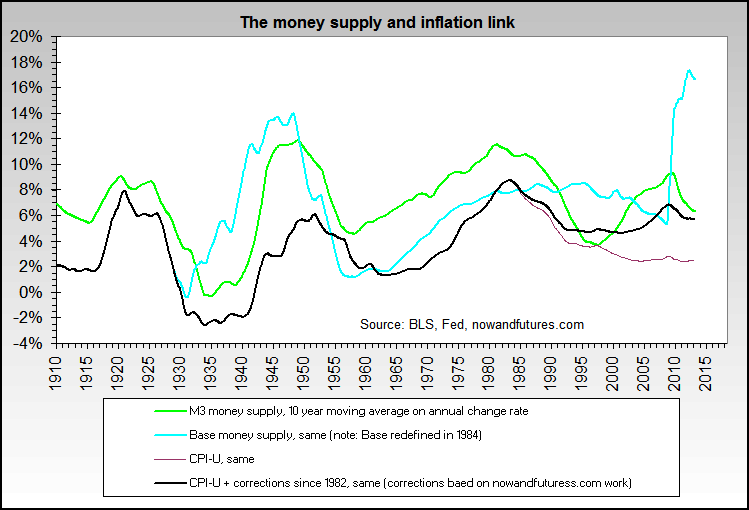
The Fed, BOE and BOJ have all been busy creating money out of thin air to make purchases in the bond market. The institutions selling the bonds then have new money in their accounts and so this produces an increase in the money supply. The intention is to stimulate the economy by increasing the money supply, once interest rate cuts have been exhausted. The ECB has this kind of direct action on standby. The BOJ has just doubled its purchases. The result of these policies is that we have seen a large and unprecedented increase in the world’s money supply over the last few years:
 Source: Maomoney-maoproblems
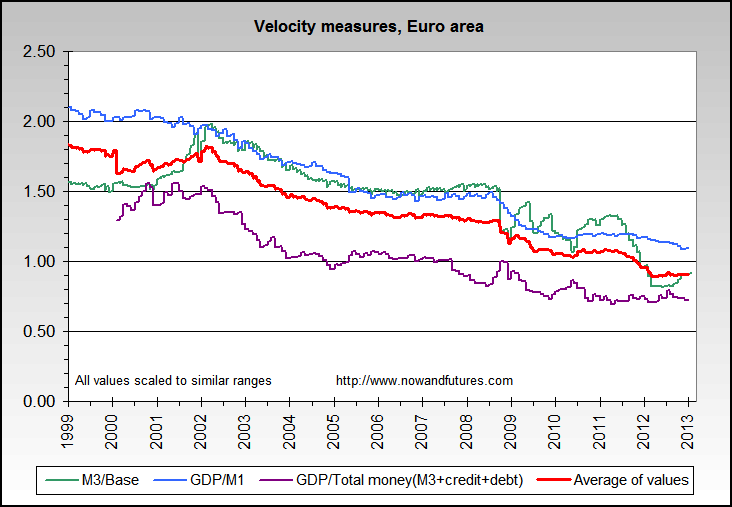
As more money chases the same amount of goods and services, this clearly has the potential for massive inflation. Yet, so far, the banks and institutions have largely sat on their increased reserves. The new money is parked, rather than circulating in the economy. This shows the lack of confidence in growth and a persistence of fear. So the increase in the money supply has been offset by a lack of money velocity. Here are money velocity charts for Japan, the Eurozone and the US, in order: 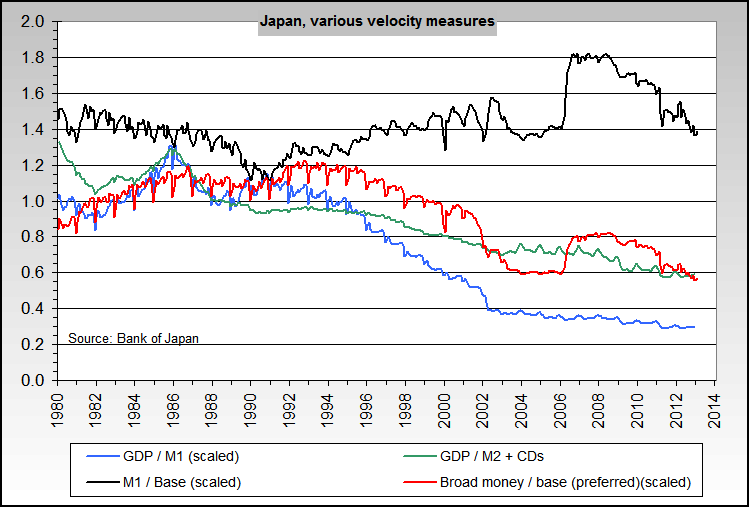
 Source: Nowandfutures
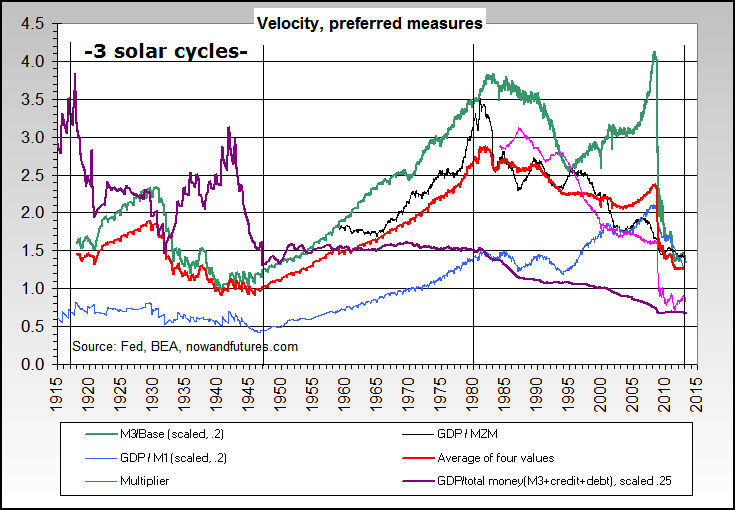
On the US chart, which is longer term, we see the same long term cycling in money velocity as in treasury yields: 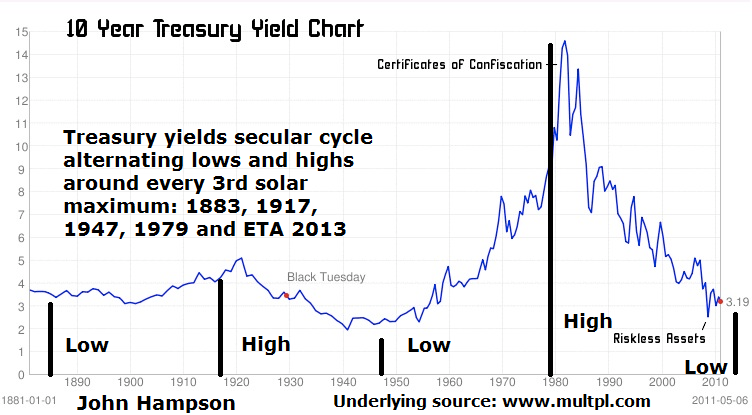 This perhaps makes sense as money velocity would tend to be lower when money is being parked into treasury bonds in an enduring trend, and vice versa. So, are we going to see money velocity about to turn upwards, at the same time as treasuries starting a new long term bear market? Certainly, with treasury bonds up to 20 years in duration paying negative real returns (using official CPI), the potential is there. Purchasers of treasuries are buying something offering a guaranteed loss, and the main reason for that is capital preservation: they expect equities, real estate and commodities to do worse. If confidence is restored in growth and pro-risk assets then we could expect a significant reversal in money flows, out of bonds. Aggregating the US money velocity measures and zooming in on the last few years we see have seen a gradual flattening out, which raises the potential this could begin to rise in 2013:
 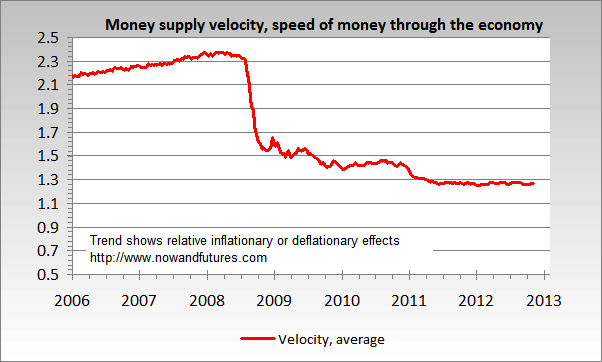 By my solar cycles work, this is indeed what should occur. Growthflation, money bidding up the secular pro-risk asset into a peak, money reversing out of treasury bonds. But we need to see velocity start to pick up, rather than flatline. If we look back at our closest historical mirror, 1947, then in the US longer term velocity chart further up we can see that velocity just reversed out of its downtrend with about a year to go before the solar/secular commodities peak. Treasury bonds also topped around a year before the solar peak, which confirms the correlation between the bonds and velocity. So, with the solar peak expected around Fall / Autumn 2013, did treasury bonds top out and yields bottom some time last year? They potentially did, subject to where they go from here:
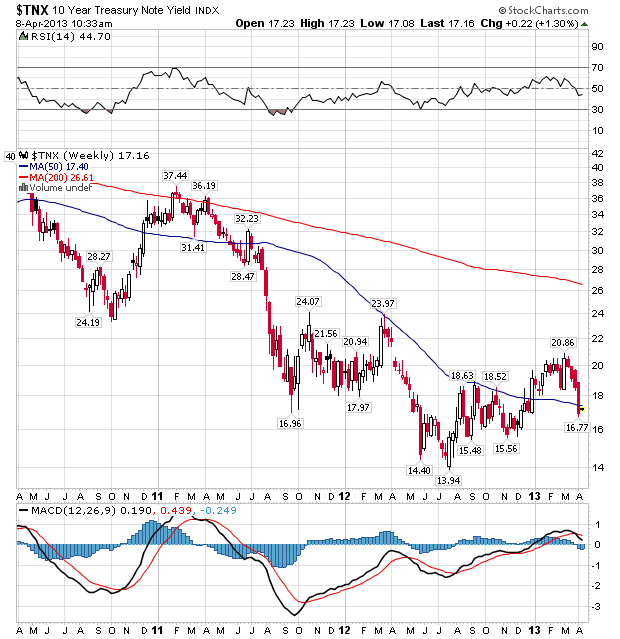
Source: stockcharts
And using the money multiplier measure of velocity, we also see potential this bottomed too:
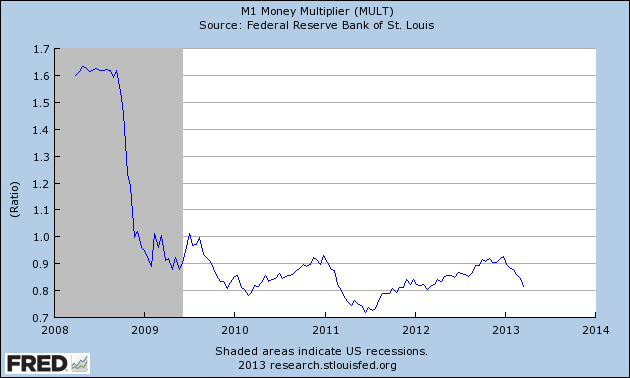 Source: St Louis Fed
Now let’s say I’m wrong about the solar maximum correlation. Unless you believe the system is broken and/or not cleansed in the cleansing cycle since 2000, then a natural cycle of growth should still take hold at some point – only the timing would differ. Once the entrenched growth becomes clear then the wall of money will be rapidly tempted out of cash reserves and bonds as it remains that they are paying negative real returns. Unless central banks then very swiftly neutralise all the new money and the easy conditions – and with history as our guide this is unlikely – then there is a high risk of major inflation in the prices of goods and in pro-risk assets. If we get such an inflationary episode, we should see the feedback looping with commodities (as hard asset inflation hedges) to deliver the secular parabolic finale that I anticipate. The alternative scenarios would be these. One, we continue to only muster low and spotty growth, nothing entrenched or sustained, which keeps the wall of money largely parked, central banks on the accelerator, and stocks gently rising. Two, all the central bank interference has prevented the cleansing cycle from doing its work, and we need a big deflationary episode before any genuine growth can be mustered. I don’t rate either of these scenarios as likely. I believe we have seen a normal cleansing cycle, with equities and real estate valuation sufficiently washed out, and private sector balance sheets significantly repaired (public sector clearly not – but it is the private sector that is the engine of growth – and public debt should not reach crunch point in the major economies until later this century on current trends). Plus the cleansing cycle has been of normal duration and characteristics. The central bank action did not succeed in restoring natural growth in this period – the cycle was king – but rather their actions are likely to supercharge what happens next. With history as our guide, it is likely that central banks will be behind the curve as inflation and speculation rapidly escalate, and with little appetite to reverse or neutralise all the new money supply. Bring back in my solar cycling theory, and we are primed for that to occur 2013 into 2014, before excessive commodity prices and belated central bank tightening tip us into a global recession again. If leading economic indicators start to turn down again, then central banks are likely to respond again, with yet more stimulus. Perhaps the ECB would join the QEers. But another cycle of indicators and asset prices falling over the next few months would start to stretch the solar timing. So I’m keen to see if the current growth is the one that sticks, and that leading indicators stay in the positive. The next chart suggests that this may be so:
 Source: Moneymovesmarkets
The leading indicator of leading indicator has just lately strengthened again instead of tumbling. If the growth can stick here, then I expect the rest to fall into place: money flows out of treasury bonds, money velocity to pick up, commodity price escalation and inflation, and all to the timing of the solar maximum. Here’s a final chart that may be predicting this:
 Source: Nowandfutures

If you believe that the commodity bull market is in play, then I would highly avoid shorting treasuries. It is more likely for the 30-year us yield to fall below 2% than to rise above 4%. Assuming QE continues, look at what QE has done to rates in the last few years. Yes, rates should be higher, but they aren’t due to artificial demand. I believe you’ll find it more difficult shorting treasuries rather than just buying high grade corporates over the next five years. Earnings should fall, as well. Hussman preaches this with excellent historical, statistical data. Tiho has a lot of good points as well. Point being, multiples could compress dragging stock prices lower, which treasuries have been an incredible hedge against this.
Thanks for your comments. It’s the secular transition. I am playing for a final push in commodities. Treasury yields should rise for the stocks cyclical bull to end. A new secular bear in treasuries is being born around this time. The earnings chart that shows US corp profits at a record percentage of US GDP is a red herring, as US comps are now global. Hussman’s fund has made an average minus 4.5% return each year over the last 5 years, and just 1.65% over 10 years – I know he remains popular, but those woeful returns should make it crystal clear that it is dangerous to follow his analysis.
Here in the US some so-called economists and GOP politicians already warned in 2010 against Bernanke’s QE1 as highly inflationary, bond-killing etc. They were completely wrong yet none ever apologized. Instead Ryan’s budget is built on top of this proven nonsense. The Keynesians claiming that in a liquidity-trap situation low rates, low growth, low inflation and high unemployment would persist until a massive joined fiscal and monetary stimulus is engaged (of the magnitude of the Lend-Lease act 1940) have been proven right so far. With German-dictated and UK self-imposed austerity the situation in Europe is even more dire, almost desperate. I’m just waiting for the next Hitlers to come up there. Anyways until a massive fiscal and monetary stimulus is engaged, the current low everything except for high unemployment and desperation situation will continue I’m afraid.
Depends whether you see the cycles dominant or the central banks. I see a normal cleansing cycle / secular bear / K-winter and evidence of a secular transition now under way. I see the central banks as tweakers. If they had have intervened less we would have seen a more ruthless deeper cleansing and more social disorder. But growth would have resumed regardless following this. Exponential technological evolution will be at the heart of a new cycle of growth.
All models updated this morning. A new geomagnetic uptrend is developing into May. May-July is seasonally a positive (i.e. benign) geomagnetic period historically. Sunspots have picked up to a level not seen since January.
Economic surprises united in a downtrend currently:

Fwiw, Google has a nice world GDP chart: https://www.google.com/publicdata/explore?ds=d5bncppjof8f9_&met_y=ny_gdp_mktp_cd&tdim=true&dl=en&hl=en&q=world%20gdp
If we compare it to the world money supply chart, then we see that money supply has not gone up much more than the GDP. Both have more than doubled from 2000 to 2011.
Basically, there is money destruction whenever a country or bank fails or when bad loans are written off. They have tried to compensate for that with money creation aka QE programs. That has kept things “stable” but is not going to create real growth.
Real sustainable growth can only come from people earning more, so that they can spend more.
Inflation has typically come from labor shortages and/or high capacity utilization (bottlenecks). We currently have neither: the employment rate is very low and unused capacity in the economy remains high.
A good place to look is the LME warehouse levels. This site has nice charts going back to 1998: http://www.infomine.com/investment/warehouse-levels/
Most metals have very high and rising warehouse levels, showing oversupply. Mines were built when prices were high and now they are producing. That means it will take several years of strong economic growth before these oversupplies will dwindle. Parabolic rises are typically only seen when warehouse levels become very low.
Danny, I do appreciate your challenges and your information – thanks again. I need to consider this and your other comment. Then a new post.
Well, I think research and articles should never be taken at face value and challenges and criticism are always needed to improve theories. So, I am doing my best.
Sometimes a certain aspect is being overlooked, or certain “evidence” may be suffering from confirmation bias. Not rarely that will be more evident for the readers than for the author. That’s why the direct interaction that blogs facilitate those days can be so useful.
Money is less liquid because it is stagnate, we can liken it to being in a big freeze with occasional melts over the last decade. The hoarding of cash may be fear based I agree. “This shows the lack of confidence in growth and a persistence of fear.” Sounds so Scorpionic. I’ve been thinking about Danny’s view point as well for a time. What will ignite inflation? Came across this article yesterday on hyper inflation: http://www.theatlantic.com/magazine/archive/2013/04/my-hyperinflation-vacation/309263/ So, I’m reminded that there are many types of inflation. Hyper, Wage, Price, Asset and Commodity etc… If (price) inflation means too many dollars chasing too few goods then those dollars need to get into the hands of people who will/need to spend the money at the same time that supply is outstripped… I can only envision this happening tied to some type of fear based reaction of some magnitude in response to something like war, drought, natural disaster, more financial crises etc. Planetary cycles suggest a spike in inflation… but it better get a move on or the match that lights the fire will blow out. The Nodal axis currently joined by Saturn in Scorpio may be more like lighting a wet match in the wind. The over hang from extending poor credit can be with us a while longer…and lenders take a while longer to ‘pay it forward’ (government intervention). Watching the 36 year cycle of Saturn-Neptune suggests we’ve only made a down payment on the crisis. 1989 to 2007 to 2025 conjunctions culminate at the World Point.
HVA
Thanks for your thoughts HVA
HVA, that definition of inflation: too many dollars chasing too few goods, is actually very useful.
The implication is that two conditions need to be met to get serious inflation: 1- too many dollars AND: 2 – too few goods.
While one could make the case that there are too many dollars for the moment, it is clear that the second condition is not fulfilled. There is no shortage in any “goods”, actually there is a glut in most things. And that’s why we don’t see inflation despite all the QE. Even China’s inflation rate is down to 2% from 4% last year.
Also, let’s say you don’t trust cash and think the currency is going to be debased even more. What are you going to do to get rid of your cash? Well, I think hoarding perishable “goods”, or filling the basement with sugar and canned tunafish, or storing a few tons of zinc in your garage, are not going to be your first choices.
The inflation that “could be” is now happening in the stock and bond markets, rather than buying sigarettes, bread or firewood, the only available options in the days of the Weimar republic.
The question becomes: how will that play out further down the road?
Great work, John, so that your main scenario is already bullish in Us stocks for a while? or have seen the top last weeks? and the solar cycle peak would leave in the end of 2013 or begining of 2014 in new highs in basic materials, hiperinflation and bond prices falling down?
As I wrote sometime, not always the solar peak matches with all time hihgs in Commodities? Could be a pwerful rebond.
Thanks in advance.
Still place the greater probability with the scenario of stocks making a cylical top by mid-year, commodities outperforming and making a secular by late 2013 or H1 2014, bonds to retreat, inflation to peak (no hyperinflation). The alternative is that stocks are already in a secular bull and commodities in a secular bear.