

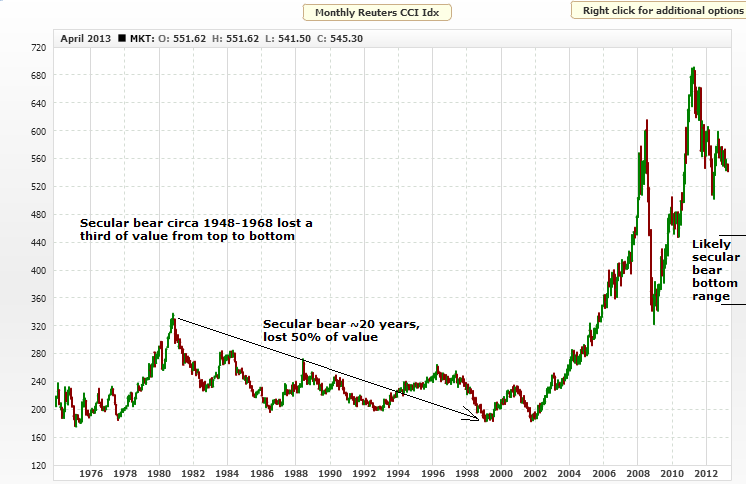
Secular commodities peak behind or ahead? Here we go again.
The last secular bear in commodities, circa 1980-2000, lost 50% in nominal value from top to bottom. The previous secular bear, circa 1948-1968 lost a third of its value top to bottom. Assume a secular bear in commodities began following the peak in 2011, then drawing on those past events we could estimate a secular bear bottom in the zone shown:
 Source: MCRI
We could go further back in time to average in more secular commodity bears, but I suggest the evironment was different, pre fiat capital era, pre free globalised markets, and pre inflationary government policies. The 1980-2000 secular commodities bear has a sideways bias, that is also shared by the 1948-1968 secular bear, and we see overall sideways action in secular equities bears too – and these are all because of modern government policies of inflation. In real inflation-adjusted terms, we see more of a downward bias, compared to the nominal.
The 1980-2000 commodities bear proceeded in waves, i.e. cyclical bulls and bears within an overall secular bear, and this too is similar to progress in secular stocks bears. If the secular bull peak for commodities is already in, back in 2011, then the chart above shows that we would already be getting towards around half way between secular bear top and bottom. Given that the secular bear progresses in waves, then a wave up ought to be soon due, perhaps like the 1982-1984 cyclical bull, post 1980 peak. As it happens, multiple commodities are currently at levels of extreme bearish sentiment, including corn, silver, copper, soybean meal and sugar, which would provide the fuel for such a potential rally. That said, overbearish or oversold increases the likelihood of a mean reversion or relief rally, but on occasion these extremes can persist and test patience, until the evironment becomes more supportive. So how does demand and supply look currently in some key commodities?
Natural gas shows a recent tightening of demand and supply, as inventories are dipping beneath the historic average. Nothing extreme though:

Crude oil inventories are plentiful, which is a depressant on price:
 Source: Bespoke
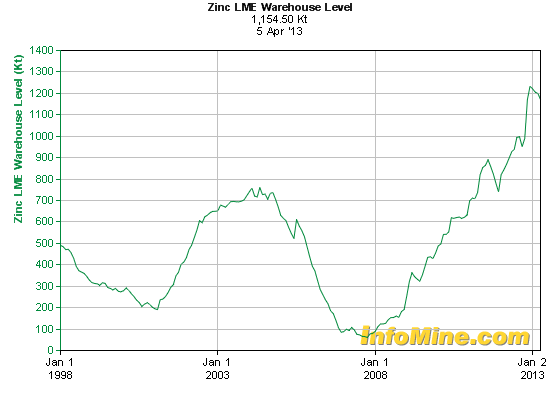
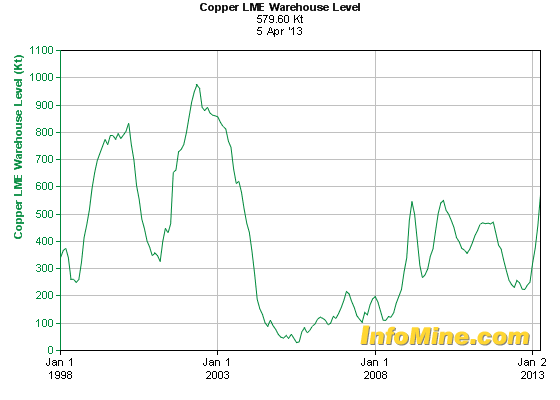
Both zinc and copper show increasing inventories. Both in notably different positions to 2008 when commodities made a big interim peak.
Cereals, i.e. wheat, rice, maize, show a fairly steady position, with inventories largely tracking sideways over the last 5 years:
 Source: FAO
And lastly to gold. Demand decreased last year on the year before, but remains high, with central bank and investor demand the main areas of growth the last few years:

Source: Moneygame
Whilst supply has been growing since a bottom in 2008, to a now all time high:
 Source: ZealLLC
In summary, the overall demand-supply situation in these key commodities is no backdrop to a major rally, at least not as things currently stand. But to return to the opening question of whether a secular commodities peak is behind or ahead of us, the clues may still be in gold. If the period since 2000 is a K-winter then gold should be the leading asset. If demand slack in other commodities reflects recent weak economic growth, then the picture for gold is more complicated, as it is less a commodity and more a hard currency. Gold can thrive in conditions of negative real interest rates and money printing (or currency dilution). That said, it is also an inflation hedge and depressed commodity prices are doing nothing to convey troubling inflation expectations. As gold is sensitive to investor interest, were there to be a shift in stance from central bank away from negligible rates and currency diluting policy action, we might have conditions in place for an enduring secular bear. Indeed, this is what I predict will happen, the question is when? Does gold have a parabolic rise left in it yet, to end its secular bull, or did that occur in 2011 with silver making such a blow-off move?
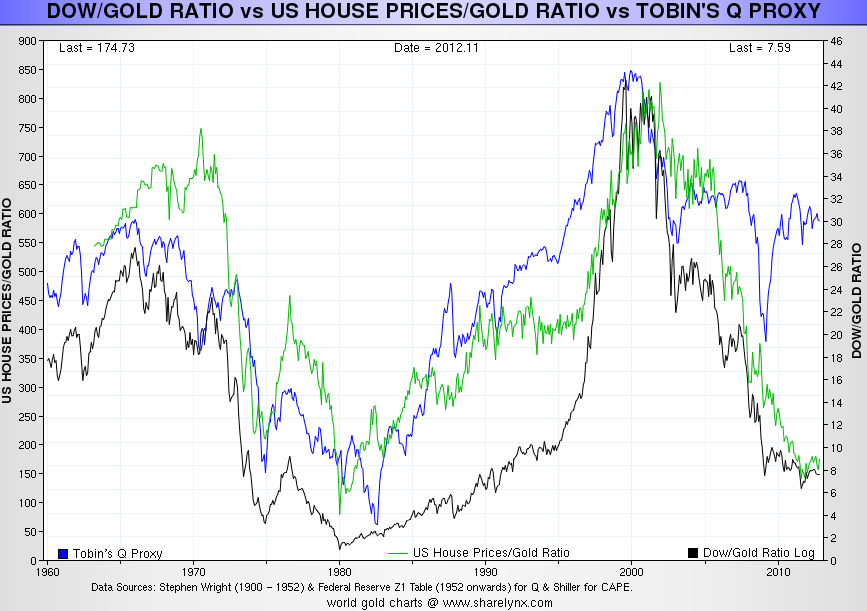
This next chart shows how we are into the region of a secular transition in stocks and real estate versus gold. Gold is relatively expensive versus both and a rounded bottoming in the ratios could be in progress:
Source: Sharelynx
The ratios are low enough to justify a secular reversal, or they could yet break lower to around 1980’s levels to complete the secular extreme relative valuation. The curiosity is the Q ratio, which together with CAPE for US stocks, leads some analysts to expect steep falls in US equities from here, such as to 450 on the SP500 ( Russell Napier) to rectify it. I doubt it because of secular low valuations reached already on other stock indices around the world in this secular bear: such as Japan sub p/b 1, PIIGS p/es between 2 and 7, Germany, UK and Hong Kong all reaching below 10. In the last secular stocks bear, Japan only reached a low of p/e 20, so not all indices necessarily have to wash out, as long as most do.
Add in treasury bonds, due a reversal out of a 3 decade secular bull market and potentially bottoming around now along with money velocity, and consider the rounded bottoming in progress in many real estate markets around the world, and we have a window, and evidence, here for a broad secular transition, out of a K-winter and into a K-spring, switching from a secular commodities bull to a secular stocks bull, to a new secular treasuries bear and a new bull market in real estate.
The US dollar also appears primed for a new bull market, following a decade long bear. Interestingly, although the perception is that commodities generally advance when the US dollar is declining, in fact the last secular commodities bull peak took place against a sideways dollar, and the previous two commodities peaks against a rising dollar. In the secular commodities bull since 2000 we have seen more periods of commodities rising whilst the dollar has been falling, but we have also seen periods of them moving together. In summary, it does not appear that the fortunes of the USD particularly correlate to the fortunes of commodities. So what other clues can we use to assess if commodities made a secular peak in 2011 instead of biding time before a secular peak erupts ahead?
Well, I’ve left out solar cycles until now so time to bring them in. My analysis shows commodities making secular tops close to solar maximums. Danny suggested that food and metal peaks tend to occur at different times. It is true that historically individual commodities have peaked at different times. Here is a brief summary of previous secular commodities bull peaks:
1917 solar peak: copper peaked 5 months before, wheat 4 months before, corn dead on the solar peak, silver not until 27 months after.
1947 solar peak: oats peaked 6 months after, wheat 6 months after, corn 7 months after, copper 15 months after.
1979/80 solar peak: copper peaked dead on, gold peaked 1 month after, oil 4 months after, sugar 9 months after.
There is the possibility that the tighter packing to the solar peak in 1979/80 could be related to the free-est, fast-est, most globalised conditions to enable solar-related speculation to be at its most potent, but if we exclude that then we are left between the historic examples to expect commodities to make individual peaks at various times around the solar peak window. That peak is currently anticipated for Autumn/Fall 2013. Could the peaks in copper, silver, and cotton in 2011 be near enough to be within range for solar validation? Possibly, but a little stretched, and when we consider the likes of oil and wheat made their peaks back in 2008, that becomes then too far away.
What I have previously explained is that secular asset peaks around solar maximums are speculative. The solar activity brings about buying and speculation behaviours in humans through biological changes. Spikes in inflation occur at each solar maximum as shown, within a range of about a year either side:

Therefore I suggest it is possible through a feedback looping of commodity speculation and inflation to bring about a secular commodities peak ahead, even with looser inventories. Once demand increases and the perception is of a change in trend in inventories (rather than accute inventories) then the status quo can quickly change. However, there is no doubt that the looser inventories and weaker Chinese / global growth are a headwind. After all, there is nothing magical about the solar influence, it is just one influence in sentiment. I have also argued that the secular asset of the time becomes the target of the solar-influenced speculation, and if the perception is currently that commodities and equities have already switched secular position, then could stocks become the target of the speculative frenzy? I can’t rule it out. However, it remains that oil and other commodities tend to be late cyclicals, making a peak after stocks, so when stocks make their swing or cyclical peak, we could then see a move into commodities. As gold has built out a sideways range near its secular highs, it could then potentially break out, giving the technical break into clear air to inspire a speculative frenzy.
In conclusion, the call as to whether a secular commodities peak is ahead or behind us remains a tough one, very much in the balance. But it comes down to how to trade this, until evidence aligns more decisively one way or the other (gold breaks up or down, CCI breaks up or down, sunspots make a new high, commodities take over as the outperforming class or equities roar away). I am already positioned long a basket of commodities. Because of the uncertainty I do not wish to add here, despite the overbearish extremes. However, if commodities did peak in 2011 then as per the first chart the CCI is reaching towards a price level and time point where it is due a cyclical bull rally soon. I therefore believe that I can likely make a profitable trade out of commodities regardless of their secular position, with a little patience.

John, thanks for another informative and educational article!
Thanks Cesar
Morning John
Keep up the good work – your brain must work 27hours a day!
http://prestonpartners.net/category/equityposts/
Thanks Will, read your post with interest
In my opinion we are in a down-trend in Commodities and we might see some rebounds in next months-years.
From 2000 10 years up +- and 20+- down (2018-2020)This is my cycle.
Thanks Antonio.
Sorry, From 1999 to 2008> 10 years (CRB from 180 to 480; +167%) +- and after 20 years down (CRB from 480 to 200 in 2009; -62%), after a retracement about 0,618 to 371 until 2011; +83%, down again to 265 in two bearish impulses (-17%and -21% in 2011 and 2012) matching with economic slowdowns.
Are we heading to a growing economic conditions?
With a new QE number 5?
Have you seen the Oil from 2008 and from 2011?
And copper, for instance?
I can not see a rush, new highs in CRB Index, but I can be wrong.
There’s your 1580 Preston (11:10amEST).
There is not trend =). The concept trend by itself is not real. You can always counter a traders argument about trend by showing another “trend” on another time frame. So again there is not trend – only time.
Very good point. People are very bad at signalling trends, they only identify them after substantial amounts of time have passed. That doesn’t mean we can’t say trends are fictitious. The idea of fractals should be remembered here. One gigantic trend can consist of a series of miniature trends, which occur over a smaller time scale than the overall trend. Let’s just say that we can easily identify minor trends, but we shouldn’t mistake them as being indicative of the much longer term trends.
We have Gold bulls being dead certain that all time highs are about to be reached, whilst Société Général says that Gold is in a bubble and in the process of slowly deflating, putting it into a bear market. Let’s say that 5-10yrs is a time scale long enough to identify which of the two beliefs has become established. Within 5-10yrs, the minor trends will have likely repeated themselves enough to show that either the current correction is a small correction in a strong Gold bull market, or it is a crucial secular market turning point, indicative of more losses to come.
Watch out for the fractals and have good luck trading, everyone.
The real question is what is TIME? 😉
“I have also argued that the secular asset of the time becomes the target of the solar-influenced speculation” – John, could you please kindly point out where you discussed this before? Thanks.
I still think equities will tank after Q2 back to 2012 levels, perhaps lower.
Sell in May and walk away or buy (“bag”) and hold (“lose”) ;). The prudent investor may want to protect the right tail too (hyperinflation) so never sell out completely. Sell 50% and bag hold the rest. Buy some OTM puts and enjoy the ride. If it tanks you double up at the abyss. The thing about cycles, I mean the more I study them it becomes clear that no cycles – like no trading systems last forever as the planetary influences will constantly change. The only thing we can do is create a strategy or ride a cycle for a while and then find something else that works for a while and then stops working. Then after a while it will work again, however the trader will switch to something else and most traders will jump on a strategy just before it stops working. Use strategies that have not worked for a while. No cycle will last forever – unless God gives you his key to the universe. But all traders will keep on looking as traders are seekers.
It’s in my PDF. It’s the theory as to how and why there is a correlation in secular asset peaks and solar maxima. The solar peak causes bioligical peaks in human exciteability which translates into buying and speculation and inflation in assets and prices.
Thanks, will reread. My sponge is way full right now. 😉
Hi John,
Did you see the latest update to NASA solar cycle prediction?
They now call for a lower peak by fall 2013 at about 66 SSN, which would be lower than the early 2012 SSN.
http://solarscience.msfc.nasa.gov/predict.shtml
Thanks Danny, hadn’t spotted that. So it seems they don’t know if the smoothed max is going to end up being Feb 2012 or Fall 2013 – it’s going to be close. That’s more uncertainty rather than less, too bad.
John,
It seems to me that the sudden disappearance in support for commodities on short term charts makes it easier for the hyperbolic case to unfold not more difficult. It would be fitting with other factors going on in the sky. I was not as convinced as prices were climbing to peakiness. Now, from here, the same emotions which dropped price like a (GOLD) brick may very well send them the other way… and then? Get out…my one concern on the upside, for precious metals at least is the overhead resistance… they have to overcome a chasm not merely a gap down…
Curious if you or others here have example on hand of heroic moves through this much resistance…
HVA
Not readily. I can instead think of examples where it’s needed some time and several hits to break through such resistance. So at this point I’m gunning for a partial retrace, with the best potential result being a backtest of the breakdown point, and then we’ll see.