

The SP500 has pushed up to the 1600 zone, which fits with the Birinyi/Bannister target, in a potential overthrow move. Plus this weekend marks the shift from the lunar positive to the lunar negative period, and a geomagnetic storm is predicted to be on its way. Lastly, economic surprises for the main regions have been in collapse and a change in trend in this indicator has previously led tops in the market. So collectively reasons for a top here.
However an opposing case can be made too. We don’t see particular degradation in stocks breadth and the SP500 has broken out into clear air. We see a strong/stable position in leading indicators. Here is the latest OECD collection:
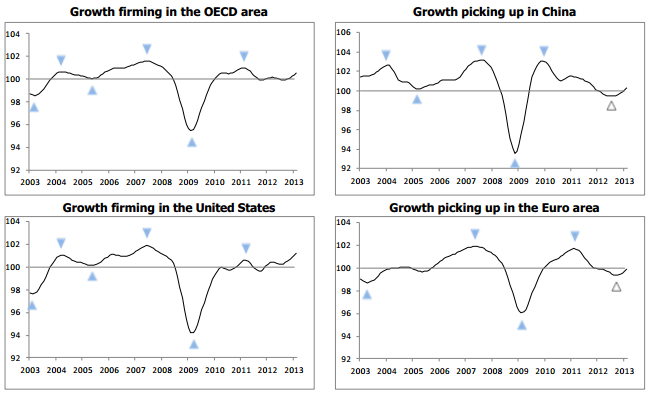 Source: OECD
Plus CB reported Japan leading indicators at +1.0, in the first of this month’s updates. Using narrow money the updated picture is one of potentially moderating growth ahead, but as yet no significant downturn.
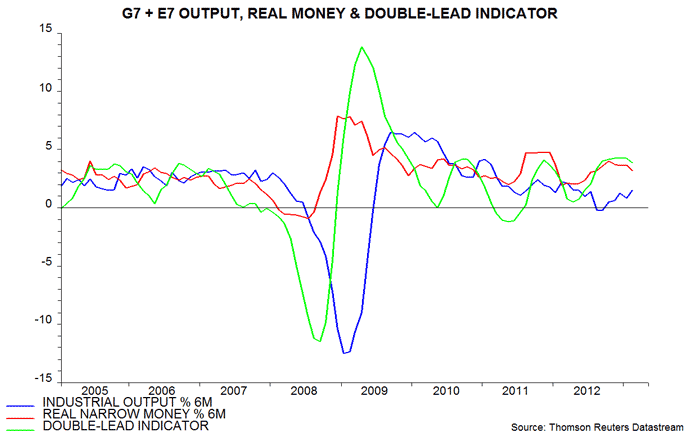 Source: Moneymovesmarkets
In terms of overbought and overbullish, some measures for equities are elevated, but there is a lack of major warning signs. Conversely we do see extremes in sentiment versus some commodities and commodity related sectors but the other way: bearish.
If you are following the SP500 or Nikkei then things look to be overwhelmingly bullish, but it should be noted that these are the two countries with the most aggressive central bank stimulus/easing programmes. A wider look at pro-risk is captured through combining the world stock index, equally weighted commodities index, euro-usd and 10 year treasury yields:
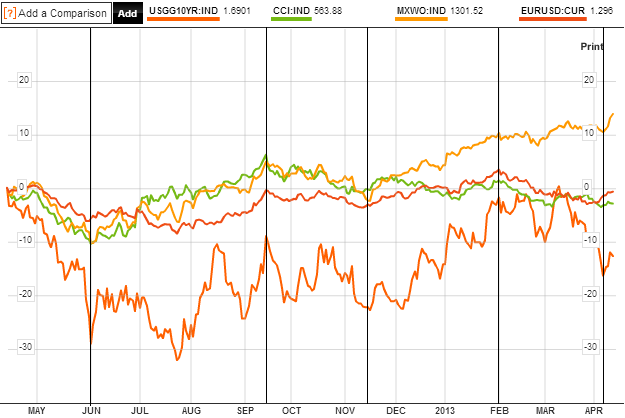 Source: Bloomberg
We see collective behaviour in pro-risk, but with under- and out-performers. So, up from June to Sept 2012, down to mid-November, up then to the turn of January into February, down into the end of last week. Could we now be the start of a new collective uptrend for pro-risk? Again, followers of the SP500 or Nikkei might find that hard to believe, but the wider look at pro-risk suggests it could be possible, and a rotation in leadership if of course feasible. The collective picture for pro-risk fits with 5-models-in-alignment:
https://solarcycles.net/2013/01/09/tools-for-2013/
Namely, a pullback from the end of Jan to Mar/April, then a final rally into around June time, to either end the cyclical bull (in my primary scenario) or produce a significant swing top (in my alternative scenario).
With US earnings season just getting under way, there is another potential mover in the markets. Let’s see.

Just to bring Danny’s Nasa solar forecast update onto the new thread: Nasa are suggesting the smoothed sunspot max was either Feb 2012 or is ahead in Fall 2013. They are suggesting it is going to be close which is marginally higher. So if the peak was Feb 2012, can we correlate commodity action making secular peaks around then?
Brent crude made a high Feb 2012 – a lower peak than 2008 but a significant high. Feeder cattle made a secular peak (to date) early 2012. Corn and soybeans made secular highs (to date) around Aug/Sept 2012. So there are some. But the bulk of commodities peaked in early 2011, roughly a year before, with some others making their secular peaks in 2008 and not exceeding since. Inflation also peaked in early 2011, but lower than 2008, and this too should correlate with the solar peak.
So, the bulk of commodities made a secular peak within a year of the solar peak, if it occurred in Feb 2012 and commodities do not go on to make new highs. That’s within acceptable historic parameters, although the historical leaning is towards peaks after the solar peak rather than before, and inflation didn’t peak within the range.
If the solar peak is ahead in Fall 2013, then we are missing the commodity acceleration which should have begun, to take us to secular peaks. However, we have also been missing the sunspots which by the theory would drive the speculation, as the sun has been relatively quiet. Sunspots have picked up just lately, and by the forecasts should be busy into the peak of Fall 2013. So, it tantalisingly remains to be seen whether the commodities index can now break up out of its triangle, and gold goes on to break up and out of its range, as sunspots pick up. Or whether commodities are about to decisively break down and the solar peak predicted for Fall 2013 turns out a lower peak than Feb 2012.
In a case like this luck becomes a major factor. Sometimes there are several groups crackling with sunspots on the other side of the Sun. But they are not counted because we don’t see them. By the time we see them they may be fading already. If the same sunspot groups happen on the visible side, then the monthly SN will be quite a bit higher. And that kind of things eventually decides whether the fall 2013 produces a SSN above 67 or not.
If 2013 does not see a SSN above 67, then it remains possible to get a late peak in 2014.
Starting to wonder if any commodities lift is going to be war or war rhetoric related.Little Kim doesn’t seem to know when to stop.The US may push the red button?
2013 – 1906 = 107
107 / 11.8618 = 9.020553373012528
SC 24 – SC 14 = 10 cycles
9.02 fairly close to 10? or coincidence?
Sell stocks in May and walk away. 😉
The problem is: sell in May and buy back by July has now worked for 3 years in a row… Which usually means it is time for something else to happen.
Would I be right in saying the Eurodollar Cot charts have become not so useful for predicting the state of equities? I’ve just noticed how websites vary in the lag that there is between major events in the Eurodollar cot and the stock market. Some show the lag to equal 52-55wks, but others say 70wks or so.
I have my doubts about its validity because I don’t see a logic as to why such a relationship would be, regardless of lag time.
Hi, John, how can you interpret this chart? Thanks in advance.
http://advisorperspectives.com/dshort/guest/Dwaine-van-Vuuren-130410-World-Recession.php
Interesting work, thanks. The % of countries in recession feels a little bit like a red herring because it depends how important those countries are. So his gdp weighted figure is more appealing, but I don’t see how that calculates to be the world is ‘in recession’, when it is just the European countries that are based on this table. Nonetheless, what matters for the markets is what’s ahead (leading indicators) not what’s behind (gdp). Latest CB leading indicators for UK just out at +0.4 versus +0.2 last month.
Hi,
In sites like zerohedge there is always a lot hot air about limited amount of physical silver. I found this chart sobering:
It seems that after all supply side is growing.
If we still have a final top coming in future then the price move will have to play against increasing supply.
Thanks Pawel. The supply is increasing in various commodities, all helping set the scene for a new secular bear, along with commodities relative valuations. Just the question remains as to whether they can squeeze a final rally out.
Gold bottomed in Sept 1976 at the exact same time the S&P and Dow topped in Sept 1976. Gold was a very pessimistic investment at the time. We all know what happened after that……gold $850
Gold futures for June delivery down $60
SELL< SELL< SELL
Goldman wants a deal on Cyprus gold? 😉
Lol
In the down side of that page you can also see the probability of being in recession now (The US) in a historic chart.
And US economic Suprise and equities chart have a remarkable divergence now?
This chart from today at ZH:
http://tinyurl.com/c5ozysn
Next week will see the most bullish US liquidity of the year barring any new QE. The moon phase shift will battle $11.5 billion in Pomos, the mid-month settlement of $72 billion in Mbs, plus a significantly reduced Treasury supply due to April 15 tax receipts. If tax reciepts exceed expectations, then rally till 4/25; if receipts fall below expectations, then rally over 4/19.
Looking for a moon phase inversion with the 4/25 ecliipse. Eclipses were significant last year and clusters, such as the next three moons, often mark trend shifts. http://thekeystonespeculator.blogspot.com/2013/04/keystones-eclipse-indicator.html Factor in the 5/18 Debt Ceiling and the 4/25-5/24 eclipse period should be fascinating.
Gold probably sideways at best if stocks rally next week, but I’m buying big today anyways. Excluding today, gold has been inversely correlated with Spx since gold was booted from the risk-on team Nov 15. Hoping gold rallies strongly with expected 4/25-5/24 Spx correction, then regains correlation and continues up as Spx moves to new fall highs.
http://apod.nasa.gov/apod/
Thanks guys. Two analysts I respect, two different opinions on where gold is at:
http://www.financialsense.com/contributors/chris-puplava/next-phase-precious-metals-bull-market
http://scottgrannis.blogspot.co.uk/2013/04/the-end-of-second-great-gold-rally.html
I still maintain it is in the balance, with good cases for both, but that there is a middle ground where I am looking for the mean reversion trade, the counter rally off gold’s current oversold/overbearish levels, regardless of gold’s secular position. So, following Friday’s breakdown it’s time for me to play it day by day and to try to catch the snapback when I think it’s happening. It could come immediately to generate a fake-out, or gold may need to wash out deeper and longer over weeks. I want to see how the action looks on Monday and the first part of the week.
I did a post on gold back in February and the long term chart is now in play, making $1400 and $1100 into likely targets: http://lunatictrader.wordpress.com/2013/02/20/gold-on-the-brink-part-2/
While V bottoms do happen, they are quite rare.
The old support at @1530 is now going to be major resistance, so I would only buy gold on a solid close above that level, otherwise stay out until some base is forming. The gold stocks (etf like GDX and GDXJ) have probably more upside potential as they are very oversold (down almost 50% in 6 months). Basically the gold stocks are already discounting a drop below $1400.
Its a lovely sunny day here in Johannesburg. The market opens in an hour.
And Gold has fallen another $60 in Asian trade. LOL
I am still short the index and will short all the marginal gold mines I can trade.
A marginal mine such as Harmony must correct to the lower price, regardless of a small rebound in the index.Put your life savings on this once in a “blue moon”opportunity.
The promlem is getting in . Gold shares will all open Gap Down.
Good luck
People always say Gold is a hedge against inflation, but what’s been fascinating to see in recent years is the fact that much of the price rises in Gold since 2008 have been based on projections of out-of-control inflation, which has failed to materialize. When you use the official CPI statistics for the US versus the performance of Gold, the CPI index is greatly outperformed by Gold. If Gold was reflecting the official inflation problems, it’d be far lower.
Production costs for an ounce of Gold equal roughly $900, so Gold has the potential to be overvalued now, and also has the potential for a lengthy bear market, which could see it at half the level of the 2011 peak.
I’ve added to gold this morning at $1450, and silver too. Will add to gold miners later. Catching a falling knife or buying into capitulation? Gold miners bullish percent has dropped to zero.
Also opened a Hang Seng long position. A 2 month retrace and to a p/e of 11.