
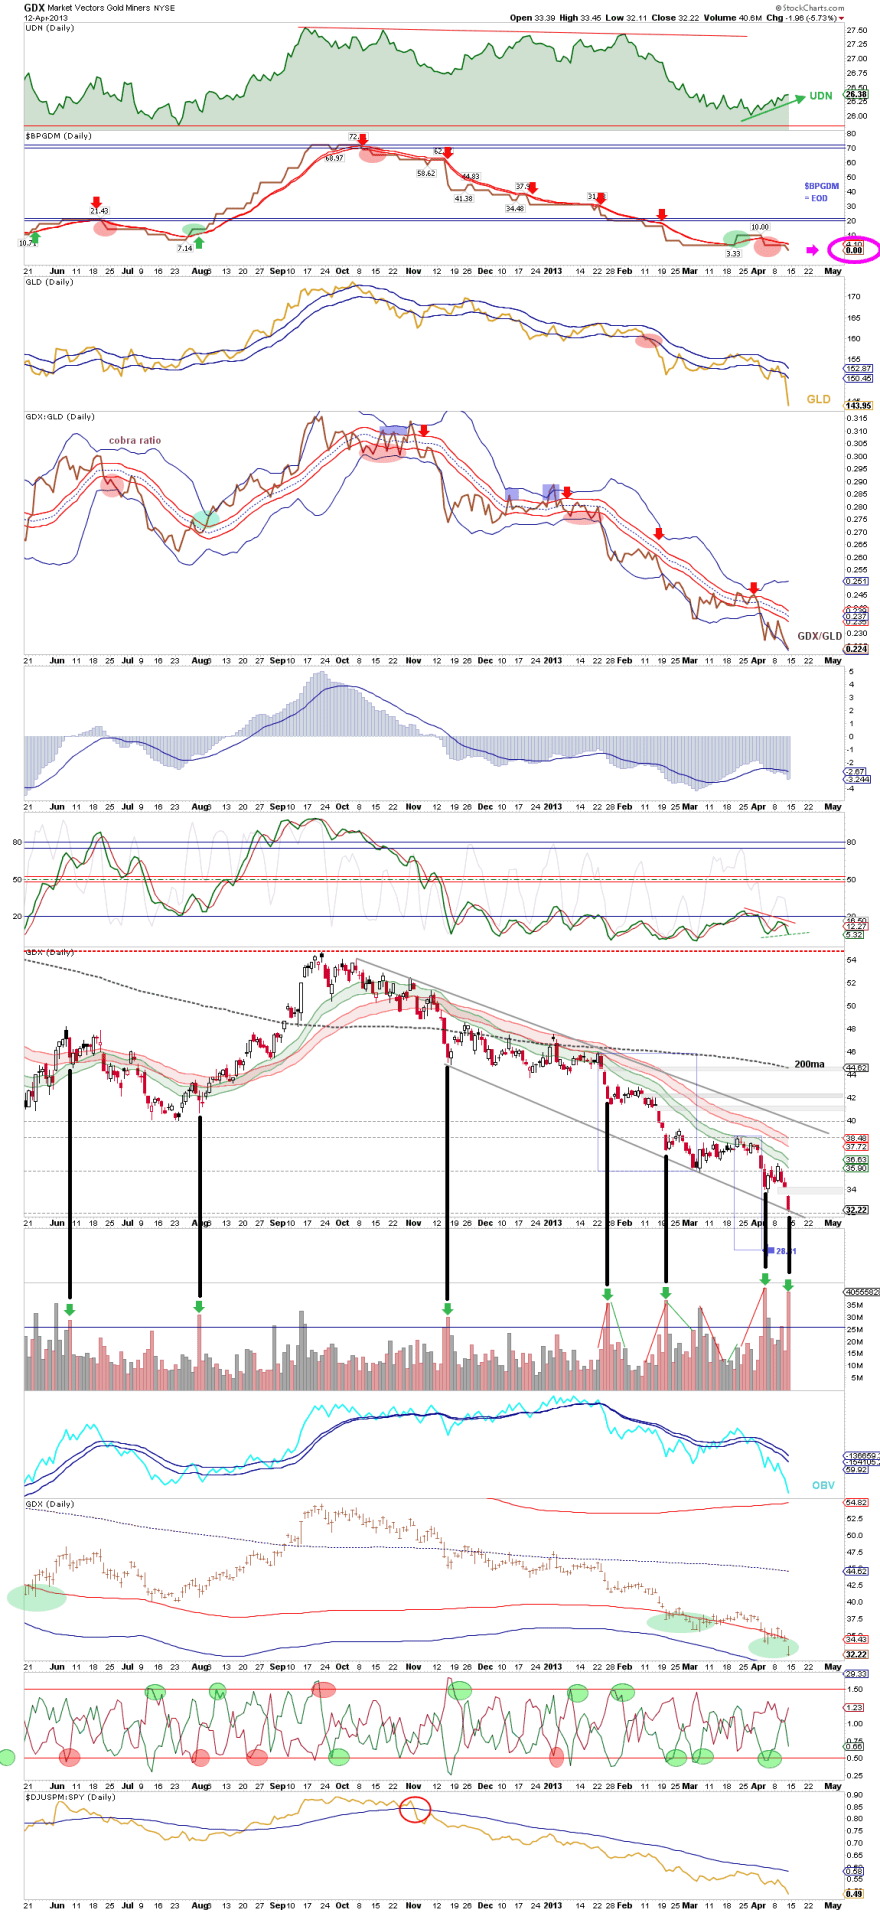
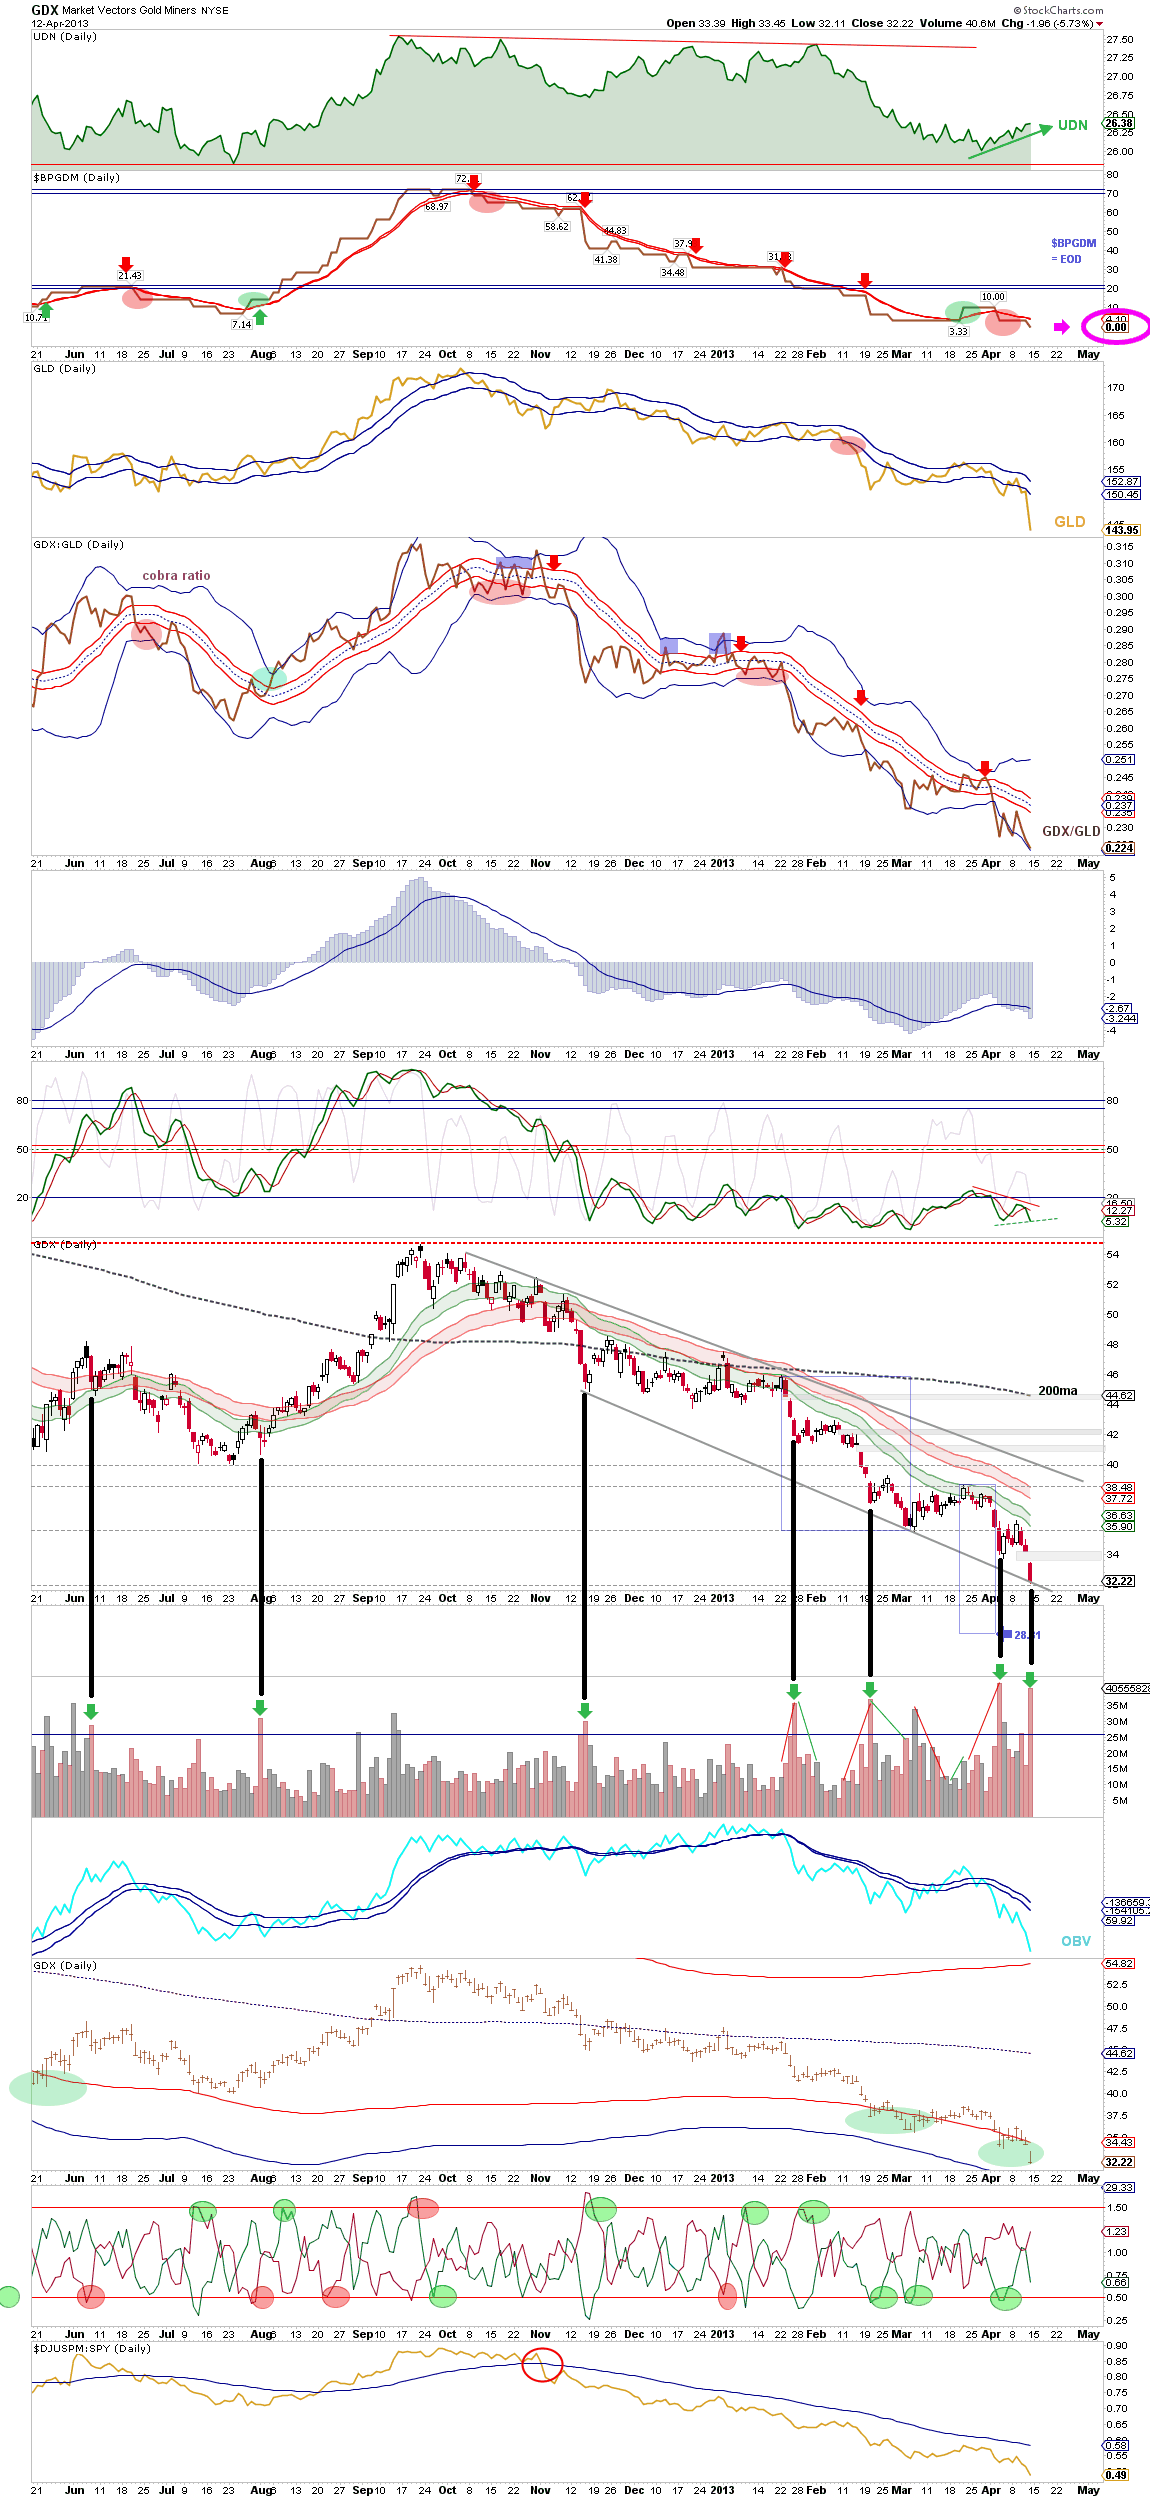
As per comments I have attacked this morning into further selling. Added to gold and silver, and will add to miners later. Chart at end of Friday shows gold miners bullish percent hit zero and high volume day which previously correlated with bottoms:
 Source: Stockcharts / CobraMV
I am playing for the mean reversion rally, the snapback, pending resolution of whether gold remains in a secular bull or topped out in 2011. See the last secular bull for possible echoes – both green circle triangle breakdowns could apply here, with the higher the termination of the secular bull:
 Source: ActingMan / Fred
However, regarding the lower green circle, I maintain that we are not in 1975 by mirror, but 1979 or 1981, depending on whether we remain in the secular bull or not. There is a history of assets shaking out weak hands in a final flush before going on to make a parabolic peak. Gold also did this in late 1978, just over 12 months before making its secular parabolic peak:

 Source: SeekingAlpha
Gold has now dropped just over 20% from its 2011 peak.
So three possible scenarios for you:
1. Are we in 1975, at the start of a mid-bull cyclical bear? I don’t believe so, as it does not fit with solar cycle timing. That mid-70s correction was the half-way point for the gold secular bull, but by gold-stocks and gold-real estate ratios we are close to the end, and the gold secular bull is a good 5 years older in duration at this point.
2. Are we at the turn of 1978 into 1979, just over a year from the secular top? I still rate this as the most likely, but it is very much in the balance. If this is so, then we should quickly see a recovery in gold, now that the weak hands have been shaken out and the key technical levels broken. A large and final move up to a peak in 2014 would fit very well with my solar cycling.
3. Lastly, are we in 1981, breaking down from a secular bull that in this case ended in 2011? I rate this as higher probabilty than 1. and less than 2. There is the possibility that the smoothed solar max already occurred, plus most stock indices hit secular low valutations. Stocks-commodities and real estate-commodities ratios hit low enough by secular history, if not absolute extremes.
If the third scenario is correct, then the danger is that gold falls long and hard before recovering. Although I previously showed the CCI to have already corrected a large amount from its 2011 peak versus its likely secular bottom, gold has been the commodity that has held up the best, and thus has potentially the furthest to fall. Nonetheless, nothing goes down in a straight line, and with overbearish/oversold extremes already in play, I am attacking for a bounce and will attack lower from here.

Gold miners ETF GDX top four holdings are Barrick, Newmont, Goldcorp and Yamana. All four have reached p/b ratios of around 1.
Bought gold again at 1402
Silver daily RSI currently down to 15, beats the 2008 RSI low of 17
and gold’s current daily RSI of 17 beats its previous low of 20
Bought silver again at 23.10
Credit Suisse’s case for the gold secular bull being over:
http://www.businessinsider.com/credit-suisse-the-beginning-of-the-end-of-the-gold-era-2013-2?op=1
This strategy looks very dangerous to me, I wouldn’t be able to buy this way, therefore I am watching with interest. The move immediately after a breakout can be retraced to the support/resistance line or be very violent and fast. Also I find interesting that so many were believing in an upside/range scenario prior to the breakout, many are shocked that gold is going down. Who out there is shorting gold? Bearishness as to when the gold rally will resume, bullishness as to the possibility of gold falling.
If I can stick my neck out, I predict gold will be sold down again once the US session opens, and then bought up to end as a daily hammer candle – an intraday v-bounce on high volume. If that doesn’t happen, then PMs and miners will be even more stretched tomorrow, where I would attack again, and odds of a v-bounce would be yet higher. You don’t often get the chance to buy at RSI sub 20 or bullish percent at zero and mean reversion or snapback will happen – just how soon and from what level.
You undoubtedly have your finger on the pulse, John! And cojones to match :-0
Your way of freely sharing your thoughts and analyses, – it’s a joy to behold – and an education too!
Trying to connect the dots, – trying to understand the powerstructures of this world we live in, – trying to learn from history. What could be more interesting?
Thanks for all your efforts! Much appreciated!
Regards and best of luck!
Sigge
Many thanks Sigge!
Hello John, like your timely follow-up, I also think that gold will have a strong rebound in here, this is a conspiracy. After the rebound, how do you see the gold?
Let’s see this week’s action. If this was a shake out of weak hands before a secular bull finale, then we should see a fairly quick and decisive rebound, feeding off the overbearish/oversold conditions. If Friday was the definitive break into a secular bear, then we should see only weak buying interest. I see it as the one or the other.
Added to market vectors gold miners etf long at 3015
Hi John,
Could you share which etf do you use for market vector gold miners? TIA
CT
Ticker GDX
Sold my NY Orange Juice position, which I bought here:
https://solarcycles.net/2012/05/09/opportunities-2/
at 120, sold at 149 today.
One more gold at 1360
Bought GLD at $131.46. Panic and snap back are welcomed.
Hmmmmm! kitco.com crashed by too much hits= panic= extreme anxiety. It worked for me every time in the past.
ABX was mentioned…if Mr Hampton is to be correct then geometry recognizable to the computers that run the markets should be close… when i first proposed that the 3 failures at upper line offered the possibility of move to lower line I was treated like the village idiot in some circles….. price is now close to time and price
http://stockcharts.com/h-sc/ui?s=ABX&p=M&st=1987-01-01&en=(today)&id=p35834168711&a=153354860&r=1366039603595&cmd=print
Well. Sir! Is it a buy or sell at this junction?
Again, if correct GLD itself should be at target recognizable to the computers…. back in October, when i first created this chart, it seemed like an outlier event… caveat… failure to hold blue arrow points to lower red arrow and potential dislocation across all markets
http://stockcharts.com/h-sc/ui?s=GLD&p=D&yr=2&mn=10&dy=0&id=p21405493188&a=245233725&r=1366040374008&cmd=print
Hi Slater. Can’t see those targets, I believe because I’m not a stockcharts member. What are suggesting is the GLD target?
And one more GDX at 2960.
Edwin- i trade a set of predefined set of trade signals that i have archived thousands of examples of the computers using over and over for trade entry… at this moment in time all i have is price approaching crucial price level but no trade entry
John- i hope it comes through in this form
http://stockcharts.com/h-sc/ui?s=GLD&p=D&yr=2&mn=10&dy=0&id=p21405493188&a=245233725&r=1366041132806&cmd=print
No I see the same.
Marc Faber is happy gold is falling because it presents an entry point. In this April 12 video, Marc speculates that gold will hit a major low within a couple of weeks.
http://www.bloomberg.com/video/faber-says-gold-is-oversold-prices-will-rebound-~B1~oQhxSpudzkkawMc5tA.html
I am using the same procedure i always use… i have varied it here if this does not come through i will email
http://stockcharts.com/h-sc/ui?s=GLD&p=D&yr=2&mn=10&dy=0&id=p21405493188&a=245233725&r=1366041132806&cmd=print
Still not working for me, thanks in advance
should be in your mailbox…
John, here is my scenario> from end of 60´s to 1975> 25$ to 190$ *8, drop about 42%, less than 0,5 retracement and up until 1980 from 110+- to 873 *8.
In this Cycle> From 2000 in 250$ to1922$ *8, drop about 42% to 1100 area and final impulse from 1100 *8.
Is your 2nd scenario.
Is possible you can show a historic chart of gold, before 1968?I have one in paper but I do not trust on it.
Thanks a lot
Ultra long: http://www.goldinmind.com/assets/images/300/20100721%2010%20Charts/Sharelynx_Gold%20at%201998%20prices.gif
There’s a similar one of silver available too.
Hi John,
I am very impressed with your trading mentality, the mind is a tough nut to crack. It serves you well and helps us all.
Good luck,
Kerry
Thanks Kerry! These are the exciting days in the markets. I am an attacker, rather than a defender, if it wasn’t obvious!
Thanks John. This is amazing to me. Learning heaps.
Hi Cesar!
Weakness into the close in PMs, but toppy action today in the Sp500. I will be back in the morning, looking to attack again, barring any overnight drift up.
I think GLD will retrace to support 150 or just close gap just when the RSI (or some oscillator) lets go a bit (see Apple) and then go down further to 100 – that may give us a bottom of a reverse head and shoulders and potentially a floor. I am holding some OTM leeps but not that happy about that trade. Thinking about trading against the gap for a scalp and then short at resistance. This thing looks like a crash à la Bitcoin. Soros sold out a few months ago – smart move. Really no need to go long until new all time highs. The only way to get out this one now is to take a loss or double down and pray. Good luck!
Conspiracy? Well I would say this:
In trading the smallest loser is the biggest winner and the biggest loser is on the popular side of a trade. GLD has been a bit like Apple the love of the crowd and a bit too obvious. It is all just paper. Nothing has value.
Hi Robert. I’m not a fan of the consipracy stuff. I see a good case for a new secular bear in gold without the need to infer manipulation. I’ve never been a ‘fan’ of gold, given that it doesn’t pay a dividend and has little use. But I fancied the trade of the parabolic finale, which may or may not yet come good. If it doesn’t then yes it comes down to averaging lower (by my strategy) and trying to make the snapback pay – one type of trade has turned into another.
Good luck, John, and other buyers here! I’m not into catching falling knives, but god bless the folks who are. It’s what makes a market.
I think $1300 gold is almost a certainly. Today’s low was only $35 above that. $1155 is not out of the question. If it drops below 1000, then the bull is toast. Silver? $20 looks likely, $12 is possible.
Hi Greg, yes deeper (and longer) drops from here would put it beyond doubt. Either buyers step in here (i.e. not just me!) and drag it back up, to reveal it was a last shake out of weak hands, or it’s another big development in the secular transition. So I think this week’s action is going to be telling.
Hi John, Glad to see you are buying today. Any thoughts on GDXJ? – the junior miners are down over 65% compared to GDX down 45%. I bought both GDX and GDXJ at end of day today heavily. John Hussman just released weekly commentary that has two very interesting Gold/Gold Stock chart that shows expected returns over 12 months. This is a very high conviction trade for many reasons.
Hi Justin. I can see GDXJ would be another candidate for a snapback, but yet riskier. My three is enough.
Morning all, added to silver at 23.03
From the point of view of classical charting, Gold’s futures’ downside target should be around 1170, as the large symmetrical triangle’s break down would suggest this target. This dovetails with a fib level and there is an area of support here from July 2010. So I’m waiting to possibly re-enter around then…That would mean we are currently having a pause here around 1330 for a flag or pullback before more downside carnage.
Classical chartist Peter Brandt takes a similar angle, but with a slightly different target based on a rectangle:
http://peterlbrandt.com/new-post-an-updated-chart-on-gold-with-price-targets/
John, would you say such a target is unreasonable given the already oversold nature of gold? Would you give more weight to oversold readings than chart pattern generated price targets?
Hi John,
Amount of comex registered silver and gold was in clear down trend till middle of 2011. Since then there is more and more metal available. Together with increasing quantities of silver beeing mined and Eric Sprot selling is not very optimistic for metals.
http://www.24hgold.com/english/interactive_chart.aspx?title=COMEX%20WAREHOUSES%20REGISTERED%20SILVER&etfcode=COMEX%20WAREHOUSES%20REGISTERED&etfcodecom=SILVER
Looking at the solar polar field strength rather then activity it seems we are approaching polarity switch which is similar to what happened in 1980.
http://www.vukcevic.talktalk.net/LFC6.htm
On the other hand there is this nice correlation between M2 and gold.
It is hard for me to grasp all the aspects of what is going on but I guess the market is supposed to be smarter then sum of knowledge of players.
take care,
P.
I respect John research, but I would describe his trading strategy as gambling…Sometimes, the best strategy is just to wait and see… And if I had large position in silver and gold , I would certainly hedge them. I think it is madness to ignore reality and stubbornly stick to the ” plan” or ” scenario” developed last year or even 2 years ago…You have to reassess your plans all the time and accept the things ad they are with less exposure to risks.Guys, don’t listen to anyone who says ” I know” or ” gold is going to…” In fact, no one knows for sure… There are so many opinions, so many interpretations, very often subjective and driven by emotions/subjective opinions or ” hot” tips from CNBC guys…
I think the best strategy is to watch and see the developments of the markets, and if you have any doubts about being right or wrong: hedge the position or avoid the trade. As gold may or may not be in the process of long-term secular bear market( as no one knows for sure) better is to avoid buying such asset at the moment. There are always opportunities, if not in gold, then in stocks…
Appreciate your thoughts. Some wise words.
I am always very careful to word my posts and comments neither as advice or as absolutes. I would never say ‘do this’ or ‘I know’ or ‘gold is going to’ so hopefully you don’t mean me in that. I’d equally hope it is clear that I continually weigh up the evidence and consider things in terms of probabilities as opposed to stubbornly sticking to a view.
All trading is gambling. Taking a loss on a support break is a gamble, as is averaging down into oversold/overbearish extremes. Hedging is equivalent to taking a loss, IMO. Sitting out the market is a gamble, as is being pro-active in. I suggest it comes down to your psychology, and what works for me wouldn’t be what works for another. I never suggest others should follow what I do.
I have a post on trading psychology and personality in the pipeline which will get at some of this.
Hi Vlad
I agree with you and a number of other members who have decsribed Johns trading as gambling. Someone even mentioned dangerous.
And as soon as you all get back from your 6 month world cruise, let me know. Because he must be doing something right to afford it.
regards
bobc