
Time for an updated look at the big picture: is a secular commodities peak ahead or behind us?
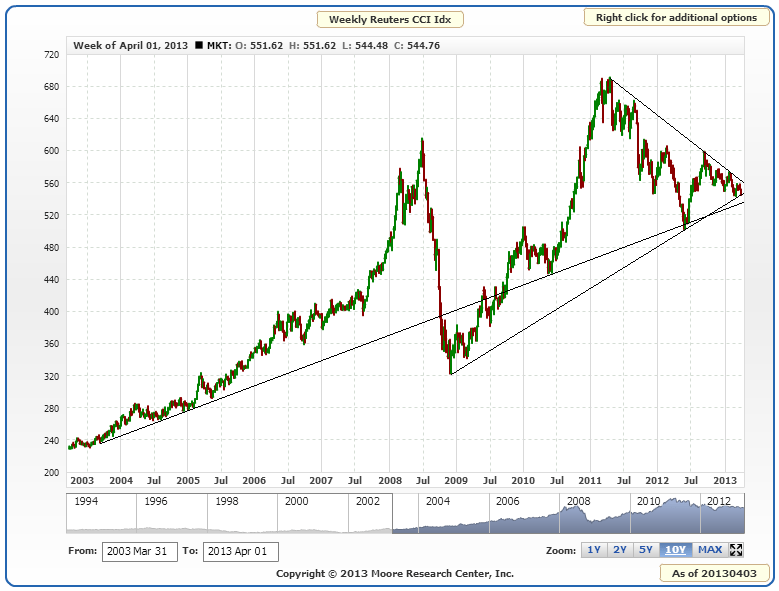
Here is the equally weighted commodities index. It remains in the nose of a large triangle. A decisive break down through the twin supports will add weight to a secular commodities peak having already occurred in 2011, whereas an upwards break beyond down sloping resistance will add weight to a secular bull still in tact.
 Source: MCRI
By solar/secular history, a secular commodities peak normally occurs around or closely following a solar maximum. However, that too remains in the balance as shown by the alternate predictions in the SIDC chart below – either a solar peak occurred at the turn of 2012 or a solar peak is ahead later this year.

The most common consensus remains that the solar peak is rather ahead than behind us, with the median forecast for Autumn/Fall 2013. Planetary models predict a spike in sunspot action around Sept/Oct 2013 and some physicists also predict a burst in activity later this year, which would fulfil the NOAA red line prediction below:

However, until such a flurry is seen, it remains unresolved.
Danny challenged the 33 year secular commodities peak and solar peak correlation with this chart:
 It is an ultra long term modelling of commodity prices, to which I have added the markers to show when the industrial revolution began and when the gold standard was abolished. It can be seen that the correlation in solar peaks and commodities peaks largely failed prior to the industrial revolution. Understand that prior to this time there were only localised markets for commodities, little storage, and almost nothing in the way of demand and supply matching. Farmers tended to grow their usual crop, bring it to market, get the best price they could for it, and anything unsold went to waste. For a natural cycle that influences collective human behaviour to manifest itself, I suggest optimum conditions are instant, globalised, free markets, like we have in the current day and age. In pre-revolution conditions, it would have been impossible to draw out real cycles from slow, localised, restricted and fragmented markets. I don’t see that part of the chart as valid therefore. See also below how the solar/secular oscillation in the Dow-gold ratio became pronounced after the freeing of gold and paper:

Source: Sharelynx
So, returning to the ultra long term commodities price chart above, we see an broken success rate (as shown by the circles) in the fiat era and between the industrial revolution and fiat era two successes and a potential inversion or double failure. However we classify that anomaly, such a failure could potentially reoccur in the future – unless it was the result of a non-free, slow, localised era. But a failure amongst a majority of successes would be in line with all other ‘real’ trading disciplines, i.e. there is no holy grail, nothing that works all the time, just things that work most of the time. To sum up, the solar peak is probably ahead, and the secular commodities peak is probably ahead in line with that.
Turning to climate and agricultural commodities, are we going to see another year of extreme temperatures and natural disasters, which would drive up commodity prices? The next chart reveals that the last two years have not been as severe as a cluster before that. However, they were both La Nina years, which has a cooling effect.

Source: NOAA
This year, a largely neutral year is expected (no dominance of La Nina – or El Nino either) so there is the potential for a bigger bar – unless the long term trend is now reversing.
Global warming is one factor, global wierding (rate of natural disasters) another, and in the US, drought conditions at the start of 2013 are displaying patterns that could unfold into the equivalent of the worst drought years in history. Grains took a big hit in price this last week due to higher than expected plantings and stockpiles, but there remains the potential that climate developments could drive agricultural commodities higher again in the remainder of the year.
Rising commodity prices and inflation together make a mutually reinforcing feedback loop. Escalating commodity prices drive up inflation and escalating inflation attracts money into commodities as an inflation hedge. So how do inflation expectations look, aside any climate developments? The next chart shows expectations have been on the rise since Q3 2012, with a divergence in gold that we might expect will be rectified:
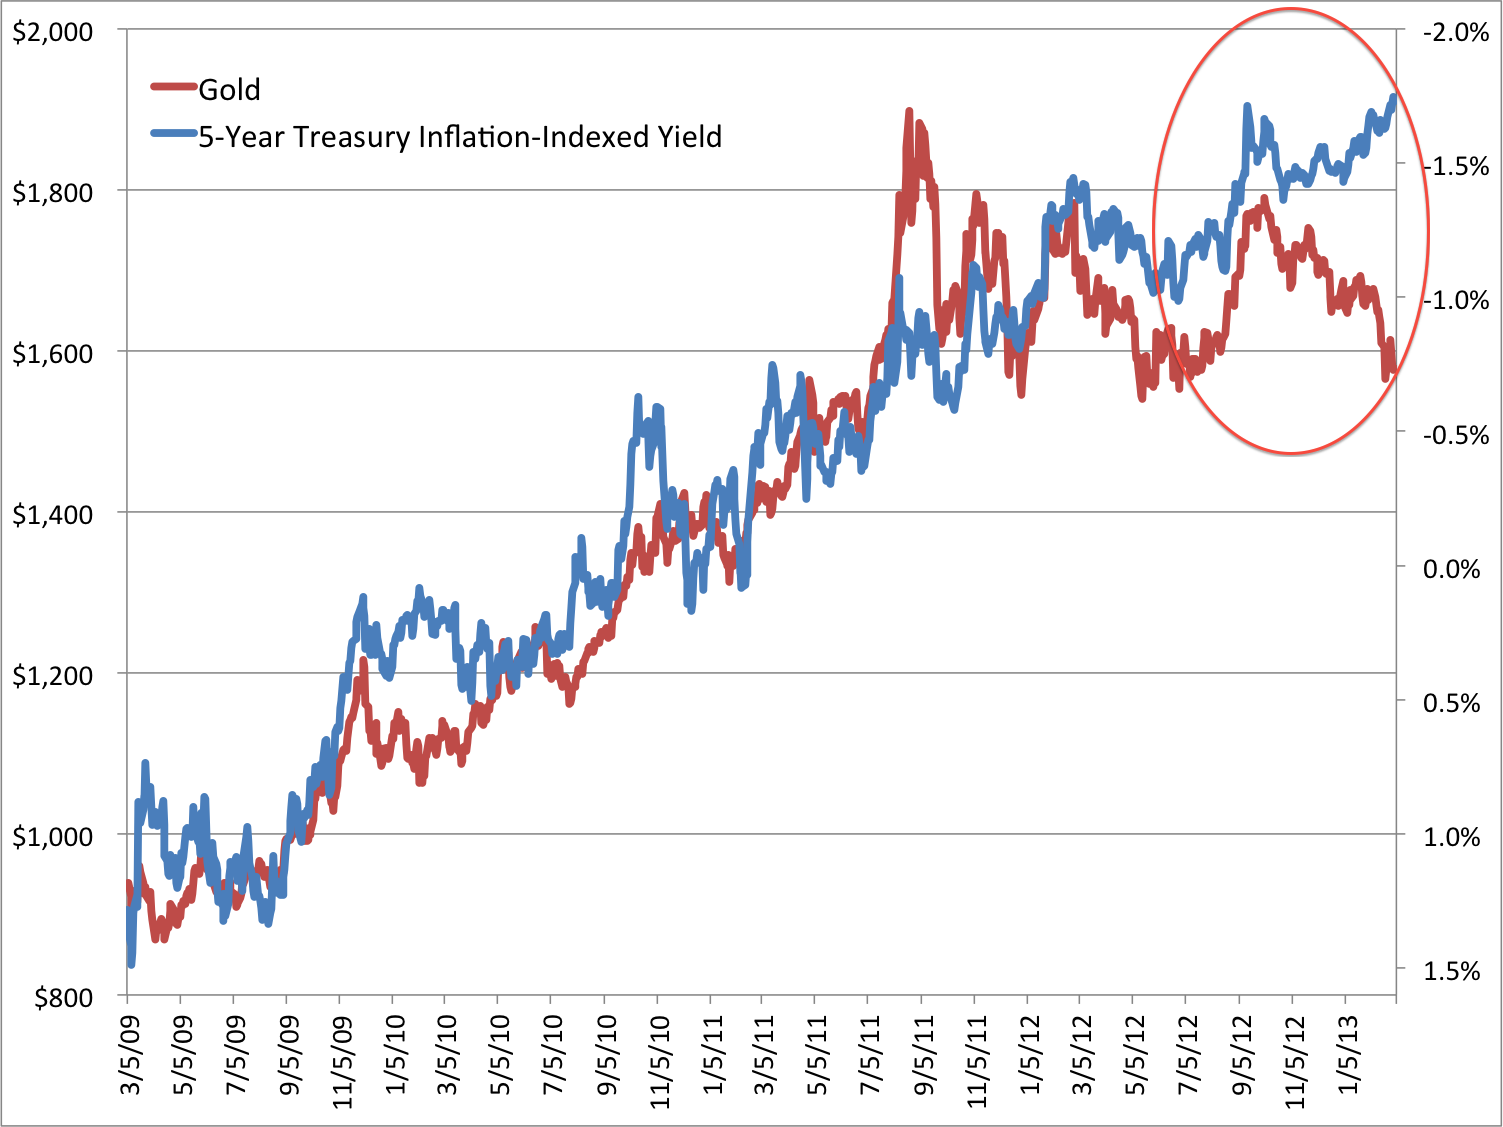 Source: M Boesler
If gold is not to make up that ground, then we might expect inflation expectations to fall instead – i.e. a period of deflation would be ahead.
Turning to valuations, gold is historically expensive here versus stocks and real estate, but could yet become more extreme expensive before reversing.

Source: Fred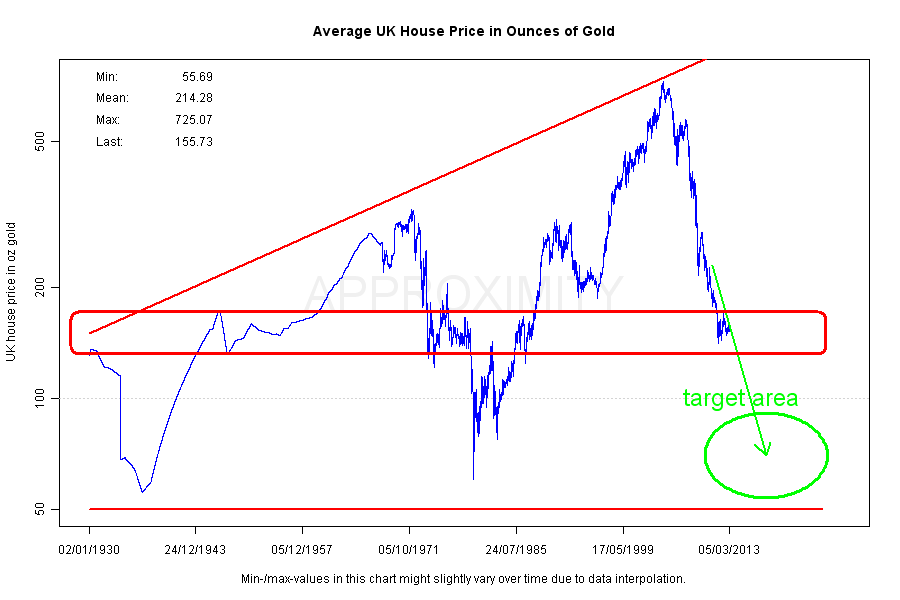
Source: Approximity
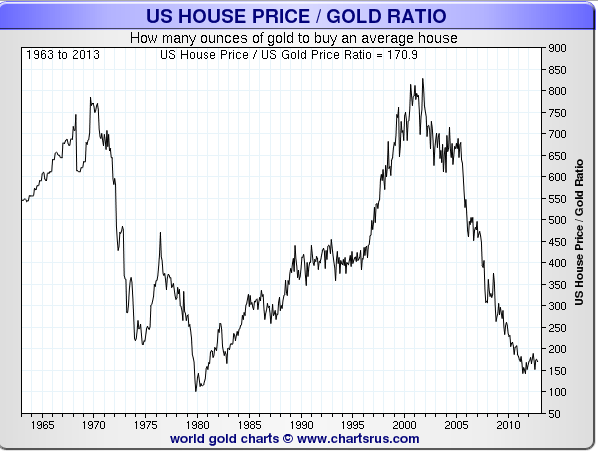 All 3 charts reveal gold’s meteoric relative rise in price to stocks and real estate since 2000. The question is, does it have a parabolic finale yet to come in which it reaches the obvious zones, or is going to stop short and is already in relative decline?
If gold has already made its secular top (in 2011), then we would expect stocks to be now in a new secular bull. So did stocks wash out sufficiently, in terms of price/earnings and price/book valuations, to make it likely the secular bear is over? So far in the secular bear, the FTSE reached a p/e of 7, the Dax 9, the Hang Seng 8, the SP500 and Dow 9. The Nikkei only reached 13, but it made a p/b ratio of under 1. Broadly speaking, they are all low enough to satisfy secular bear cleansing, and we can add to that the extreme low p/es reached in the PIIGS at the height of the Eurozone crisis. If we look at other valuation measures in relation to the SP500 then we get a different picture:
 Source: Dshort
These four valuations combined suggest the secular bear has not washed through sufficiently, and that current valuations are closer to a top than a bottom. However, we ought to note the much higher top in 2000 and question whether central bank policies of unprecedented easing and stimulus have dragged all these measures permanently higher.
US indices aside, we have reasonable evidence from around the world that secular cleansing could be largely complete in terms of valuations reached at the bottom of the falls in 2011. Plus this year we have what appears to be a new secular bull break out in the Japanese indices.
What about treasuries? This secular transition should also be accompanied by a secular transition in treasuries from a long term bull market to a new long term bear. Did treauries top – and yields bottom – in 2012? It remains to be seen as it is currently too technically ambiguous to say with confidence.
 Source: Stockcharts
Using history as our guide, if a secular commodities peak is ahead later this year (and potentially into H1 2014), then we should see a topping process in equities by around mid-year whilst commodities take over as the outperforming class. A feedback looping between inflation and commodities should occur, until too expensive commodity prices and tightening yields help push the economy into recession. That recession should be fairly mild, with stocks making a shallow bear market, whilst commodities plunge harder, in the mirror of their preceding parabolic escalation. The bottom of that shallow stocks bear would be the momentum ‘go’ point for the new secular stocks bull.
Alternatively, if a secular commodities peak already occurred in 2011, then secular bull momentum in stocks should already be underway, and we might point to action in the Nikkei or SP500 in 2013 as supporting evidence. The recession that should follow the secular commodities peak occurred then in 2011-12, with the Eurozone and the UK two notable areas that experienced this. It was not a world recession however, and we did not see typical cyclical stocks bull topping bells ringing preceding it. If we look at an overlay of the CCI commodities index on the MSCI World stock index, we can see that they topped together in April/May 2011:
 Source: Bloomberg
We did see outperformance in commodities, but not to the degree of 2008, or the last secular commodities bull peak of 1980. But silver did make a suitable parabolic blow-off in price.
To sum up, a case can be made for both competing scenarios: a secular commodities peak ahead or behind us in 2011. It remains in the balance, but not indefinitely. The CCI commodities index will break one way or the other. Gold will catch up to inflation expectations, or inflation expectations will fall. Sunspot evidence will come in more definitely in favour of a solar peak ahead or behind. Climate evidence as 2013 unfolds will drive agricultural commodities to escalating or plummeting prices. Equities will maintain secular bull momentum and outperformance of equities, or they will begin to make a topping process whilst commodities outperform.
What about a third scenario: both equities and commodities drop here into a bear market, with treasuries the beneficiary? For that to occur, we should still need to see a topping process in stocks whilst leading indicators and internals deteriorate. Currently, we do not see major warning flags in either, with leading indicators and breadth supportive. However, we have lately seen changes in trend in economic surprises, both in the US and Europe:
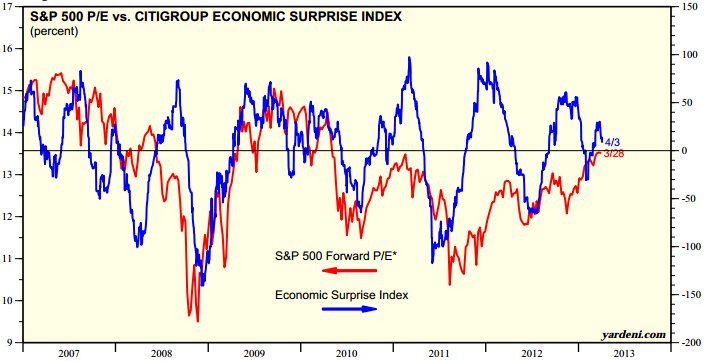
 This coincides with the change in geomagnetism trend, and perhaps provides fuel for a pullback. I do not believe, however, that we have evidence for more than a swing pullback at this point, but it could become part of a more significant topping process that lasts several months.
If we pull back and look at the wider environment for assets, we largely/generally have ultra low rates, central bank support, money supply growth, cash and bonds paying negligible or negative real returns, stock yields exceeding bond yields, low/spotty economic growth and not excessive inflation, and historically below average valuations for stocks and real estate. This is a fairly positive environment in which equities and housing can attract money flows, and that is what we are seeing. It would take another sharp slowdown in the world or another debt-related crisis coming to the fore somewhere, for this to change. The question is whether we have seen a sufficient cycle of cleansing since 2000 and sufficient foot-on-the-accelerator central bank action to now sustain growth. If growth can stick and even accelerate, then we have better chances of reaching growthlationary froth and the commodities/inflation feedback loop, as all the inflationary stimulus and easing could quickly become problematic, with faster money flows out of bonds.
Finally, a few more potential clues as to the likely winner in the scenarios. Crude oil inventories are approaching a record, which has the potential to pull the rug from under crude prices if growth stumbles. Inflation should make a bigger peak 5 years after 2008, which would be this year, based on secular/solar history. Emerging markets manufacturing surveys (a leading indicator) picked up to 52.6 in March (over 50 is growth), of which China is the biggest commodity consumer. Commodities generally move opposite to the US dollar, as they are priced in US dollars, and the US dollar could be ripe for a sustained decline as speculator positions hit a record and this has previously led a swing top.
In conclusion, there remains no clear winner, with good evidence supporting a secular commodities peak ahead, or that it occurred already in 2011 and a new secular stocks bull is in progress. I maintain that the balance of probability lies with the secular commodities peak being ahead in H2 2013 – H1 2014, which should mean a cyclical stocks bull top occurring by mid-year 2013. However, if that is the case, then it should only give rise to a shallow stocks bear before new secular bull momentum. I am positioned for a secular commodities bull finale ahead, with significant exposure to precious metals, energy and agricultural commodities. I have only a position in Russia by way of equities exposure. So there is my concern: if the alternative scenario is the correct one, then my current portfolio will perform badly. However, if commodities did top in 2011, there should be an ‘echo’ bounce around 3-4 years later in line with history (as the commodities supply-demand story is not resolved overnight), which would be a belated opportunity to make some profits on those positions, with correct timing. In the meantime, evidence would increase in favour of a new secular stocks bull being underway and I would add trades there.
I will continue to weigh this up as developments come to light. Your views and any additional evidence very welcome. I have personally found that we have reached a period of time in the markets, and perhaps in my progress, where I don’t really feel there are any ‘experts’ out there I can rely on. I believe this is the difficulty of trying to navigate a secular transition, which in effect takes several years.

Absolutely fascinating. Thanks for what you do!
Thanks
Have added to ultrashort 20+yr treasury bonds today (i.e. short treasuries).
Interesting. thoughtful stuff John, but I did exactly the opposite and bought TLT.
Keep making us think.
Assume that’s a short term trade Fiona? If so, I could see that might pay off. I’m looking more at the longer term and the transition to a new secular treasuries bear. Amazing when you pull back and see that treasuries right up to 20 year durations are paying negative real returns – and that’s using official government inflation stats.
Good stuff. Remember there are false break outs in TA. Price may break out just to reverse. It is just a big ocean of waves.
I was thinking about the same thing i.e. industrial revolution and gold standard as with respect to the interest rate cycle i.e. the Bank of England graph. It is probably all part of some planetary modulation.
Nina vs Nino: http://stateoftheocean.osmc.noaa.gov/sur/images/nino34_short.gif
A last thing to keep in mind is that Weimar actually did happen and how those stock charts looked like in all such countries.
Thanks Robert
I haven’t got any softs, no metals either. I had natural gas but I took profit in March. Technically I see no buy signals in commodities. Natural Gas looks still good though on a weekly chart. The outflow of money from Europe not only boosts US equities, but also contributes to the strength of USD. If somehow it was the end of problems in EZ, the dollar could weaken significantly thanks to Mr Helicopter. But it’s not the end. Fundamentally, sugar is at levels where Brazil will produce ethanol out of cane. Coffee is at levels guaranteed for Fair Trade farmers. Cotton was rising recently thanks to China stockpiling. But global commodities stockpiles are growing and further declines are possible. I read back in 2012 that Arabica coffee at 165 was a bargin. Now at 137 – is a bargin too. Technically, those persistent channels lack momentum, but also have last quite long, a break-out may not lead to a sustained fast price action, but to the continuation of choppy waves. Without serious weather anomalies and weakness of the dollar (look what BOJ did to JPY and Nikkei), with good harvest, weak economies, a solar peak won’t convince charts to challege new highs. This is a background, my background. I trade technically and if I see a signal, I enter – HTF matters to me more than all theories. Some say gold is a buy at 1555. Well, it’s a third test of this level, I don’t like to counter the third test in a ‘Z’ type range. Personally I will wait for a bounce off before I go long.
That all makes a lot of sense – thanks for your thoughts
any thoughts appreciated�.
Things are so bad one has to consider that it is a bullish sign of a bottom. Such as very high oil inventories, could be the sign of a bottom. However, inventories can always set new records and prices can just keep going down. I can’t help but think that Reinhadt and rogart have it right, this is the really big one. The debt to GDP RATIO has hardly started down, and it should go way down just like the ones you show have already done.
Thanks Kent
The stuff in this post makes me very grateful that this entire website is so well-structured. Ideas are floated and not forced down peoples’ throats, like so many media people try to do. The ideas suggested are rational, based on well-argued points. In relation to the point about how secular commodity peaks are followed by recessions, you could argue that a recession has actually occurred, when you consider that the BRIC nations have experienced sub-trend GDP growth since 2010. The word recession doesn’t necessarily have to involve actual contractions in output, it can simply refer to sub-trend GDP growth for sustained periods of time.
I remember 2010-11 being a period of news articles about inflationary fears and various central banks (ECB, China, Russia, Brazil etc.) being forced to tighten monetary policy. In Europe, the tightening crushed what weak growth there had been, given Europe was being pushed down by a double whammy of austerity and monetary tightening. In the BRIC nations, more favourable economic circumstances have meant the monetary tightening has not brought about a contraction in output. However, the BRICs have demographic headwinds to contend with, which will weigh on growth eventually. If this slow growth they’ve had since 2010 remains the norm, the BRICs will end up making the economic mistakes many European nations have made.
One final point on recessions: the recession of 2011-12 in the UK has been significantly revised away. Comparing initial GDP estimates in 2011-12 to the latest revision of GDP published in the past month shows how the ONS does tend to understate how the UK economy is performing. Some say UK GDP data collection is worse than China’s! This just goes to show how a lot of the data we’re using now could so easily prove to be invalid in mere months.
Many thanks Pete
I don’t think your idea of another commodity rally is necessarily wrong, but I think price is indicating lower (quite a bit!).
We just need prices to have that flush, and then we will be able to see more clearly what is in store.
Thanks fiona. Concerning to read that retailers have piled into gold on this down move – normally a contrarian sign so may not be done yet.
John good charts as always. I try to encourage to think big data and look at more data. The more less connected data may actually be. I am just thinking record logs of great storms and shipwrecks and how that had an economic impact globally before the industrial revolution. Wars while continental in scope back then now global today, would have left records. I’m in full agreement with you that the free economies and fiat currencies do let us witness an influence here not seen before. However bear in mind the solunar theory, farmers almanac, mayan (21st 2012) calendar, and chinese calendar share commonalities started after good January month in markets. We have spoken about both of us having an interest in fibbonaci I believe. The year of the snake with water and fire is going to mean one half of the year is one way, the other half the opposite. In the previous posting before Russia, I mentioned PDO. You keep looking at only ENSO and La Nina in your posts.
Does what following echo familiarity? “In Chinese Taoist thought, water is representative of intelligence and wisdom, flexibility, softness and pliancy; however, an over-abundance of the element is said to cause difficulty in choosing something and sticking to it.”
http://www.innerjourneyseminars.com/the-five-elements.html
Therefore, I leave you again with thoughts that can be plotted and overlaid given the time:
http://www.huffingtonpost.com/daniel-bruno-sanz/the-great-crash-of-2014_b_521286.html
http://en.wikipedia.org/wiki/Solunar_theory
http://www.federalreserve.gov/monetarypolicy/fomccalendars.htm
http://pinyin.info/chinese_new_year/cny1645-1899.html
http://www.intellicast.com/Community/Content.aspx?a=126
http://aunegl.com/bradley-model-performance.html
http://ssd.jpl.nasa.gov/horizons.cgi#top
2013 Snake year is the beginning year of the Fire cycle, 2012 ended wood.
http://www.chinesefortunecalendar.com/2013ChineseHoroscope.htm
“Water of 2013 and Fire of Snake are opposite elements. Therefore most of people will experience mix of good and bad fortune.”
Received my copy of Stock Market Prediction by Donald Bradley today. Going to read up whilst taking Fibonacci, angular momentum of sun, planetary alignment, and Chinese calendar into consideration.
Think GDP numbers everywhere are hoolah. GDP here in USA was only positive due to energy sector. They revised (lied) about it. Think no numbers a re accurate and QE will continue for foreseeable future. Last time chinese calendar was like this year: 1953. Funny how the Korea stuff and rhetoric relates. Q2 is gonna suck when numbers come in.
BOJ QE will be good for gold. Europe not lowering rates…bad for Europe. Company I work is making no investment in anything, hoarding cash, paying off debt, buying back stock, issuing bonds. Must fight for everything. 30% of their market is Europe. Weak fundamentals speak volumes vs GDP lies.
The following would bode well with a minima cycle…not sure about 17.6, which I think is Fibbonaci actually.
http://astroeconomy.blogspot.com/2009/10/economy-depression-of-2011-2019.html
I know you like to use math, science, and evidence to make these discussions more meaningful and I enjoy that. Just think if other datasets might strengthen what your gut is telling you.
Much appreciated wxguru. I liked your ideas that you laid out last time, and this, like overlaying the Bradley model, and I don’t feel I have explored fibonacci enough yet. These things are on my to do list – so thanks.
“If you want to know everything about the market, go to the beach. Push and pull your hands with the waves. Some are bigger waves, some are smaller. But if you try to push the wave out when it’s coming in, it’ll never happen. The market is always right.”. Ed Seykota
By the way, I was tired when I posted last. I left off some useful links for you (and all)
(Updated once a quarter, though with satellite imagery today you could read it from images quicker.)
http://jisao.washington.edu/pdo/PDO.latest
Cross section this with sunspot numbers, el nino/la nina years…
http://solarscience.msfc.nasa.gov/greenwch/spot_num.txt
ENSO to 1856:
ftp://ftp.atmos.washington.edu/mantua/pnw_impacts/INDICES/nino34.long.latest
http://jisao.washington.edu/data/quinn/qnam.html
I figure plotting these with lunar and/or alter data like the Bradley, PMI, or points of recession or record GDP points might point out something. The Bradley curve I’m looking at is sideways early this month so expect things to up and down like a yo yo until after full moon perhaps? An article the historic book collector I ordered my book from sent an article from Fred Gehm in the late 1970’s. I haven’t finished reading it but Fibonacci and Elliott are related. I want to put into web browser-based software some day soon. I’m not as versed in trading as you are with no immediate plans to be, it all just interests as most patterns do.
Lastly so you are aware ( I was not)
http://my.firedoglake.com/weatherdem/2013/02/08/el-nino-and-la-nina-redefined/
http://wattsupwiththat.com/2013/03/16/noaas-ever-changing-definition-of-la-nina-years/
Cheers!
wxguru: I think it is a mixed bag. Here in Sweden people are leveraging up thinking about buying second homes in Spain and new cars. Resi market breaking new highs month after month. It is 2008 bonanza all over again. Best is not to put any personal feelings into anything that involves price and just follow the graphs. Ignore the economy. What is the economy? It is just some epithet given by economists and society that can not pay their own way out of a paper bag. I believe in fibs, trend and planets. Most of all taking profits. The rest is scam and the trader’s worst enemy.
Ibanks hiring people again with focus on Russia stocks I noticed the other day here in Stockholm. Pump and dump.
A good drug sniffing dog is all you need, that’s about it.
John, Some at NASA think Solar Cycle 24 is similar to Solar Cycle 14, which had a double peak: “Pesnell notes a similarity between Solar Cycle 24, underway now, and Solar Cycle 14, which had a double-peak during the first decade of the 20th century. If the two cycles are in fact twins, “it would mean one peak in late 2013 and another in 2015.” Source: http://science.nasa.gov/science-news/science-at-nasa/2013/01mar_twinpeaks/
The northern and southern hemispheres of the sun are out of sync, which is the source of this bifurcation in the cycle.
Thanks for all you do, John. I’m convinced a new commodity bull is starting in May and that equities will go south at the same time. This is also entirely in tune with the seasonal pattern in equities. And, it’s in tune with the idea that the liquidity pumped into the markets by central bankers is self-limiting in that a self-defeating inflationary cycle will be generated which the bankers will recognize and shut off the liquidity firehose, too late to stop the cyclical commodity bull market nevertheless.
—Bob
Thanks Bob. Your scenario sounds compelling to me.
Global composite PMI released:
http://www.markiteconomics.com/MarkitFiles/Pages/ViewPressRelease.aspx?ID=10974
An edge up in global growth.
Seeing as the Commercials on the USD COT are at their most extreme net short position seen for several years will we see a significant pull back with the Dollar soon?
Having said that I’m of the opinion that in the long term, capital flows will be drawn towards the Dollar. What’s going to happen with those flows in September when those German elections come about…?
I concur. In the near term overbought and overbullish ought to pull it back for a while, and I think the USD is ripe for a long term bull market, and that fits with the overall secular transition in assets. Sideways action in the USD was the backdrop to the last secular commodities peak, before it took off.
https://solarcycles.files.wordpress.com/2012/02/idealised-solar-cycle3.png I read this as treasuries will do bad. Has this changed since you last authored this? You said about your position that you added ultrashort 20+yr treasury bonds. The ultrashort is to take advantage of the 3rd scenario? 3rd scenario is short term versus long term in the cycle graphic I’m referring to? Thanks
‘Long ultrashort 20+yr treasury bond’ etf means ‘short treasuries’ – it is a ‘short’ etf (an ultrashort etf, i.e. leveraged). As per that graphic I believe treasuries are starting a new long term bear market, and I believe buying (selling treasuries short) around these levels will reap great rewards.
I am reminded of an experience that Ed Seykota shared with a group. He said that when he looks at a market, that everyone else thinks has exhausted its up trend, that is often when he likes to get in. When I asked him how he made this determination, he said he just puts the chart on the other side of the room and if it looked like it was going up, then he would buy it…
“Our work is not so much to treat or to cure feelings, as to accept and celebrate them. This is a critical difference. Fundamentalists figure things out and anticipate change. Trend followers join the trend of the moment. Fundamentalists try to solve their feelings. Trend followers join their feelings and observe them evolve and dis solve. The feelings we accept and enjoy rarely interfere with trading. Trying to treat or cure feelings adds mass. ” Ed Seykota
Wise words.
It’s clear to me that there are many different ways to make money in the markets – many ways to skin a cat. Met someone on the trip who had been 10 years full time trading one thing: GDP-USD currency pair. People gravitate to what suits their personality.
Hi John,
As far as I know the gold standard was abandoned in 1971 by Nixon.
I think there is a much simpler explanation for what we see in the long term commodity chart.
1600 – 1850 was a cold period, especially the 17th century (Maunder minimum), when an estimated 30% of the world population died. Even rice harvests in Asia failed because of cold weather. The 20th century has been a period of warming, as we know.
Logically, in periods of cold climate the risk to crops is from cold (shorter growing season) and freezing (especially late freezing). See http://en.wikipedia.org/wiki/Year_without_a_summer for the most famous example. In warmer periods, the risks to crops come from heat.
That’s why in the 1600-1850 period we see more commodity peaks near solar minima, while in the warmer 20th century the risk to crops shifted to heat, leading to peaks near solar maxima.
Danny
Makes sense
Hi Danny, there is some very long term correlation between solar activity and climate, e.g.

But I don’t know of any evidence for the tighter correlation you are suggesting whereby temperatures are at their lowest at the solar minimum and vice versa. In the climate chart further up the page we would be seeing clear ebbing and flowing of temperatures over ~11 year periods which isn’t present.
Research shows that speculation was the main driver of commodity peaks in recent times (of free global markets). Research also shows that solar maxima correlate with maximum excitement behaviours in humans. We see speculative peaks in the secular bull asset of the time of the solar maximum (e.g. dot com stocks 2000, Nikkei 1989, commodities 1979/80), and we see inflationary peaks along with each solar maximum (not just the commodity ones), all backing up solar driven exictement in humans:

So I suggest it is not temperature that drives commodities peaks. But if you can show me evidence of a waving in temperature with each solar cycle I’d be interested to see it.
Mars is the placebo or aka control for scientific obs. purposes. That chart Danny shows could easily not be specific to Earth. This is someone you should both monitor. I mentioned him before John.
http://gtresearchnews.gatech.edu/newsrelease/spring.htm
http://www.mendeley.com/catalog/stratospheric-forcing-surface-climate-arctic-oscillation/
Abstract mentions this may be solar cycle connection to everyday or weather patterns. PDF link below:
http://journals.ametsoc.org/doi/pdf/10.1175/1520-0442%282002%29015%3C0268%3ASFOSCI%3E2.0.CO%3B2
As for commodity peaks, obviously not exactly responding to that aspect, but wanted to share this info with all viewers.
One other thing on this…
The Body Electric: Electromagnetism And The Foundation Of Life
http://www.amazon.com/gp/product/0688069711
“Changes in the solar cycle affect our biology and behavior. For example, around solar max you will find more wars occurring around the world because the increased solar wind creates more positive ions in the air, which in turn make the blood and cell environment more acidic. Acidic pH leads to more aggression; that is a defensive cellular response rather than a growing one.”
p.h. is also apparently cited in Bradley’s book. Still reading it.
The above book is on my wish list to read.
Many thanks wxguru. Acidic ph can contribute to extroverted behaviour, hyperactivity and strong appetite. So together with aggression, these collectively fit human ‘excitement’ as Tchijevsky labelled it, and I suggest these behaviour changes are likely to be behind the buying and speculation that brings about the associated secular asset and inflationary peaks around the solar peaks.
Here in the USA, employers are required to report new hires for unemployment fraud purposes among other metrics like total hired for publicly released figures. When you are fired or laid off, employers have to report that you are gone and why. What they do not publish publicly is how many weekly or monthly quit one job and take on a different one without any gap in employment. During a recession, fear causes this type of change in employment to drop. That is logical as is the opposite. In a strong economy, people flee to opportunities with better pay and benefits of all kinds. On compensation, folks that have not received a decent pay raise or ask for more due to risk jumping positions is apt to be an inflationary indicator also. If anyone does know where this information is published, this would be also a great overlay for human mass excitability in relation to inflation data and solar cycles. We know with the recession, there is pent up demand to switch or leave an employer who tried to operate more efficiently at the expense of employees welfare, etc.
Hi John,
The sun gives less heat during solar minima, that’s known for a fact (see: solar irradiance). This doesn’t show up as big changes in the global temperature average, because there is plenty of heat stored in the oceans. But what you do get is a different distribution of heat on the planet, different weather patterns.
People who want to know the why will have to check out researchers like Vaclav Bucha, and Kallenrode has a good chapter about it in her recent book.
The short story is:
1) solar minimum = sun gives a bit less heat = ~ 0.07 degree colder
2) solar minimum = solar wind weak = geomagnetism weak = more “blocking patterns” in the weather (~ jet stream) = colder and longer winters in temperate zones (= main food growing regions), with more risk for late frost damage.
3) solar minimum = geomagnetism weak = higher cosmic rays = more cloud cover = climate cooling (see: albedo)
Then there are also various forcing and amplifying effects that can be local or regional. A recent NASA article also covered this topic: http://science.nasa.gov/science-news/science-at-nasa/2013/08jan_sunclimate/
Parabolic peaks in commodities are happening every so often, also near solar minima. The most recent major CRB peak came in July 2008, near a solar minima.
As the saying goes: there is always a commodity bull market somewhere.
Imo, commodity speculators will get excited about any commodity any time, as long as it has been going up and there is known supply problems. They will become equally excited to sell a commodity down if there is a known glut. Natural gas had a big peak in 2005, oil peaked in 2008, gold peaked in 2011, and on it goes… The solar cycle peak will come and go, and commodities will continue to do as always: have a parabolic rise from time to time, wherever there is a shortage (which can come for all kind of reasons).
The problem with long term cycles is always the same: we are trying to make conclusions based on relatively few properly observed cycles.
Let’s say somebody tosses a coin 4 times and gets heads every time. How confident are we that he will get heads again on the 5th toss? Most of us will not be convinced and correctly say: 50%.
But that’s not what most of us do with cycles we see in the market. We see something 3 or 4 times in a row, and then we start betting on it happening again the 5th time. And not rarely that’s when the first tails comes.
I like to explore long term cycles, and to see what others are trying. But I also try to remember that the statistical value is limited because we have too few data.
Danny
Thanks for the info Danny. Commodities do go their own ways but the secular commodities peaks were consistently broad based – and this fits with collective speculation. If the theory is correct then we should see all commodities lifted in the period close to the solar max this time round, so we’ll see. Yes it is an insufficient sample from history and so I share your caution and continue to always look for developments supporting it or not. However, the same occurs in equities: secular peaks close to the solar max. I believe that is the same phenomenon as outlined – which then gives us greater sampling from history if so. There is something about the solar minima that I need to look into more. There is a fairly common inflation spike around 5 years before each solar max – i.e. just before the solar minimum. Pro-risk assets appear to be bid-up into the solar minimum with a crash or low at the minimum following.
Commodities are in different groups with very different dynamics. There is the food stuff, a basic need. And there is the metals. The energy group is somewhere in between.
When a certain type food experiences shortage and goes up in price, then farmers can already respond the next year by planting more acres. When some metal comes in short supply, then it takes 10-20 years to develop a new mine.
People tend to eat and heat (their home) before anything else. So, when food and/or energy go up in price, then they have less money left for other things, which depresses the demand for metals (not a basic need).
When the price of food/energy comes back down, then people have more of their budget left to buy other “stuff” (purchases that were often postponed when food was expensive). So food prices down generally translates into more demand for metals. Depending on how big is the oversupply in metals/mines this may or may not push up the prices.
Because of this, the “food peak” and the “metal peak” usually do not come at the same time, but are separated by several years.
In periods of cold or cooling climate, people are typically more worried of getting the food they need (buying a bicycle or a car can wait). Then the food peak will often be higher than the metal peak. Prices are then not driven by “exciteability” but by “fear” (for food shortages). That fear is probably bigger near solar minima, which is by nature a more depressed/introvert era.
I think this distinction needs to be made if you want to come to a solid solar cycle based commodity price model.
I was thinking about some things over the weekend. Some tests to run but if someone already has done it and is willing to share then god bless:
1. Lunar returns around eclipses
2. Lunar returns as we traverse various zodiacs
3. Lunar returns when for example Mercury moves from Jupiter to Saturn
4. Lunar returns at conjunction with Mercury, Mars, Venus
5. Lunar returns as the energy in the sun changes i.e. calories etc. It increases at max and decreases at min (approx 1.92-1.96 calories).
6. Lunar returns depending on what half of the sun is active. Looking at the Maunder Butterfly diagrams the sun does not paint uniformly. What beautiful diagram those butterflies the sun sends at us are =)
Any ideas are appreciated
Robert,
1) somewhat higher risk for phase inversions around eclipses
2) better returns with Moon in Gemini to Scorpio, weaker returns Sagittarius to Taurus.
3 and 4) this kind of things can be tested with special software (usually rather expensive), or you can set up in excel for testing all kind of astrological combinations. Will keep you busy for years 🙂
5) no difference. Considering lunar returns in connection to known seasonal tendencies is more interesting
6) don’t know.
Thank you Danny for the input!
I was reading (plowing) some of George Bayer’s books during the weekend and found it interesting that he was using various combinations without computers i.e. from graph paper in the 30s. Anyone done some testing of his ideas?
Although a good point another guy from the 30s makes (Luther Jensen) is the following phrase:
“Someone claims astro-cycles all converge to the same position once briefly only every 26,000 years. It may be true but the point is no two cycles are exactly alike. Jupiter has its 12 year cycle but in the 12 years its apparent retrograde and forward paths aspect other astro-cycles without simple statistical repetition.”
Think I read something like that in Bradley’s books.