
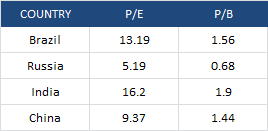
Russian stocks are currently very cheap. Firstly, they are the cheapest by p/e around the world in the table below (cheaper than when I last drew attention to them here), whilst paying a 4.5% yield:
 Source: FT
Secondly, they are also ultra cheap by cyclically adjusted p/e valuation:
 Plus thirdly, they are on a price-to-book ratio of just 0.68 (data as at 1st March). Anything less than 1 means that a liquidation of the entire index would return more in net assets than the current valuation. Something to bear in mind when considering how much lower they could yet fall.
 Source: Fool.com
Generally speaking historically, stock indices have been a buy when p/es have reached sub 10 and p/bs sub 1.5, i.e. they have returned consistently well when purchasing at these levels. So what’s up with Russian stocks that sees them languishing at extreme cheap valuations? Why haven’t buyers stepped in?
There are some ongoing broad issues with investing in Russia, such as a lack of political transparency, a corruption problem, and demographic issues. These collectively give Russia a risk premium, that can lead to cheaper ‘normal’ valuations. We can see this in the next chart, showing p/e trends over recent years for certain emerging markets – Russia has largely traded at cheaper levels to the others. It broke sub p/e 5 at the bottom of both of the last two cyclical bears, but the current valuation has not been beaten aside of these.

Compared to the other three members of the BRIC emerging group (of which China also has political and demographic challenges), the economic position in Russia stands up fairly well, with low debt to GDP and unemployment, yet it trades at a 50% discount or more:
 Source: Fool.com
Russia experienced a recession around the financial crisis of 2008 but has since maintained positive growth. That growth however is at a lower level to pre-2008, as shown:
 Source: Syz
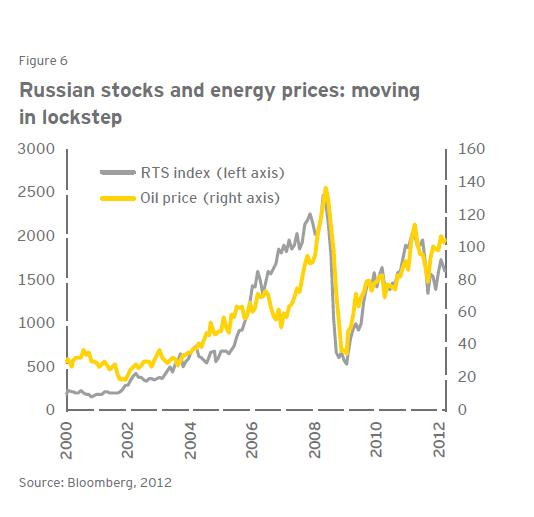
One reason for this lower growth has been energy prices. Energy contributes up to 25% of GDP and 65% of exports. It is the largest producer and exporter of oil in the world, and has the largest reserves and is the largest exporter of natural gas. Up to and into 2008, energy was ‘hot’ and Russia benefited accordingly. Whereas since 2008, natural gas prices have tumbled, and in the last two years oil prices have largely tracked sideways.
In the next chart it can be seen that the Russian stock index has a close correlation with the oil price, up to a 0.9 correlation.
 Three companies dominate the RTS and MICEX stock indices: Gazprom, Lukoil and Sberbank, of which the first two relate to energy. Therefore, both by economic weighting and stock index weighting, Russia is an energy play, and a key question is, therefore, where are energy prices headed? To partially answer that, let me also show the association in oil demand and oil price to GDP in both USA and China:
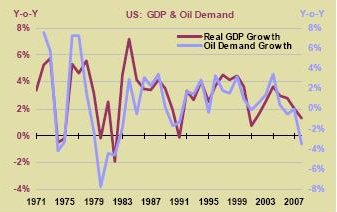

Global economic growth is a key driver of energy prices, and therefore expectations in growth become important to the performance of the Russian stock indices. In fact, Russia is regarded as a high beta bet on global growth. As growth spurts have been weak and short-lived over the last 3 years, Russian stocks have been sensitive to that growth ‘not sticking’.
Since mid-2012, however, we have seen a fairly sustained pick up in growth and this picture still persists in leading indicators today. Has the secular cycle rinsing process combined with sustained central bank supportive actions finally produced a new cycle in growth? It is normal for there to be a growthflationary finale to the current cyclical stocks bull and secular/solar cycling, bringing about a tightening in yields and potentially rates, so I see this as very much possible at this stage.
The action in crude oil over the last two weeks also suggests belief in some sustained global growth here, as it has accelerated on good momentum to a point of potential breakout. It outperformed stocks in this period and in the chart below we can see that the Russian Micex index got left behind:
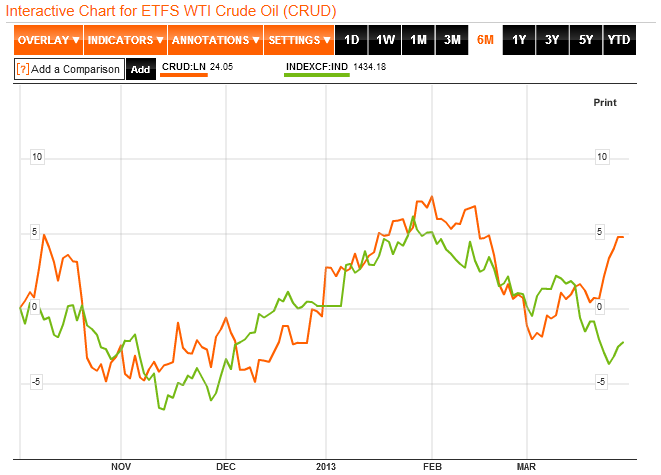
Source: Bloomberg
This is evidence that they do not move lock-step, and another glance at the RTS and Crude Oil longer term price correlation chart reveals that there are occasional periods where one can outperform the other. After all, both the Russian economy and the Russian stock index are not just about energy. So with that in mind, let’s take a look at leading indicators for the Russian economy as they stand currently:

Source: OECD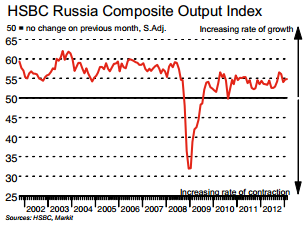
A pick up in the Russian economy, seen here, is in line with the general global picture, and confirms that Russia is not an outlier to be avoided.
Additionally, natural gas prices have been making a potential bottom, with a reclaim of $4 last week adding to that positive technical picture.

Source: Trading Charts
A technical advance in gas and oil prices, together with maintained positive leading indicators of growth, ought to drag up the Russian stock index. This is also a seasonally positive time for both oil and gas, with prices typically historically on the rise over the next couple of months.
Let me draw all this together. Russian stocks are very cheap by all three valuation measures, both compared to other countries and by their own history. The Russian stock index is generally a play on energy prices and a high beta play on global growth. Global growth and energy prices correlate fairly well, so we could simplify it and say that if global growth can be sustained here, then Russian stocks are an attractive proposition at this point. Alternatively, if energy prices can rally here (which they tend to do as late cyclicals taking over from stocks), then Russian stocks may equally be an attractive proposition.
If we are unsure about the prospects for global growth or momentum in energy prices, then there may still be a mean reversion opportunity here: Russian stocks could play catch up with the oil price rises of the last two weeks, and/or pull a little away from extreme cheap valuation as investors look for value. As an additional consideration, what would happen to Russian stocks under the competing scenarios of a secular commodities finale ahead versus a secular commodities bull over and a new secular stocks bull underway? I suggest that under the former they would be a late outperforming index due to the energy correlation, and under the latter they would suffer from any sharp falls in energy prices but ultimately their cheapness and momentum in global stocks would drag them higher (a rising tide lifts all boats) eventually. Under both scenarios such developments could take time, as patience is often needed for value plays.
Finally, this is a higher risk opportunity – Russia is not the most investment-friendly country, and is more at risk from an ‘event’. That said, it is the 9th largest economy in the world and as such a key player in the global scene.
OK, I have opened a long trade in Russian stocks today. The timing of this is also not far from the start of the lunar positive period, which provides an additional potential support for the trade. I am open on the timescale involved in this trade, as it could be a swift gainer or a longer term play of patience.

I have updated all models this morning. The Singapore Straits has been added to the models. A new page for the lunar research is now available.
I know taxes are like 10% in Russia. It is more capitalist than most countries in the world today. I also do not buy the framing of corruption in relative terms the rest. There was an interesting article in RT a few weeks ago outlining Putin’s strategy for the country which seemed “investor friendly”. He was going to have Goldman improve the picture of the country. Jim Rogers was very positive.
RT (but the article was better. google yourself)
Jim Rogers (he tends to be very off sometimes and spot on sometimes)
Thanks for that Robert.
Hi John,
This article will provide you/your readers with a glimpse of my 17.6 year stock market cycle. It includes a graph of spectral analysis of world GDP growth.
Based on this cycle I am looking for a low in 2013, but no new secular bull market until 2018 as mentioned before.
http://intel.harriman-house.com/investing/bulls-beware-bear-market-to-bite-back-in-2013/
Regards,
Kerry
Kerry, I liked your stuff with one caveat and that is that real and nominal prices. How does your research hold with nominal prices? I think less or am I mistaken?The same pattern shows up in real estate etc i.e. Herengerecht index. Key is what asset will lose the least value. In nominal term prices/trader prices things will go up but not in real terms.
Everything that adds inflation I think is tricky as the definition of inflation changes. If you have anything with nominal figures, it would be very interesting to look at. Many thanks for sharing.
Hi Robert,
My book “The 17.6 Year Stock market Cycle” has everything in nominal prices to avoid the issues you mention, and the cycle works perfectly from the early 1900s to now just like the 1982 to 2018 one in the article (1929 to 1947, 1947 to 1965, 1965 to 1982 with all the intermediate turning points in between).
Regards,
Kerry
Hi Kerry,
Do you trade for a living?
Regards
Bob
Hi Bob,
No I don’t. I’d like to but don’t have enough capital at the moment. I have the utmost respect for those who do (like John).
I invest my own pension plan and savings though. Although I missed out on a lot of the 2009 rally, I sold my shares in 2007 so I completely missed the 2007-09 bear market. IMHO market timing is the way to go until 2018 when a new secular bull market will begin and buy and hold will be king once more.
Regards,
Kerry
EVERYTHING is TIMING
Kerry, all my respect to your studies, I am in the same way, but the new bull market, as I have studied, only should last till 2023+-, in the 90-100 -years- cycle (1720-1835-1929 and so) Remember from 1923 to 1929. I will be in contact with you later on. Regards.
Antonio, there is a article at http://www.themarketoracle.co.UK by Ed Carlson. He uses the George Lindsay method. Lindsay is one of the few great market prognosticators (Edson Gold, Dysart, Bolton, Angas, and Gann). He comes up with 2023 as the beginning of the next 20 year bull market.
Hi Kerry,
I ordered your book and I’m excited to read it this week when it arrives. Just wanted to point out something related to your work, many folks look at past commodity cycles and count the number of years from commodity bottoms to commodity tops which gives a range of figures for past commodity bulls ranging from 15 year to over 23 years. I like to use 17.6 year cycle to determine the length of time to top of commodity cycle.
Here are some examples:
-Stocks peaked in 1906 (which started the bear market) and commodities peaked in 1920 which is 14 years.
-Stocks peaked in 1966 and commodities peaked in 1980 which is 14 years.
-This last one is a little more controversial because of the disruption to cycle as a result of great depression but.. Stocks peaked in 1937 and commodities peaked in 1951 which is 14 years.
So this falls in line with your thoughts that gold will peak in 2015, since the market topped in 2000. Gold and Silver always peak the latest as compared to other commodities, so the extra year to 2015 makes sense.
Hi Justin,
I use 17.6 years for the commodities too (1980 + 2×17.6 = 2015), glad to hear that we are thinking along similar lines. I don’t agree that stocks peaked in 1937, you’ll see this in my book, I hope you enjoy reading it.
Thanks,
Kerry
Hi John
Glad you and the family had a good time and are all back safe.
In the second table what does CAPE HISTORY mean?
Sorry if that’s a dumb question?
Will
Thanks Will. My interpretation was the date from which they have CAPE valuations for that index – for which they are creating average CAPE.
Hi John,
I think Copper is considered a better indicator of economic activity, and copper prices look very weak for the moment.
With Russian stocks I would be careful. Yes, a p/e of 5 looks very cheap. But oil and gas stocks in the US also trade at low p/e (XOM and CHK have a forward p/e of 10). The problem with companies like Gazprom is that they are selling natural gas to Europe at ~16$ (vs ~4$ Henry hub in the US). So, their profits are based on selling at artificially high prices, and that is coming under pressure already.
See: http://uk.reuters.com/article/2012/12/18/gazprom-europe-idUKL5E8NI1VY20121218 and http://www.risk.net/energy-risk/news/2206839/us-henry-hub-benchmark-to-drive-european-east-asian-natural-gas-prices-report
So the question becomes: what is Gazprom’s p/e going to look like once it has to sell its gas at $8, never mind $4 ?
Danny
Thanks for the info Danny
Good article, thanks John. I´m interestet in Russia for years and I think Russia is also (and more) a consumer story.
http://s14.directupload.net/file/d/3213/uu8drzkt_jpg.htm
Thanks for that, Rolandu
Hi John,
How would one buy the russian stock index? Is there a stock ticker for it or do you use futures?
I went with JPM Russia securities ETF – there is also Market Vectors Russia
Thank you John!
one of the big investors was once asked – why he was not investing in russia – and his answer was – “there is no rule of law”.
they have the same problem coming up as the rest of the world – a lot of debt was taken on by consumers and consumers are defaulting big time already. moreover, it is not uncommon to see a loan given out by russian bank at 80% rate, yes you pay 80% interest per year on a private bank loan. this is totally insane and not a sign of a healthy economy / conditions.
as a speculative paper play – in and out with stops and defined targets – sure. otherwise i’d think twice.
Is there but paper?
In 1974, the US stock market stood at 570, the pe was 6, the yield was 6%, and slightly below book. Edson Gould’s forecast for 1975 showed little bulls jumping around gold bars under the Christmas tree. They thought Gould had lost his touch or gone senile. That was THE bottom. Just as similar valuations recently made the Japanese mkt very interesting, these valuations make Russia look enticing as well.
Hi,
Thanks again for wonderful job you doing.
Regarding commodities and gold
This chart makes me wonder how much upside potential we have in gold in the next 10 years.

If one believe in prediction of climate cooling down the best play in 10 – 15 years horizon should be energy. In such scenario gold would be just money not commodity. In same way like it way money and not commodity in 1600 – 1700 AD.
best wishes
Thanks Pawel. Yes I saw that – based on limited ETF history hard to say if it is a reliable topping indicator, but certainly a warning sign.
If a bear market in commodities has begun, Russia looks set to experience serious difficulties. Shale gas being drilled in the US has already managed to suppress Oil prices. The IMF stated in 2011 that if Oil prices fell to $50 and stayed there, the Russian economy would plunge into a 1-2yr long recession.
Hi Pete,
One of the things that few people consider is that $4 natural gas corresponds to $23 oil based on energy content. So crude oil is 4x overpriced compared to gas for the moment. That’s why we see trucks being converted to using LNG and cars driving on CNG.
The question is: how will this difference get resolved?
Will nat gas go up in price, or will oil come down?
Or will they meet half-way? With $8 gas and $50 oil , energy content parity would be reached.
Danny
Thanks for that point, Danny. Very informative. I am inclined to think Oil may have lower to go, based on the amount of speculation it has undergone since the new Millennium.
To add to Russia’s woes, inflation is increasing, so interest rates may be pushed up. Industrial production has fallen in Jan/Feb 2013 too. The last time industrial production contracted was when Russia was entering recession. Further growth in the Russian economy may begin to depend mostly on consumers. Retail sales, however, have halved in 6 months, so a consumer-led recovery remains to be seen,
I find it fascinating how Russia Today has great ease at reporting on virtually any US/UK economic policies with negative connotations. It gives me the impression that RT is a biased media outlet. Reporting on Russia heading into recession is the last thing RT would want to report on, if they have a chance to point-score against the US economically or politically.