
Today’s exercise is a 3-way cross reference between price-book valuation (p/b), price-earnings valuation (p/e) and cyclically-adjusted price-earnings (CAPE) valuation of stock indices around the globe. I believe we are in a gradual process of transition from a secular stocks bear to a secular stocks bull globally, with the nominal low already achieved in 2009 and the momentum ‘go’ point likely 18 months hence or so. I am on the look out for timely points to invest in stock indices that reach p/es/CAPEs sub 10 and p/bs of around 1 or lower, as these mark secular extreme low valuations.
The first table is a list of some of the main country p/b ratios, as at the end of October 2012. Green – cheap, red – expensive.
 Source: Globe and Mail
The second table contains a more comprehensive list of countries, this time valued by CAPE as at the end of October 2012. They are in order of valuation from green/cheap to red/expensive.

Source: Megane Faber
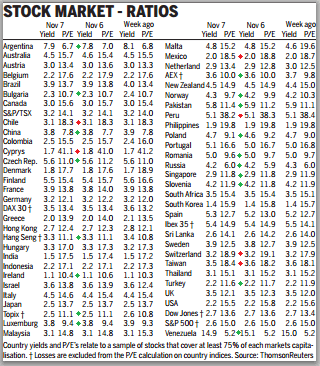
And the last table is right up to date as of the end of yesterday, showing countries valued by regular p/e and also by the yield of the country’s index. Peer at this to spot green markers against cheap countries and red against more expensive. It should be noted that because we are reaching towards the end of a global stocks bear market, there are very few countries that are truly expensive, as the historic average p/e is around 15-16.

Source: FT
What are the main takeaways, when cross referencing?
Pawel mentioned Turkey. It is cheap by p/e and cheap by p/b (though less so by CAPE), and this is after rising 40% over the last 12 months. Japan, particularly the Topix, is also cheap by both (though slightly less so by CAPE). Ireland looks to be the pick of the PIIGS, with a cheap p/e and ultra cheap CAPE (although it is yielding little). But there is one winner, extremely cheap by p/b, CAPE and p/e and yielding 4.2% to boot, and that’s Russia. The Russian stock index is most weighted towards energy, so aside the political risks, the key question is whether you believe energy prices can hold up ‘well enough’ looking into the future. I’ve opened a long position in JPM Russian Securities today.
On the flip side, Cyrpus and Peru are the notable ultra expensive countries, but two other countries stand out because of being relatively expensive to the others by all 3 measures above, and that is India and the USA. I continue to await the forthcoming rally in equities – which should occur whether this is a topping process or a bullish continuation, and if evidence grows for a cyclical bull top, I would look to exit my SP500 stock indices positions.

US CAPE ratio and Q ratio are higher than the average. By the way, I think those E of that equation is about to get a lot lower. Of course, this will affect the more generally used P/E metric versus CAPE ratio, but none-the-less, good luck.
“Two things most people cannot wrap their heads around – exponential growth and inflation-adjusted metrics.”
Problem is you are operating under the assumption that data (especially earnings) is correct and not manipulated, etc. Take a look at the FXI (China) daily or the EWH (Hong Kong) weekly…both saying be careful over there… http://stocktwits.com/message/10457158
It (manipulation) does not matter….matter is what people believe and if they can fancy richness and their own castle in the sky. That is the speculation game rule.
I know John (cautiously) follows the speculation game rule. Hence, a well deserved world tour.
Risk is to be embraced! Stocks are getting cheaper awaiting the next catalyst.
couldn’t disagree more…probably a bounce between now and year end (maybe a couple and maybe a BIG one but should stop short of new high)…seeing so many people buying on book value, PEs, dividends, etc reminds me of those buying the dip in BAC, WB, WM, C, etc back in early/mid 2008 as they subsequently went down 70-90% (or under)…just my opinion, follow the charts not the other crap.
Could not Agree more. Fundamentals = Funnymentals. As if the US market and accounting is not manipulated or whatever you call it. Shit gets pumped and then it gets dumped. That is how the markets work.
Rally? Yes, but, first DOW must visit 12.000-11.700, and after a rebound to 12.500 or more. I expect the top we saw in sep12.
Enjoy your travel.
Personally Antonio, I have been targeting early November lows and I feel we have probably witnessed the low today especially on the S&P. I went long yesterday and again this morning and I’ll be looking for prices to peak sometime in December before we start falling south of 12,500 on the Dow. Just my opinion. No doubt we may retest the lows or thereabouts again early next week but I’m staying long for the next month. Everybody seems to be expecting immediate and dramatic market falls so I prefer to be contrarian. I may proved wrong next week but I’m still expecting a prolonged ‘topping process’ to play out till mid to end of December. Ten down we go 🙂
Hi Jonathan,
The feeling in the markets and the consensus scenario is a little retracement to buy and hold until 2013 or at least to the end of year or beginning13 before a dangerous bearish market in US the most in 2014
The DOW cycle is lagging,I imagine, because the US elections, before de QE3, etc, all in the same brush, but since summer is time to correction, about at least -25%, in this case -30% or more, target DOW JONES 8.500-9.000, after a big drop in the 9th year of the 1st peak (2000), and after a rally about 100%, in this case more, as more was the drop.
Possibly you are rigth, i know thw dates for this bottom, from now to mid nov12, iven 23th, but i,m hoping for that´s levels.
If we go up, i´ll add more shorts positions.
Regards, Scottish?
Hi Antonio,
Yes, I am Scottish for all my sins even though I’ve spent the last 6 years of my life in the wonderful city of Madrid, Spain. You’re Spanish, right? I’m now relocating to Dubai however for my work.
As you say, the cycles are a bit out this year and possibly due to all the manipulation and excessive money printing which I expect to increase over the coming months. I sometimes think I can even hear the ECB’s printing machine warming up at times 🙂
I’ve been looking at my charts this evening and my observations are these. The S&P 500 will bounce here where there is general price action support on the daily – price is currently supported by the 20 day trading range. Also, we are bouncing off the 200 day moving average which adds another layer of support. This double support should offer decent protection for longs.
However, should price fall through this level, then I think we may test 1,335 and that could happen Monday or Tuesday. Either way, I certainly don’t think we’re heading below 1,330 on this retracement but once the Christmas rally is over with, then who knows? I mean, what do I know? 🙂
¡Buenos noches, hombre!
I´m glad to contrast our analysis. I bet the US index must bottom this or the next week +-, but i see a medium correction about -10% in the Industrials, at least! from the oct12 peak, but after a rebound. The final target is in 2013, about 9.000-8.500.
I hve explained past weeks in this nice bolg my idea, the cycle, about the DOW.
I´m spanish, i´m from the Basque Country. How a bout Madrid? Tell me about your work. Do you work on markets?
With John´s permission my email:
apanalis(no me deja poner arroba)gamail.com
I think the biggest here to notice is on the “FT” article. Notice it says losses are excluded. That makes the data worthless, given they ignore all companies operating at losses. Granted, you may argue that it balances, since they do it for everyone. I’d have to disagree. Imagine if one country is operating at 95% for profitable companies and another only at 10%, they would clearly not be comparable. Only if the countries were operating at 50/50 would it be a fair comparison, but I do not believe this to ever be the case.
Just a thought and something to be aware of!
Great post though. I will be fully removing myself from any “market” equity exposure in Q1 2013.
One thing I have posted on this blog on numerous occasions is the $SKEW to $VIX ratio relative to the $SPX. Over the past two years they have moved together perfectly.
Anytime the ratio gets above 9 it has been an indication that fear is gone. It is a contrarian indicator. Each time it has 9 we have seen the market peak out (in and around the time the ratio hits 9). This has occurred perfectly in 3 times in two years (April 2011, March 2012, and twice hit in August and Sept 2011).
When the ratio gets below 4.5, it has been a buy signal. At present, we sit around 6.3. I believe we drop to 4.5 bearish extremes before we catch any significant rebound. What does that equate to on $SPX? I do not know, but this indicator is telling me downward in the near term.
Here is the chart, I posted it on my twitter page:
Like. Thank you very much for sharing.
very nice chart! thanks so much for sharing.
Which is your target for DOW and Sp500 in the short term- a week, or two as most
Thanks
I don’t make those calls because I’ll end up wrong. I just think we are going down.
No targets? Do you have shorts positions? Thanks RK. Nice chart.
I am short (via option spreads) SPY and TLT. JAN13 and adding into 2013.
I am also on StockTwits and have posted some charts indicating why I am bearish equities: technicals, valuation, earnings and revenue are all telling me there is little value here and other assets have more value.
I believe sometime in 2013 we begin trading like a European country (Spain, Italy). What I mean by that is bonds prices and stock prices become much more correlated and the idea that when stocks are selling off the best “risk of” asset to pile into is bonds will now not be the case.
If I am incorrect on this thesis, than I do believe (at minimum) that if you should own both stocks and bonds and have the position beta weighted (everything being equal), by years end of 2013, you will be a net loser.
Point is, low yields and high stock prices will come to an end in 2013.
John, I have sent you an email.
Gr8 article presenting for and against arguments over Chinese recovery accelerating in 2013. Bullish side argue that tightening in 2010-11 has only produced a soft landing and that growth in Q4 will be higher than Q3.
The leadership transition ending by March 2013 could prove even more bullish for China, as the new leader will be at the helm of an economy with a rosy outlook, whilst there’s still enough space for more interest rate cuts should growth disappoint.
http://finance.yahoo.com/news/chinas-leadership-usher-bull-run-070010519.html
If growth picks up by late 2013, the Shanghai Composite could have soared to 3,000 points by 2013. If this is the case, I’d expect PMs, Oil and Copper to rise, and inflation would start reaching dangerous levels by 2014-15, precipitating in interest rate hikes which may cause the slowdown which may kill the commodities bull for good.
It is interesting that ERUS (ishares Russia ETF) Fact Sheet shows price-to-book ratio of 2.6. This is siginficatly higher than the Globe and Mail article which shows a P/B of 0.8 for Russia. I would expect some difference, but not to this extent!
In the latest Hamish McRae article for the Independent on Sunday, he said he believed China was now growing at an annualized rate of about 8%, pointing to steel production and electricity consumption being up on the year before.
Thanks everyone for great comments.
Updates for the start of this week:
Conference Board UK leading indicators rose again this month
ECRI US leading indicators pulled back last week but still over +5
OECD leading indicators point to weakening global growth but stablisation in China
US earnings beat rate has dropped back to 59.8%
Drought continues in US affecting wheat
Couple of Sentimentrader indicators point to reversal in US stocks
Daily Sentiment Index reached just 10 for the Nikkei
No change in my view. Whether this is stocks in a topping process or correcting in a bullish continuation, there will be a rally ahead, and if stocks are topping we should then see negative divergences accompany that rally in terms of cyclicals underperforming and breadth dwindling, ideally on a slightly higher high.
Greece’s P/E valuation of just 2.36 is a tempting buy, as it’s essentially dirt cheap and could lead to great gains at some point, but traders are very wary anyways. They are of the opinion that until the Euro Zone implements real reforms, European stocks are risky, as they could remain depressed for years, so watch out if you think it’s a good idea anytime soon
Pete: In a losing game such as trading, we will start against the majority and assume we are wrong until proven correct. Positions must be reduced and removed until or unless the market proves the position correct. Trading is a losing game and the best loser is the big winner. The biggest losers are on the familiar side on the popular side of a trade.
I like this