
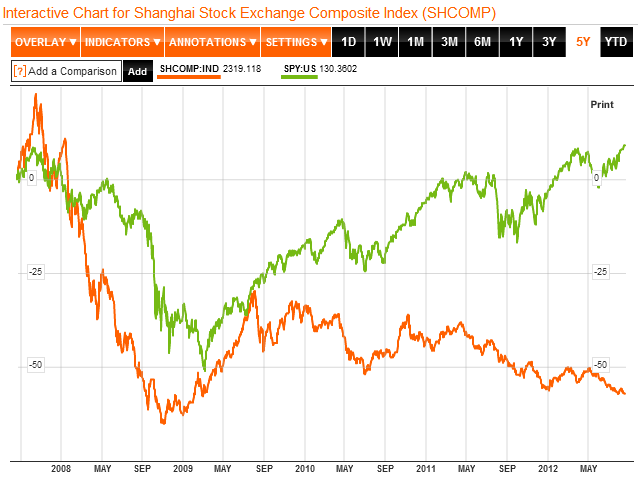
…for US equities? As we stand, the SP100 already made new highs. Apple has since broken upwards to new highs. The Nasdaq, Dow and SP500 are all back at their March 2012 highs (the SP500 including dividends is now at an all time high). Either it’s time to get out of all US stock indices longs, or the melt up is just about to begin. In stark contrast to the US stock indices predicament, the Chinese stock index is at 3-4 year lows.

Source: Bloomberg
Supportive of US equities breaking upwards from their March highs, we have (i) global and US economic surprises still in an uptrend, (ii) Spanish and Italian CDSs still in a downtrend, (iii) money exiting US treasuries as 10 year yields have risen from 1.4 to 1.8 in just 3 weeks, and (iv) ECRI US leading indicators trending upwards, almost back to positive:

Source: Dshort / ECRI
Turning to global leading indicators, this last week’s data from the Conference Board delivered positive readings looking forward for USA and Spain, but badly negative readings for Japan and Korea. So it is unlikely that US and European equity advances are based solely on hope for QE in those two regions. This East-West divergence is likely to be resolved one way or the other: Asia and emerging economies turn up, or US and European equities top out. So which is it to be?
I deliberated on Friday at the new moon about whether to take some profits, but decided against. Geomagnetism is currently tame and it means the lunar-geomagnetic model currently has a mild uptrend into mid-September (all models upated this morning). Furthermore, the occasions historically when lunar phasing tends to fail in trading are usually when there is a strong up or down trend. Clearly lunar phasing is not the only influence on trader sentiment, so in times of strong momentum one way or the other lunar phasing may be overridden. The current crawling up the upper bollinger band on US indices is reminiscent of the strong uptrends of the last two years that followed mid year consolidations. So I am suggesting there is a chance we are in a similar sweet spot for stocks.
I maintain that two developments would bring about a melt-up: (i) breakouts to new highs, into clear air and (ii) a turn up in leading indicators. German leading indicator data has just been released this morning, coming in at minus 0.8. That’s worse than last month’s reading and adds to the muddy picture in global leading indicators. So whilst a breakout to new highs in US equities looks technically more probable than a double top here, we can’t say we have the support of the global leading indicators. For this reason we see certain global stock indices still festering, and the likes of copper still languishing, rather than a full risk-on party.
What if global leading indicators didn’t turn up? Is it possible we could still see my forecast come good of an overthrow peak in equities in late 2012 and then a secular peak in commodities in 2013? Something like in 2007-8 where stocks first outperformed and then peaked whilst commodities took over and peaked longer and higher?:

Well, looking back to the last secular commodities peak of 1980, both stocks and commodities did make such moves even though leading indicators had been trending downwards for some months. In other words, speculation drove them on despite the worsening fundamentals, and this fits with my theory that increasing sunspots into the solar peak brings about speculative climaxes in risk taking and buying.
Getting technical again, US stock indices do not yet show overbought or overbullish readings. Were they to reach those levels, I would be much keener to offload some longs and take profits. The Euro is also showing signs of solidifying its base above 1.2 versus the US dollar. Gold is similarly building up its base and as can be seen below could be close to a break out of horizontal resistance, having successfully broken and backtested falling resistance.

In summary, at the moment the general overall picture is supportive of my forecast and my long pro-risk positions. Whilst there remain issues and areas of doubt – as there always are – I feel comfortable sticking with my trades as they are for now and continuing to watch indicators and data for further developments. We are at another siginificant point however, in whether US stock indices (and gold) can breakout or are sold back. Whilst a failure (in both) would be a set back for the bulls, it may mean more time is required, rather than it isn’t going to happen. But for equities bears this is the last stand and if this is to be a major double top then we should look for overbought and overbullish readings coming to pass as well as increased negative divergences supporting the exiting of longs.

A wonderful post as ever John and thank you for taking the time to answer my queries. It’s going to be a really interesting week this week because, for me, it’s going to shape the next month ahead I was really expecting to see some weakening across stock markets. Nominal lows were tested across a number of indices yesterday only for the bulls to come surging back in to bring price back up to where we are now. How often has this now happened during August?! We have the FOMC this week and so I was also anticipating weakening demand into that but I’m simply not seeing it yet.
Whatever happens, I’m targetting buying opportunities from early next week whether we’ve fallen back a little or not as, like you, I’m expecting a bullish September across most assets. Traders will be back at their desks following a long summer, we’re going to break out of this range and I favour to the upside due to strong support below and I still anticiapte QE in one form or another. I do not see any strong oversold conditions at the moment and certainly no reasons to short. In fact, I’ve been long for 4-5 weeks now.
Cheers,
Jon
Congrats on the longs.
I am watching closely if DBC (weekly closing price) can break the down channel formed since April 2011 as a very simple yet reasonable confirmation for our hypothesis that commodities may rise into 2013 for the grand finale.
For as long as SLV doesn’t drop below $25, the hypothesis may also be shared by the PMs.
The TLT reaction is so weak that the path of least resistance is down.
I am adding to my risk-on position today!.
Walking up the Bollinger Band would be the wicked plan of Mr. Market to cause max. pain to the bears and a panic to the under-invested money managers.
I see plenty of reasons to short. I’ve just shorted Apple right here with some OTM puts Jan 2014 expiry. I plan to short a lot more of this super parabolic when it starts breaking down.
There will be times to short Tiho but, specifically, now is not the time for me. I don’t like carrying mid-to-long term underweight positions and this market could go much higher yet. I make a few trades each and every week and I’m usually out of them by the weekend (I do hold FTSE longs on a Dec ’12 contract however). The trend for me in the short-term is still clearly up even though I’d argue that we’re in a ranging to a slightly up-trending move across a number of instruments. For me to go short, I’d need to see the S&P close below 1,400, the DAX below 7,000 and the FTSE below 5,800. We just keep breaking higher and higher. For now anyway.
I know your time-frames are longer than mine as I read your blog frequently but I like to see the market turn slightly before getting in. I guess that makes me a momentum trader 🙂
Hope you’re well!
I completely understand. The beautiful thing about the market environment is that we all see things differently, with different strategies and in different time frames. When you trade from week to week, as you have stated, you just follow trends and there is no reason to bother with global economy or business cycle fundamentals, majority of time.
For me, I see a a huge storm unfolding post elections not just in United States, but a disaster in Europe with default / bankruptcy and in China with major slowdown, if not a property crash. In hindsight the up and coming global event will be obvious to all when it occurs sometime in 2013/14, just like 2007/08 was obvious to everyone in 2009.
But today, it is a contrarian theme and hardly anyone sees it coming / agrees it will happen. Many claim central bankers can and will stop it as they print money. As I watch CNBC everyday while I work I notice that hedge funds are more concerned “chasing” performance, instead of looking at the future fundamentals. It is like driving a car with a rear view mirror in a sense.
Regardless, I always wish everyone the best of luck, much success and a lot of profits!
August 23, Scorpio Mars.Will the Trend has changed. August 26, Mars triangle Neptune gold move up the dollar decline should be starved
Hi Tiho
I think you are right.
I hope you are wrong.
regards
bobc
So stocks faked out yesterday whilst precious metals and the Euro broke out and held. The Nas and Dow and Sp500 all made new highs and then swiftly reversed back under. As it was the bears’ last stand a slice through at the first attempt would have been more surprising. The SP100 and Apple both held above their previous breakouts. The precious metals breakout fits with the overbearishness in that class. FOMC meeting minutes later today.
I partially rode the DAX short this morning before getting out. I have modest targets but targets I try to hit every day.
It’s kind of interesting what to expect from the FOMC going forward into the US elections. Markets at the moment are too high for any QE and so I can’t see how it will be delivered. Therefore, is it unlikely that we’ll see a sell-off – perhaps only a mild/average one – before Bernanke has to act. If Bernanke prints now, markets move up then collapse after October, there is no ammo left. Surely, he has to wait and let the markets move freely for now?
What do I know?! This is the reason I generally just trade the trend day in, day out. 🙂
Thursday update:
FOMC minutes strongest hint yet of QE3 – gold and Euro added to gains – stocks reversed falls and are still within touching distance of the highs.
Treasuries gained on the same news – though if QE3 is implemented, QE1 and QE2 actually both led to treasuries falling – and pro-risk gaining.
China PMI data reading more negative today – a bad reading – but CB leading indicator data for China came in at +0.7, pointing to a modest rebound in H2 2012. Overall mixed.
Eurozone PMI this morning barely changed and still negative.
AAII and investors intelligence readings this week both came in more bullish, but neither into the high zone that would signify a pullback, suggesting stocks could rally further yet.
For now, no trade changes.