
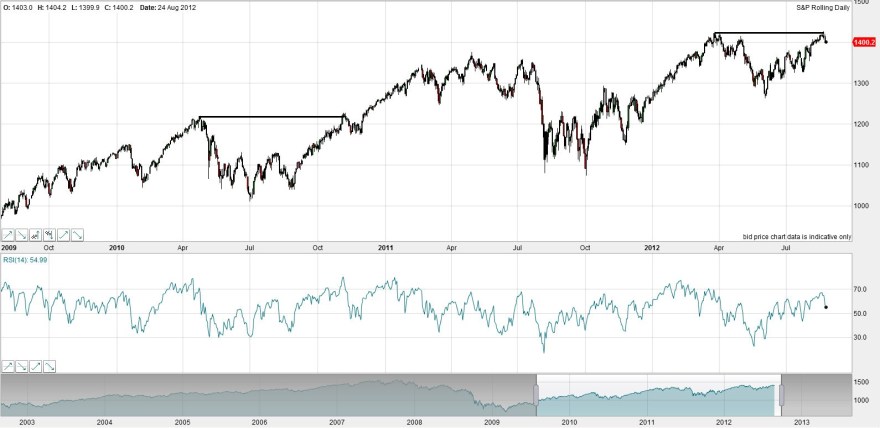
1. Twin highs in the SP500 and Nasdaq in 2012 roughly 6 months apart are similar to the mid-year action in 2010, highlighted below. In 2010 when the indices revisited the high, they needed a couple of weeks to consolidate before making a second attempt and successful breakthrough. So let’s see how the current action shapes. Next Friday ‘s Jackson Hole has the potential to be a catalyst for a breakout roughly 2 weeks later (if QE intentions announced) – or of course a disappointment.


2. Below I show how Conference Board leading indicators have developed in recent weeks. Japan and Korea are bad, sticking below -1. Euro are as a whole has remained at -0.3, but within that Spain picking up and Germany dropping. Australia has improved, US and China have oscillated, but the latest table has doubled its ‘greens’ to 4. It’s still a more negative picture than positive, but the key is whether a positive global trend can emerge.
24 August:

31 July:

17 July:

Source: Conference Board
3. The gold price in Euros has popped over its multi-month declining resistance.

Source: Goldprice

QE3? The US economy is stronger until jun12, so FED no action. DOW target, 9.000-8.500? end 2012 or beginning 2013, after recovery until 0,618, or 0,76 in 2013.
I´m sorry, John, but my point of view is so different, but thanks for your work.
Now, from South Spain, Marbella
I believe the last statement by the Fed regarding the economy is that it’s not performing the way they would like it to, especially regarding employment. If unemployment were lower or at least trending lower, I believe you’d be right, there would be no chance of QE. But with the employment situation the way it is, I think the question of action/no action from the Fed at this point is a toss up.
Unemployment is retarded indicator. FED will act as in past, when markets falls 10% 2010, 20% 2011, at least 30% 2012-13
Sorry, my name
So are you short stocks Antonio, as per your unchanging view of down H2 2012?
That´s right, short in DOW, Russell2000, Nasdaq and basic materials; long in VIX.
Closed my short positions in 12.100in june in DOW.
The 2011-12 drop in gold looks like a bear trap bottom with a rounded base, before the big surge up to end this secular bull. One thing I don’t quite get is how gold bulls claim Gold price rallies are triggered by fear, whilst others say gold rallies happen in stable economic climates.
This could make the timing of the parabolic surge very difficult to calculate. John, do you think the parabolic rise will happen during a period of panic like 2008 or a period of stability?
It should be growth, inflation and speculation into and around the solar peak, then recession afterwards. As stocks normally turn down ahead of a recession, that fits my forecast of them topping first. Energy and agri and metals rapidly rising should do the job of tipping us into recession. Gold should make its parabolic rise based on inflation (other commodities rising) – rather than a deflationary hedge. There may be supply side push in terms of war in oil sensitive regions and further climate based agri push.
ECRI leading indicators now up to -0.1 for the US, in a 6 week uptrend. In 2010 and 2011 two trips to -10 didn’t bring on a recession.
Gold target 1.100-1.200 medium term,after in some years near 9.000$
You can see the same chart from 60s from 25 $ to 190, after 110-120 and finally around 900.
History repeating again.
John, your solar model can be aplied to 70s-80s,you have the key in your hand
That’s right, but I don’t come to the same conclusions as you. Draw together the last 3 secular commodities bulls, not just the 1970s and here is the aggregated forecast for this one:

what is geomagnetism in this table? It is not solar magnetism which would be max at solar maximum.
It is solar geomagnetism – there is a time lag between the sunspot peak and the geomagnetism peak.
What is source of geomagnetism dataseries you are using? Is it planetary a-index, Ap, Kp or smth else ?
Planetary A
Some thoughts…
The SKEW to VIX ratio has touched the 9 level three times in the past two years. Overlaying the chart of the S&P 500 shows that when this occurs, the index has fallen 250 points in 2011 and then 120 points in 2012 just a few days after this occurred (closing prices).
On 8/17, we crossed that 9 threshold yet again, for the third time. I suspect we could retest the 1260 before we get QE3 or something from some central bank (ECB, PBOC, etc).
Also, if you overlay a chart of the quantity of stocks above their 200 day moving average and the S&P 500 over a 5 year period, one finds that in this rally since 2009, each time the S&P makes a new high in each leg of the rally, stocks above their 200 day ma does not (making lower highs unlike the market which is making higher highs). This is an obvious sign of internal weakness.
In due time…
Sorry about the double post here but in regards to the SKEW to VIX ratio – in 2012 it took a couple of weeks for the SPX to make new highs before we had the April correction, where in 2011 it took 8 days – to be more specific as we come up on day 7 of the ratio hitting the 9 threshold.
Turning points Dollar index vs. some assets.
http://stockcharts.com/h-sc/ui?s=$USD&p=M&yr=10&mn=6&dy=0&id=p35237541670&a=275588881&r=1345881436810&cmd=print