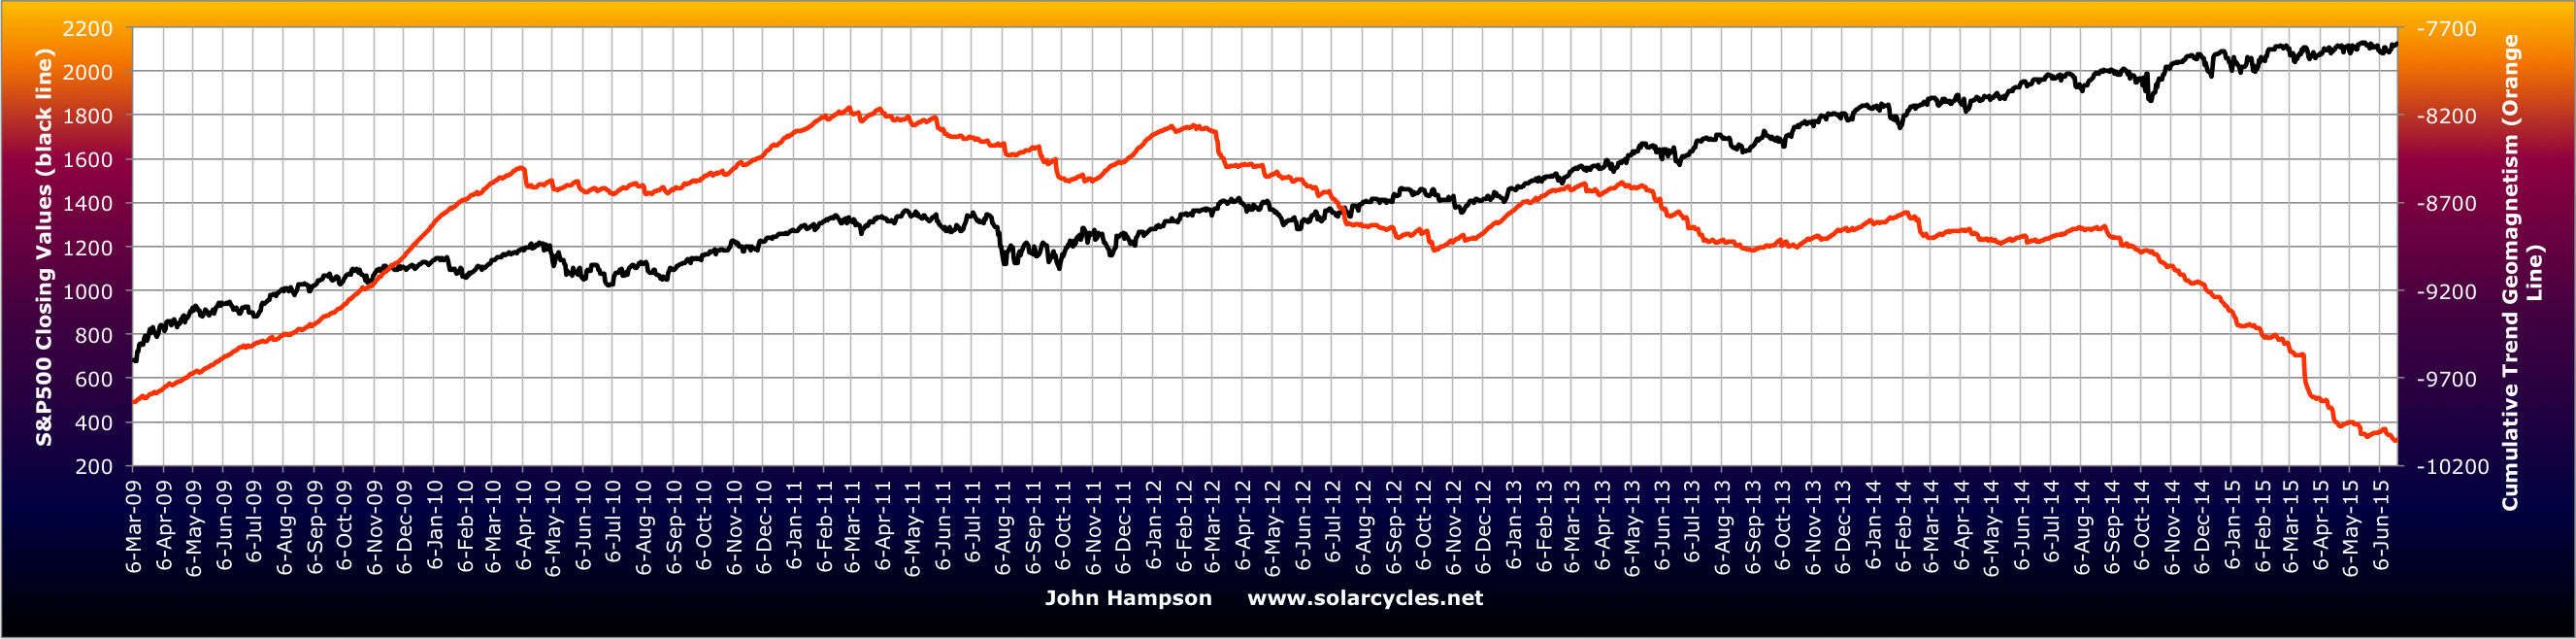
Evidence reveals the financial markets to be ‘dumb’. Long term trends are dictated by demographics (swelling numbers of buyers or sellers) and solar cycles (influencing speculation levels amongst participants). Markets top out when there are no new buyers left and/or no room or appetite for existing buyers to increase debt, and bottom at the opposite. This contrasts with common wisdom that markets are instead dictated by central bank actions, economic indicators, or company fundamentals. They play a role, but the evidence shows that the stock market leads the economy, that central banks are typically behind the curve, and that stocks rise purely on multiple (valuation) expansion if there is either swelling leverage or swelling buyers (or fall vice versa).
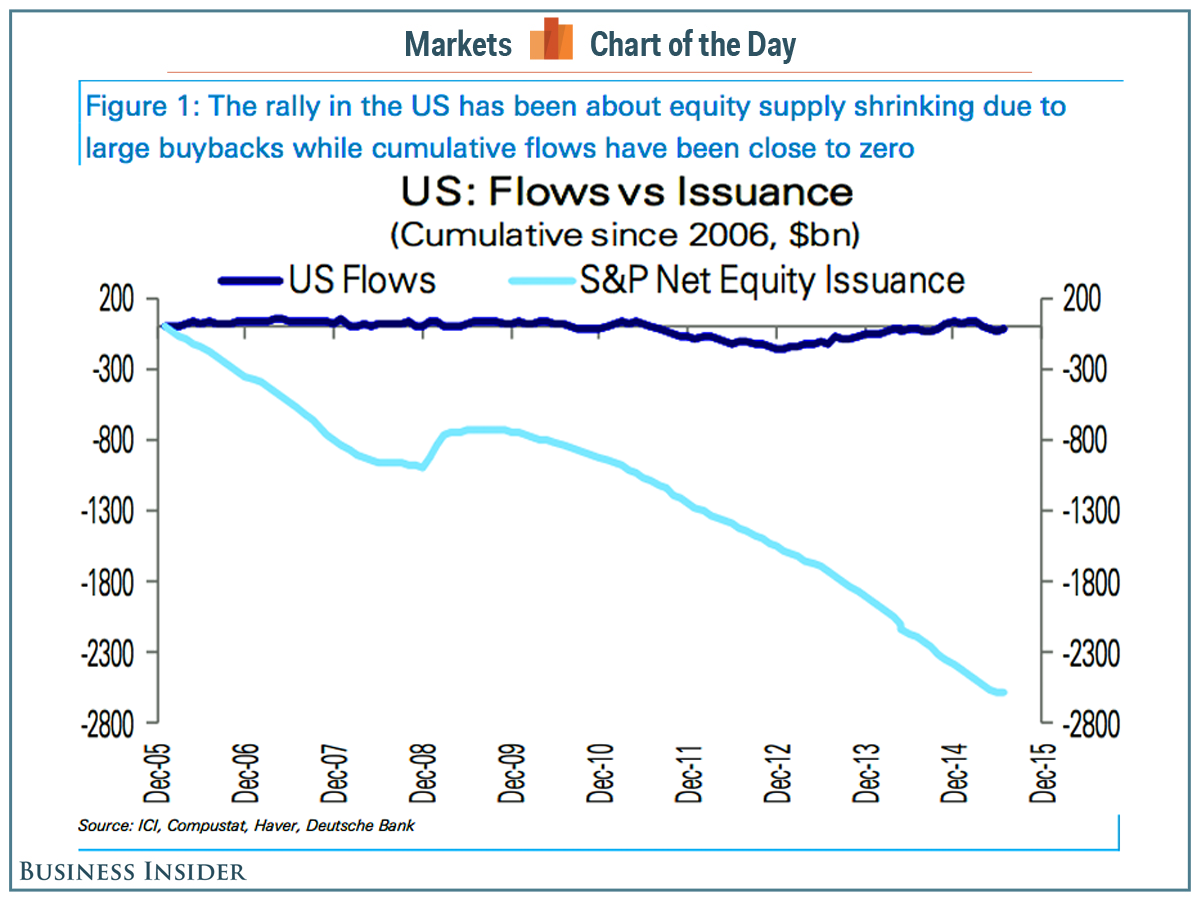
Into 2014’s solar maximum we saw a speculative mania in equities akin to the last solar maximum of 2000. But unlike 2000, there was no demographic tailwind, instead a headwind. Without new buyer flows into the market, we have therefore seen equities bid up by (1) existing buyers leveraging up and (2) companies buying back their own shares.
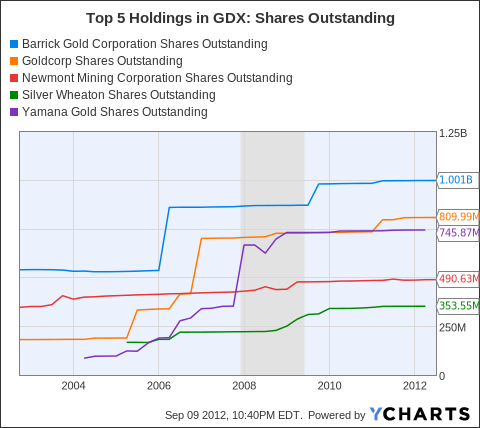
This chart captures the flat money flows as predicted by demographics versus the declining share issuance due to buybacks.
 Source: Business Insider
The effect of buybacks is to increase EPS and decrease P/E. The latest earnings show a blended 1% decline YOY, but without those buybacks the figure would have been closer to -4%. Revenues declined 3.3% YOY and reveal a truer picture of companies performance. Additionally, companies have largely borrowed to buy back their shares, making this market fuel particularly ‘unhealthy’.
Buybacks are likely heading for a new record this year, beating the 2007 record. This may partially account for stocks continuing to levitate despite all-round deterioration in other indicators.
 Source: Bloomberg
The other fuel source has been increasing leverage. We can see that leveraged loans peaked out around last year’s solar maximum:
Source: LeveragedLoan
Whilst margin debt lurched upwards again in 2015 to a current April high.
 Source: D Short
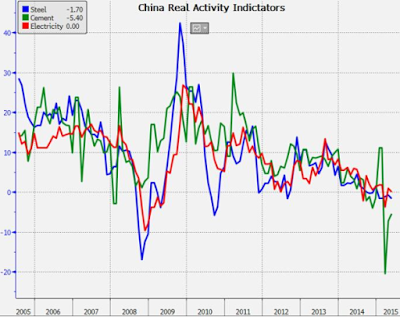
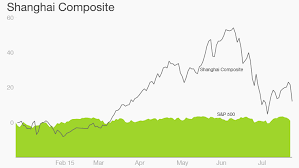
Meanwhile in China margin debt went crazy and can be seen to be wholly accountable for the rise in the Shanghai Composite. This too fits with demographics there: no new buyers, only existing buyers leveraging.
 Source: FX Street
The subsequent collapse in China’s stock market shows what happens when there is no room or appetite for further leverage amongst participants, which brings us back to the top of this post. Then, when leverage starts to unwind, it brings about forced redemptions and thus more selling, as it is effectively a ponzi scheme.
So the question is when leverage in the US and elsewhere starts to unwind. Based on historical evidence, appetite for leverage should wane post solar maximum. We see that in leveraged loans above, but margin debt has rallied further. We know from 1929 that leverage extended a year post solar maximum before collapsing, whilst breadth deteriorated over the same 12+ months. We are again producing that kind of outlier extension, set against a similar ongoing breadth deterioration since the solar max of last year.
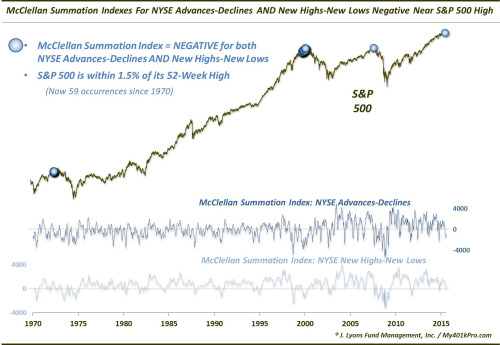
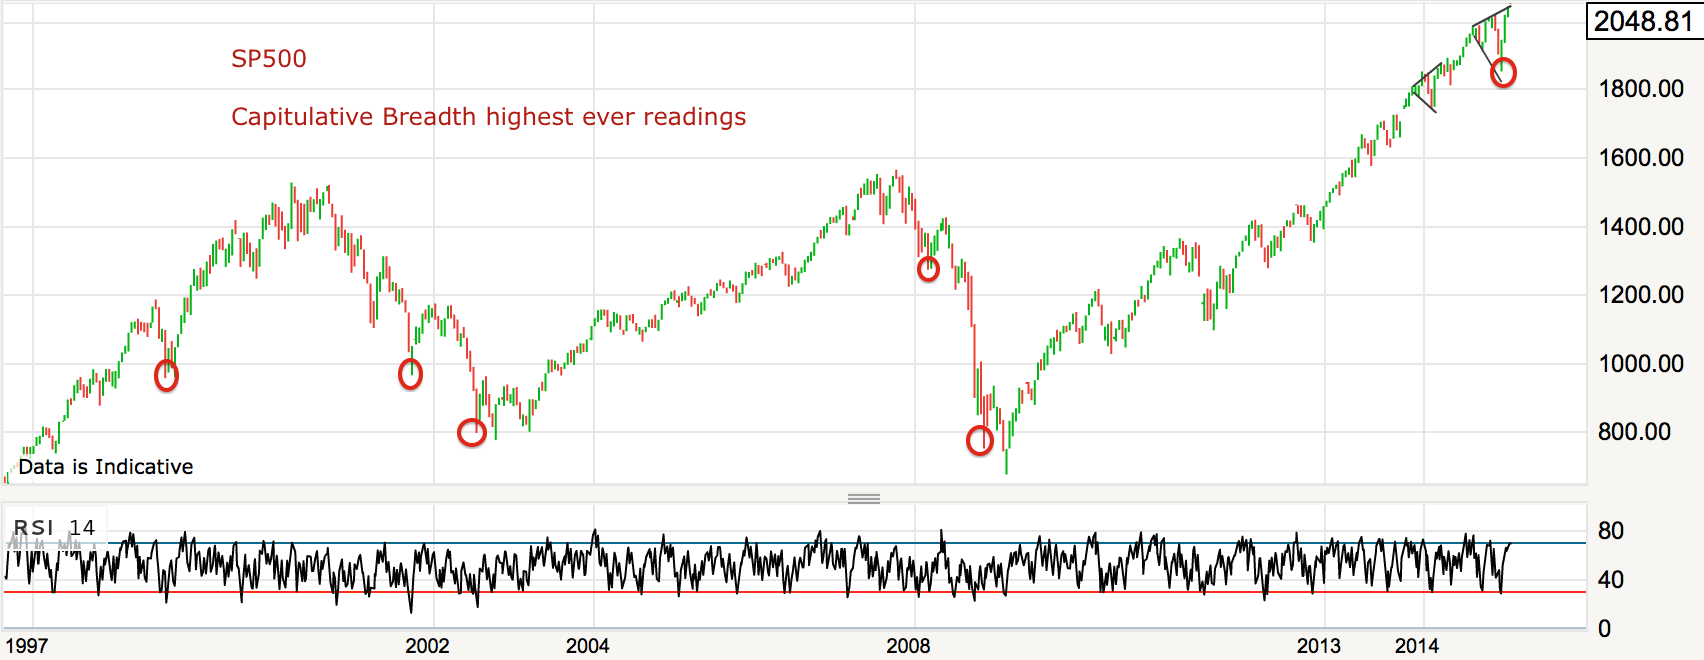
Either the sideways range in US stocks in 2015 is the pause that refreshes the bull or it is the topping process that turns into the leverage reversal inspired sharp declines. Solar-aside, there have been so many indicators that this is a market top, sharing characteristics with 2007, 2000 and other major historic peaks, that a bull pause is highly unlikely. But what’s different is that the interest rate, QE and inflation environment, together with commodities relative performance, hasn’t been seen in 50+ years, if this is to mark a top. However, rather than that negating a top, we simply need to look further back in time for reference points. Yet, if the stock market is a dumb mechanism, then we shouldn’t even need to do that.
The solar max produced the stock market mania. Demographic trends meant it has been fuelled by leverage and buybacks. The flat market of 2015 suggests saturation has been reached. Post-solar max, appetite for speculation unwittingly declines. China has broken and all markets are off their peaks. The last several weeks, indicators that have worked for the bulls over the last 2 years haven’t been working. I think the fuel is spent. Buybacks and margin debt are the key here, but both data sets come out with a lag.
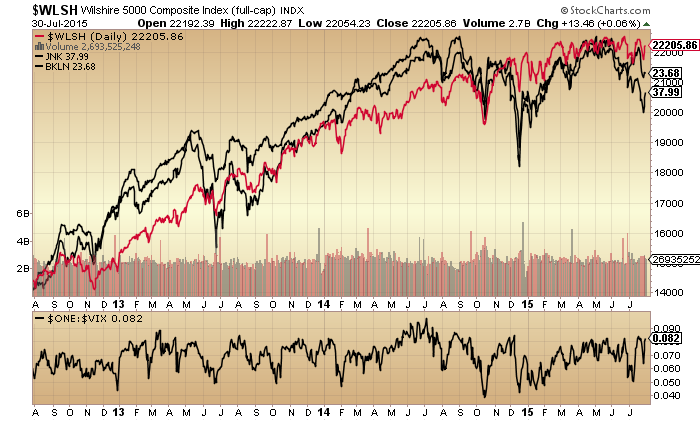
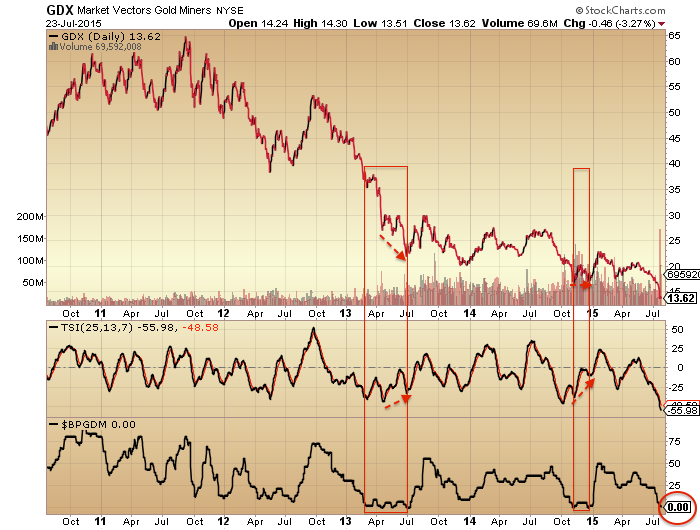
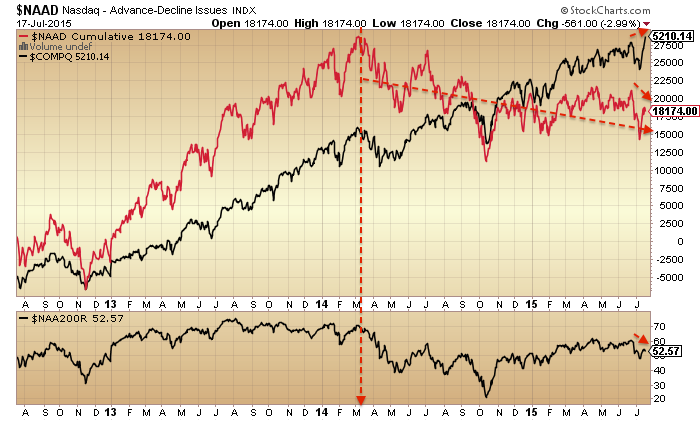
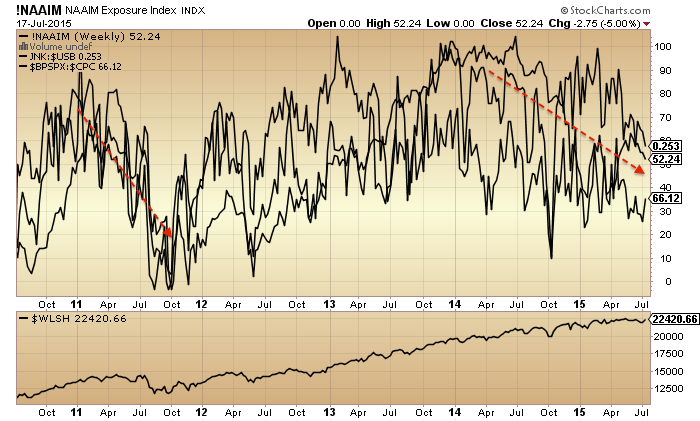
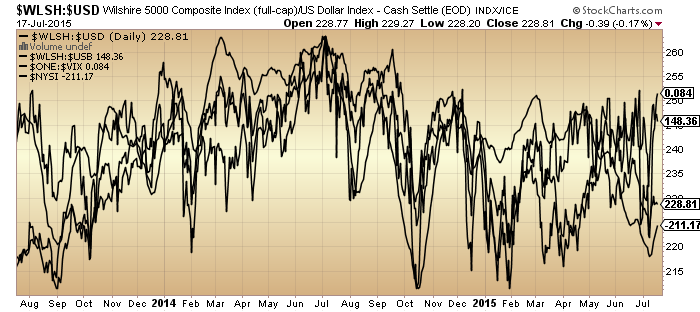
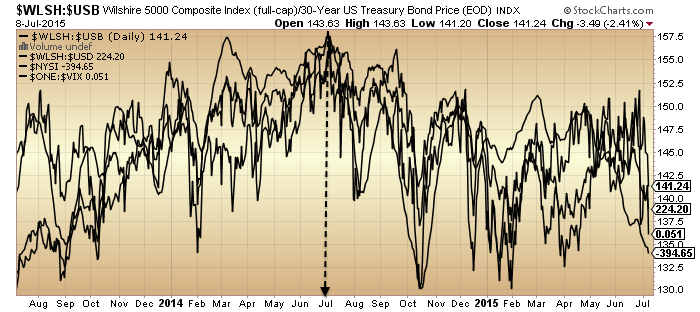
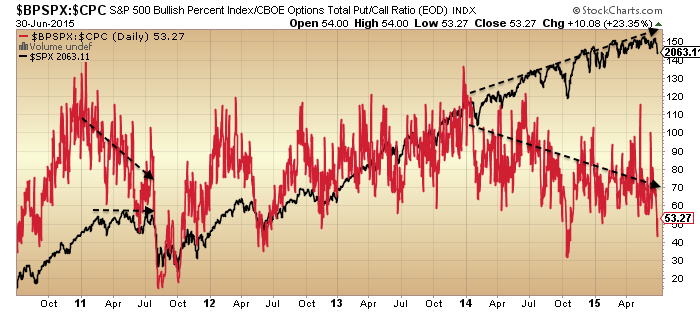
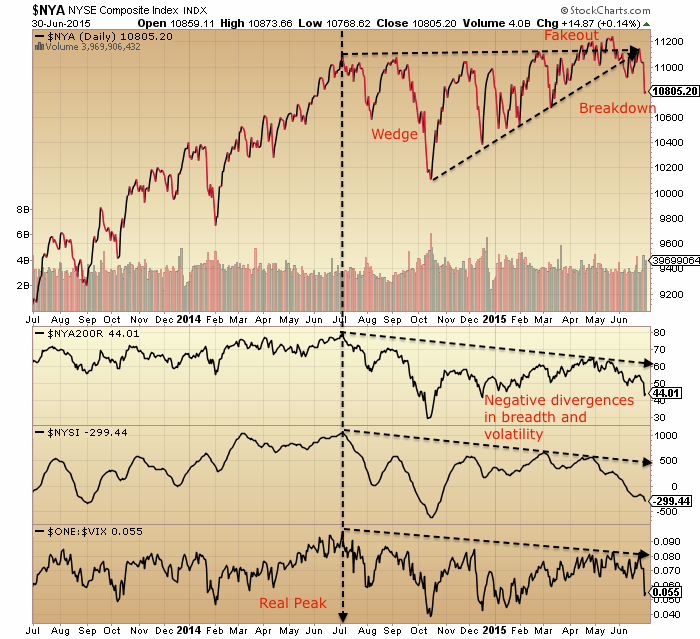
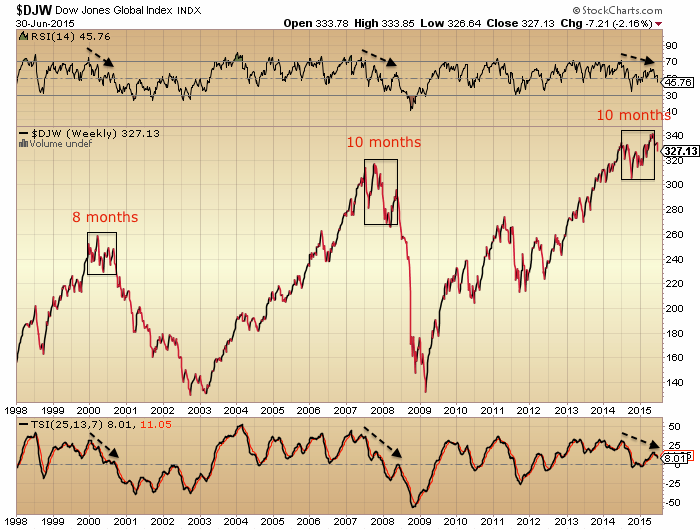
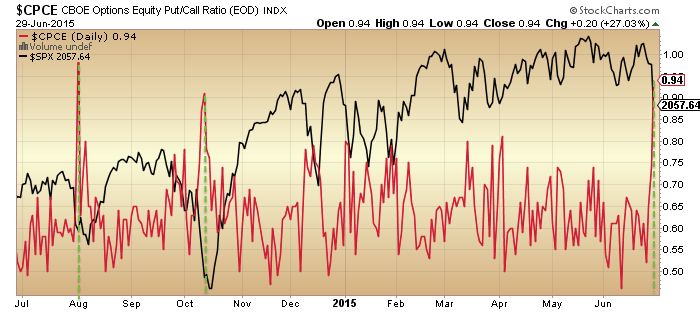
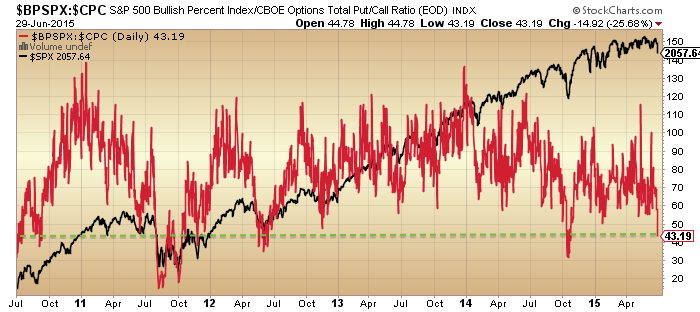
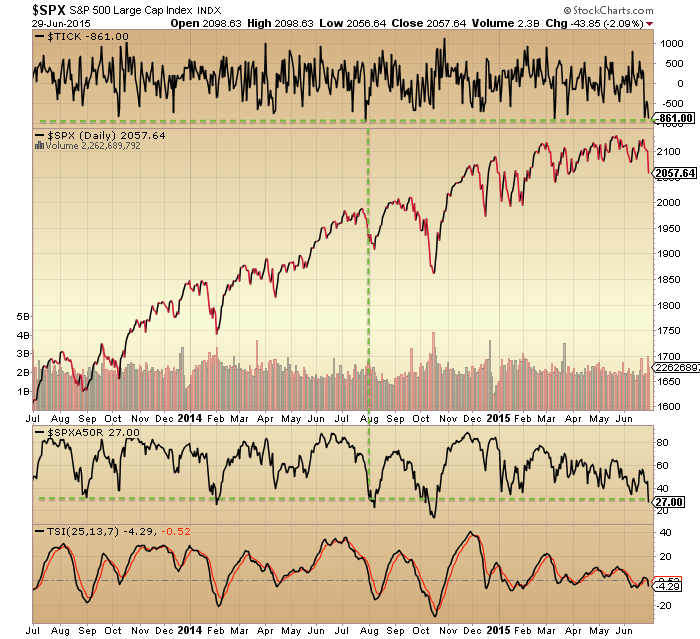
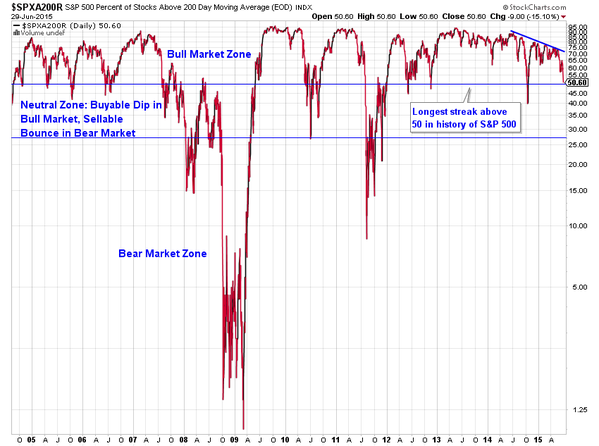
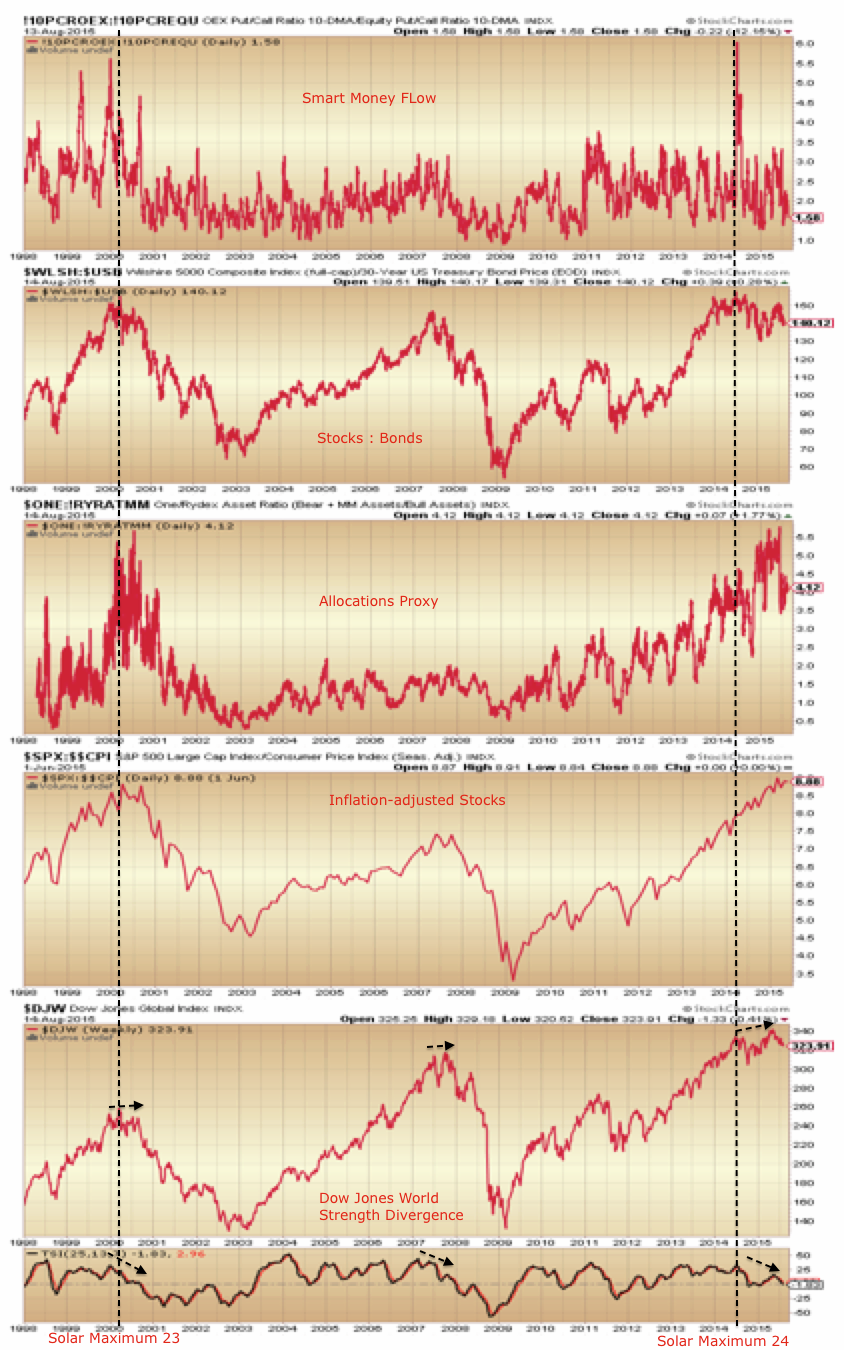
Below we see several key indicators peaked out with last year’s solar max whilst a couple of others extended beyond. Now the latter should fall in line with the former. Note how the levels reached have been largely similar to 2000’s saturation levels.
 Source: Stockcharts
We are now through the August new moon, heading into the seasonal (geomagnetic) lows of Sept/Oct. I’ve been back on the attack short stocks, with particular emphasis on Biotech.