
Evidence reveals the financial markets to be ‘dumb’. Long term trends are dictated by demographics (swelling numbers of buyers or sellers) and solar cycles (influencing speculation levels amongst participants). Markets top out when there are no new buyers left and/or no room or appetite for existing buyers to increase debt, and bottom at the opposite. This contrasts with common wisdom that markets are instead dictated by central bank actions, economic indicators, or company fundamentals. They play a role, but the evidence shows that the stock market leads the economy, that central banks are typically behind the curve, and that stocks rise purely on multiple (valuation) expansion if there is either swelling leverage or swelling buyers (or fall vice versa).
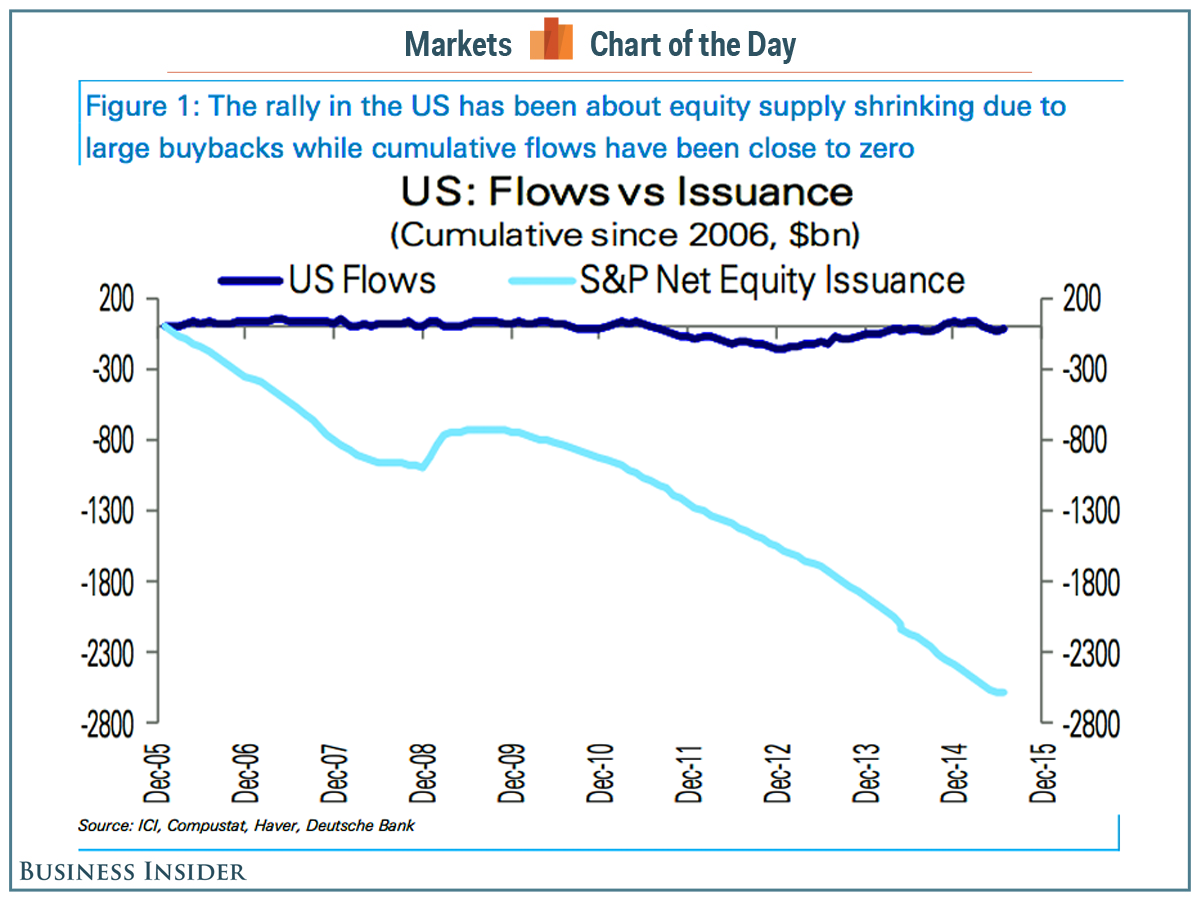
Into 2014’s solar maximum we saw a speculative mania in equities akin to the last solar maximum of 2000. But unlike 2000, there was no demographic tailwind, instead a headwind. Without new buyer flows into the market, we have therefore seen equities bid up by (1) existing buyers leveraging up and (2) companies buying back their own shares.
This chart captures the flat money flows as predicted by demographics versus the declining share issuance due to buybacks.
 Source: Business Insider
The effect of buybacks is to increase EPS and decrease P/E. The latest earnings show a blended 1% decline YOY, but without those buybacks the figure would have been closer to -4%. Revenues declined 3.3% YOY and reveal a truer picture of companies performance. Additionally, companies have largely borrowed to buy back their shares, making this market fuel particularly ‘unhealthy’.
Buybacks are likely heading for a new record this year, beating the 2007 record. This may partially account for stocks continuing to levitate despite all-round deterioration in other indicators.
 Source: Bloomberg
The other fuel source has been increasing leverage. We can see that leveraged loans peaked out around last year’s solar maximum:
Source: LeveragedLoan
Whilst margin debt lurched upwards again in 2015 to a current April high.
 Source: D Short
Meanwhile in China margin debt went crazy and can be seen to be wholly accountable for the rise in the Shanghai Composite. This too fits with demographics there: no new buyers, only existing buyers leveraging.
 Source: FX Street
The subsequent collapse in China’s stock market shows what happens when there is no room or appetite for further leverage amongst participants, which brings us back to the top of this post. Then, when leverage starts to unwind, it brings about forced redemptions and thus more selling, as it is effectively a ponzi scheme.
So the question is when leverage in the US and elsewhere starts to unwind. Based on historical evidence, appetite for leverage should wane post solar maximum. We see that in leveraged loans above, but margin debt has rallied further. We know from 1929 that leverage extended a year post solar maximum before collapsing, whilst breadth deteriorated over the same 12+ months. We are again producing that kind of outlier extension, set against a similar ongoing breadth deterioration since the solar max of last year.
Either the sideways range in US stocks in 2015 is the pause that refreshes the bull or it is the topping process that turns into the leverage reversal inspired sharp declines. Solar-aside, there have been so many indicators that this is a market top, sharing characteristics with 2007, 2000 and other major historic peaks, that a bull pause is highly unlikely. But what’s different is that the interest rate, QE and inflation environment, together with commodities relative performance, hasn’t been seen in 50+ years, if this is to mark a top. However, rather than that negating a top, we simply need to look further back in time for reference points. Yet, if the stock market is a dumb mechanism, then we shouldn’t even need to do that.
The solar max produced the stock market mania. Demographic trends meant it has been fuelled by leverage and buybacks. The flat market of 2015 suggests saturation has been reached. Post-solar max, appetite for speculation unwittingly declines. China has broken and all markets are off their peaks. The last several weeks, indicators that have worked for the bulls over the last 2 years haven’t been working. I think the fuel is spent. Buybacks and margin debt are the key here, but both data sets come out with a lag.
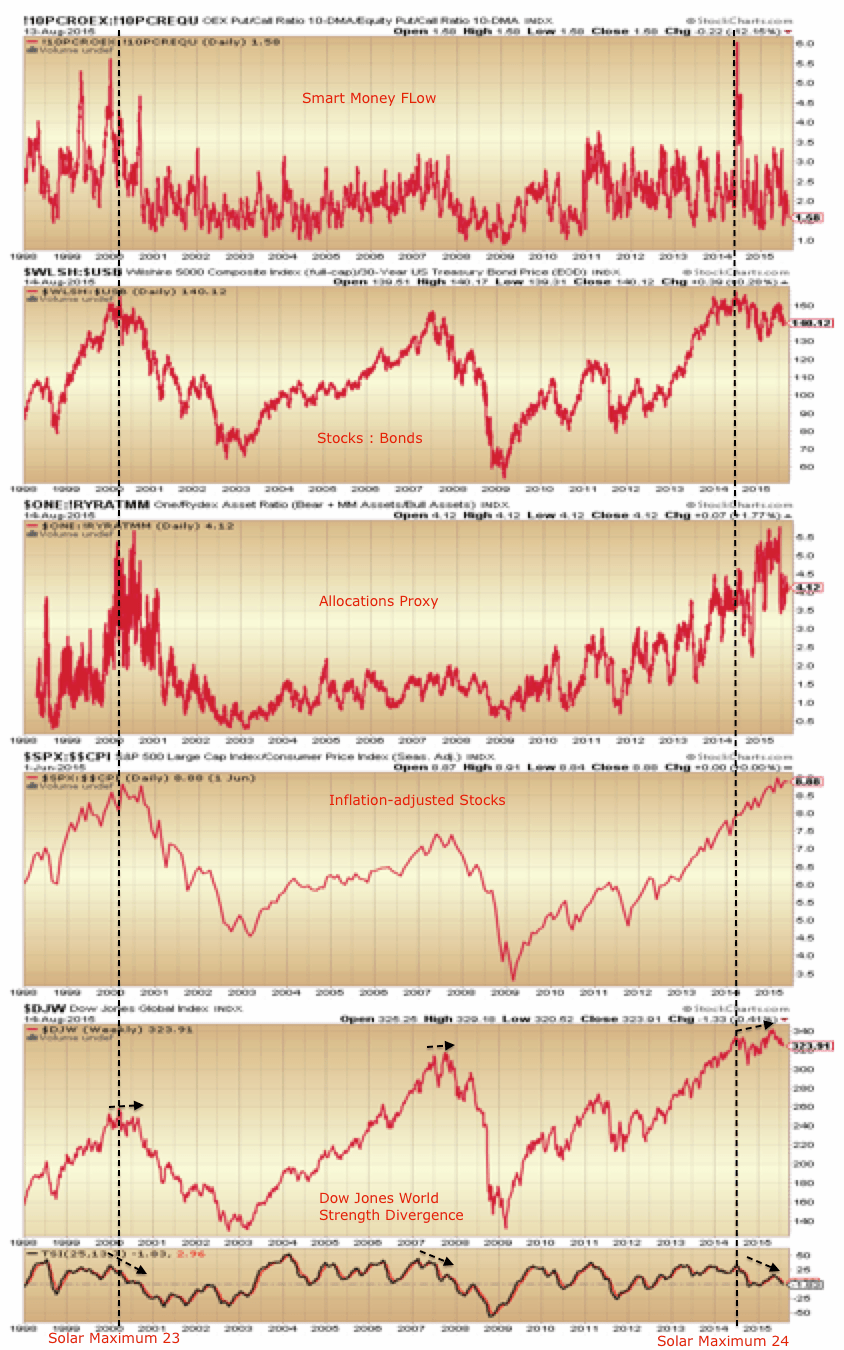
Below we see several key indicators peaked out with last year’s solar max whilst a couple of others extended beyond. Now the latter should fall in line with the former. Note how the levels reached have been largely similar to 2000’s saturation levels.
 Source: Stockcharts
We are now through the August new moon, heading into the seasonal (geomagnetic) lows of Sept/Oct. I’ve been back on the attack short stocks, with particular emphasis on Biotech.

Reblogged this on rajveeronmarkets and commented:
Some terrific market analysis
Terrific analysis. Most markets globally have undergone or undergoing death crosses ( 50 dma below 200 dma). Just a matter of time before the downside plays out.
Thanks
As we’ve all come to expect, rational and pragmatic insights in this post. Thank you JH. (I liked the comments re CBs following the markets especially).
Credit seems to be getting a little jumpy here:
https://research.stlouisfed.org/fred2/series/BAMLH0A0HYM2EY
Each time I read your posts I think, ‘surely he’s covered all the FINAL angles with this one’ and yet the next one produces yet another perspective that is just as lucid and compulsive in its argument.
Even if this turns out to be the ‘pause that refreshes the bull’ this series of posts need to be compiled into a compendium for posterity to know what to look for in the death throws of a bull…..particularly one that has been kept alive by ‘financial medication of the dubious kind’.
Bravo!!
Thanks gents
Well done, John.
You know your statement “Without new buyer flows into the market, we have therefore seen equities bid up by (1) existing buyers leveraging up and (2) companies buying back their own shares” can be seen in many ways as two sides of the same coin. As many companies are going into the debt markets to finance their share buybacks you now have both individuals AND companies leveraging up simultaneously which as you point out is providing in the main the energy for this long lasting bull.
True Gary
Thanks John great!
On another issue I am so so sick of the ignorance surrounding gold and silver, especially from the likes of Martin Armstrong.
Case in point, I encouraged my elderly father back in 2008 to buy 100 1 oz gold Kangaroos and 300 1oz Kookaburras and Koalas.
He paid at that time, in AUD $1032 and $40.55 respectivley. Today those same can be sold for around AUD $1700 and $85 respectively.
He had a very close friend recently ask him if he was OK given how much he had lost on his gold silver investments………. An unbelievable amount of ignorance not just amongst every day people but also financial analysts and advisors.
I favor one more move up in the DOW to a new ATH before the blow off top occurs. I suspect that the currencies (not commodities) will signal when the game is all over.
Greater speculation and greater leverage is still in play (a sign of positive/optimistic moods still prevailing):
http://finance.yahoo.com/news/euro-ministers-blessing-greek-bailout-080323057.html
Richard I, you are expecting a new ATH AND a blow off top? Wow!!
I do believe there is a reasonable chance that you are right on that ATH. Still expecting October? I expect September is also possible.
To John Li,
VSC is venus superior conjunction which is a bearish pattern defined as:
bearish 30 calendar days before to 45 days after with exception of 10 days either side of the conjunction. Over last 17 years has happened 11 times with 3% average decline during the VSC.
Btw, today is VIC, where venus is transiting across the sun. Tomorrow it becomes the morning star.
Thank you. VIC seems to be generally where markets makes lows, and so ATH seem like a possibility.
VIC usually is bottom tho’ about 20% of the time bottom was in two weeks following VIC. This is based upon 11 VIC cycles since 1998.
I do not want to spoil the bear party again, but there is nothing to attack… stealth correction finished and the final move higher before significant top has begun.
Attack the next top not the lows of an intermediate term correction.
I agree.
karni, there may be some truth in what you say but each person here has to make up their own minds about when and what and how to trade….including John H.
purvez, I agree. Everyones risk appetite is different. As far as I concerned the risk/reward equation by playing the upside here is just far too weighted toward the risk side and has been for a very long time.
I still maintain the risk is that at some point in the not too distant future longs will be attempting to sell into a vacuum.
Haha!! How many here have ‘mindS’ …. hands up please!! You lot with multiple minds are spoiling it for those of us who don’t have one!!
This suggests corporates buying their own shares have been the only support for the market recently, but not enough versus the selling:
The assumption is that those selling trends will continue from now until the bottom of the Bear Market. But what if those selling trends falter while corporate buying stays the same?
I am not saying that a major American Bear Market won’t soon happen. What I am saying is that the Bull Market has yet to run its course. I think that the Currencies are the key to the timing of the end of this American stock Bull Market and the next American stock Bear Market.
In the coming weeks the war drums of the conservative crowd will be beating that greater falling energy prices is good for the American economy (Fox business channel for example). This will counter any attempt to induce Panic or Contagion in the Crowd of stock buyers.
Here is some charts with a different short term view and pointing to a new ATH: http://thefatpitch.tumblr.com/post/126787837871/sentiment-and-seasonality-suggest-an-up-week-is
That was not what I intended. I meant to post the link to the Fat Pitch report that included many contrary charts. I don’t know what went wrong but if some one can post the link that would be great.
Done
What does this chart say to you all? Discuss.
https://www.tradingview.com/x/LBNGx2Zc/
It looks a tad similar to the gold/silver ratio chart.
Both imply trouble ahead, one via liquidity vanishing, the other via higher expected volatility.
To those who deny the connection between planetary positions and energy profile of earth I submit the following:
Today is VIC, today Solarham.com reports K index which measures planetary geomagnetics is averaging 2.5 times the normal daily average. And local weather in northern california is hottest day of last 12 months.
Method of effect, electrical and instantaneous like a spark plug; not atmospheric like a solar wind which is much slower and less directed. They are called Birkland Currents and detailed by Electric Universe project (aka Thunderbolts Project).
Since 1902, the month after VIC has returns 0.37% vs 0.58% for all months. Therefore, I don’t see the bullishness after VIC on average.
My data going back to 1998 only, which is 11 total cycles. The four months following VIC have yielded about 7% on average. The first month after is less bullish than months 2 and 3 which are uniformly bullish which accounts for the really impressive 11 cycle average.
I thought the same too, due to 3/2009, 3/2001 and other hits.
Anyway, here are my returns.
2/13/1902 0.015639517
9/16/1903 -0.108590927
4/26/1905 -0.101525966
11/28/1906 -0.010706413
7/5/1908 0.123222101
2/11/1910 0.025597844
9/18/1911 -0.012967201
4/24/1913 -0.012877662
11/26/1914 -0.194763372
7/2/1916 -0.013842376
2/6/1918 -0.003167363
9/12/1919 0.053968254
4/18/1921 0.017859488
11/23/1922 0.054634354
6/29/1924 0.061155984
2/3/1926 -0.051003764
9/10/1927 -0.027286742
4/20/1929 0.011301436
11/25/1930 -0.136464118
7/1/1932 0.311556657
2/5/1934 -0.074950334
9/12/1935 0.012750319
4/18/1937 -0.059640387
11/23/1938 0.003669602
6/29/1940 0.033426184
2/2/1942 -0.067324381
9/9/1943 -0.008275862
4/15/1945 0.026604069
11/20/1946 0.062608591
6/26/1948 -0.025526316
1/31/1950 0.01536936
9/7/1951 -0.001862129
4/13/1953 0.007534945
11/15/1954 0.043532503
6/21/1956 0.051018945
1/26/1958 -0.030555864
9/1/1959 -0.029471405
4/7/1961 0.004739129
11/12/1962 0.033295431
6/18/1964 0.030838501
1/26/1966 -0.03938764
9/2/1967 0.022315187
4/8/1969 0.043881409
11/11/1970 0.05603592
6/17/1972 -0.030019258
1/22/1974 -0.008662721
8/29/1975 -0.061268466
4/6/1977 0.024061745
11/11/1978 0.003432083
6/17/1980 0.050849
1/22/1982 -0.0216087
8/25/1983 0.05308592
3/31/1985 -0.019521938
11/5/1986 0.016439885
6/11/1988 0.001265636
1/19/1990 -0.035229097
8/26/1991 -0.007284428
4/1/1993 0.001962529
11/6/1994 -0.018909947
6/11/1996 -0.027890189
1/16/1998 0.080225291
8/23/1999 -0.086830163
3/29/2001 0.112182189
11/3/2002 0.025853405
6/9/2004 -0.011655562
1/15/2006 0.009042078
8/22/2007 0.039507772
3/29/2009 0.052667248
11/3/2010 0.013112643
6/6/2012 0.025896531
1/11/2014 -0.028783145
Perhaps it has to be VIC and near solar max for it to be bullish. Just speculating and sharing my data.
Interesting….after VIC,
Dow Jones:
Month 1: 0.41%
Month 2: 0.88%
Month 3: 0.84%
Vs
All Months: 0.58%
I am not sure you are calculating VIC data/date correctly. I show 4% average return month after VIC over last 11 cycles.
For example, the 3/2009 VIC was close to the bottom of an epic bear and from that VIC 30 days later looks clearly on my chart to be a 10% gain.
The 1/1998 VIC also was followed by a 10% gain in next 30 days.
I am using the 500 for my calculations but shouldn’t make any difference.
And the 3/30/2001 VIC yielded 8% over next 30 days.
In short, it does make a difference. S&P500 had many dotcom stocks in 2000, while Dow was the old economy. The charts are quite different. The reason I chose Dow is because SP500 did not exist in 1900. Also, the Dow data I got does not include dividends.
Some of my VIC dates are 1-2 days off, since I got tired of typing them manually.
Here is the data for 3/29/2009, which has that 1 day off problem.
3/27/2009: 7776.18
3/29/2009: VIC
3/31/2009: 7522.02
4/29/2009: 8185.73
Because my code chose to use 3/27/2009 to 4/29/2009, the return is 5.3%. If I chose 3/31/2009, I get 8.6%.
Thanks, John Li. Happy bullish post VIC trading!
Aside from the market returns, note the monthly volatility around VIC:
Month -1: 4.5%
Month +1: 6.4%
Month +2: 5.6%
Month +3: 4.9%
Month +4: 4.6%
This shows that VIC does something to human psychology so that volatility increases right after. This explains the crazy returns we see 3/2001. (Whether positive or negative returns). Thereafter, volatility drops as we revert to normal. In typical Wall Street fashion, a declining VIX means a rising market, but by Month 3 or 4, things are back to normal.
This is the 1937 analog, as JH pointed out also had zero rates.
http://postimg.org/image/498dppdrh/
This may be helpful to all. Fits in with what John has been saying.
http://ibankcoin.com/bluestar/2015/08/15/the-curious-case-of-the-vvix-index/
Thanks
Bullish percent to put call:

21 day equity only put call:

Looks like we may not be done going down yet. Normally we have rallied into OPEX Friday this year. If we don’t then I would have to say the Bears are slowly gaining the upper hand.
Geomagnetic storm in progress. Recent cluster:
Do those storms tend to skew markets down?
Yes
Bluestar, you beat me to it.
Be careful of the potential for an OPEX squeeze.
Yes Phil,
The pattern has been to squeeze but the VVIX is saying a big move is coming soon. If they can’t squeeze us into OPEX then this market is in serious trouble.
Seasonals in Crude could send the Energies (and Gold) to new recessionary (multi-year) lows this Fall:
http://finance.yahoo.com/news/heres-could-oil-down-30-145523193.html
No projected decline in North Dakota or Texas oil production for years to come (prices can go lower even to the $20s):
http://www.usatoday.com/story/money/columnist/2015/08/14/loveless-north-dakota-oil/31733073/
This chart claims it can show when the next “bubble” is about to burst. Note, it doesn’t claim to know what that “bubble” is:
http://finance.yahoo.com/news/chart-tell-next-stock-market-184259029.html
Remember the Economist cover in 2000 +/- which predicted oil was going to fall to $10 per barrel, which was followed by a decade of much higher prices. When USA Today highlights $20 oil, a contrarian may suggest now is the bottom and oil could be 20x that figure in next decade. Fundamental analysis would suggest declining demand (electric cars) and increasing supply (new extraction tech) could support their view.
The only way oil can ever rise again is if the US invades Saudi Arabia, or a similar geo-political move. That’s the main reason oil ever got above $50. Watch out if the US release those redacted 9/11 report pages, game would be on then.
The next time oil rises, it’ll only be WTI rising, as Brent/Middle East would have moved to euro pricing by then, which will effectively mean gold pricing oil again.
John,
“Either the sideways range in US stocks in 2015 is the pause that refreshes the bull or it is the topping process that turns into the leverage reversal inspired sharp declines”
Demographics with average retirement savings accumulated by age range along with something like this from multiple counties:
http://www.ssa.gov/oact/progdata/icpGraph.html
One should be able to derive or ascertain what impact ages of employees are, their retirement nest egg, and the delta YoY.
Despite unleashing massive amounts of stimulus the Japanese economy is shrinking again.
Will central planners ever wake up?
Just gone very small short dax targetting 10900 area. Will switch back to long around there.
Short closed and small long opened 10850. Not sure what that spike down was…
stop at breakeven on this. It now really does look like more downside for the DAX so will just be biding my time to go long for the post summer rally I expect. I’m pleased we are getting the bull market correction that has been very very overdue.
So you’re in the 10k Dax camp with me then, good man!
Quite clearly the bulls have decided that the 200 day on the SPX will be defended at all costs given that they’ve lost the Trannies, DOW, R2K and NYSE already
All said the technical picture has deteriorated dramatically across most sectors amd in Europe amd Asia particularly.
I can’t see how others are seeing new ATH’s?
Simple – stealth correction masked by a corrective mess running for months.
Indicators and market breadth beaten down. The bears trading their bias see confirmed H&S others see corrective moves with breadth and indicators pointing to a bottom.
As I wrote no point to attack a low, wait for several weeks.
karni,……what I see is dislocation in high yield markets, LIBOR rates rising, the inability of markets to correctly factor risk, Central Bankers stumbling over themselves in blundering attempts to arrest a rapidly increasing deflation, namely the PBoC, who have just unleased a tsunami of global uncertainty and deflation, all whilst US stock prices are the most ovevalued in history on a broad measure.
My point being, why wait until the freight train is 2 metres away before attemting jump out of the way?
If you look at human behaviour, if there is enough people buying the dip we could easily get an overthrow or blow-off top which has nothing to do with technical or fundamental picture.
I am largely sidelined atm.
J
Echoing some of the others here. Today’s ‘down/up’ move has me baffled so I’m sitting waiting for a clearer entry point. Given today’s rise it’s likely to be a ‘short’ entry I’ll take but only very short term and will very very tight stops.
I do however hate to ‘not take advantage’ of 200+ point moves in each direction on the DJIA!! Goes against my ‘religion’!!
Ugh ‘with very tight stops’….but by now you know what I mean with my dyslexic typing skills.
If I were to hazard a guess I’d say the SPX has gone back to fill a gap in the intrad-day charts from last Tuesdays gap down open and which lies just above 2100.
Valey,
Are you planing to go short at spy 212 in next day or two. if vix dips below 12 . There is heavy put at 205 if it dips there its a buy.
Bill
PALS (planetary aspect lunar seasonals):
Phase: + until T, – W to Fr
Distance: – until Th, + Fr
Declination: + until W, – Th to Fr
Planets: ++ all week post VIC and MQuad
Seasonals: opex week in August high probability of finishing up.
Summary: will probably stay fully invested in US SM until Friday based upon seasonals. May exit early if gains are achieved.
Today’s close is very important because it “should” be at/near its daily high and ideally +1% or higher from Friday’s close. If this occurs then probability increases greatly of further gains to possibly early Wed. NDX still lagging behind and not quite achieving daily highs of prior week yet.
I have mental trailing stops on any unexpected reversals today so watching closely. Bullish lunar cycle is closing out by middle of this week and also moon at apogee occurs tonight, so this “should” be a last gasp late cycle rally to attempt to salvage a rather underwhelming cycle.
If things work out well then an ideal shorting opportunity might present itself by Thu/Fri and it could be another big move occurring in about a week duration again.
I agree Steve, apogee should be factored in as day of to three days after averages -.6% over decades of data. Today is equatorial crossing of moon to south, which adds oomph to market that lasts a few days. Plus, post VIC bullishness. Would expect nice 2% to 3% move up this week. Next week “should” fall based upon seasonals and negative moon phase, if we get a nice up move this week.
I like this prediction Can you send some bull power over to Europe (AEX) make the Dollar stronger…. Mercury Latitude minimum 19 august but can be 2 days to late..
Last one Juli 26 bottom 27…
Sounds good, thanks for the reminder of mercury latitude marking lows. What I am trying to understand is why they match up with mercury 90 degree in relation to earths position.
I m no expert but I studied the higs and lows and very often it’s bulls eye can be 2 days sooner or later..
But it can mark lows and highs… just like the other one (mercury elogations max east,west and conjunct sun..
cheers
I’m beginning to doubt my own sanity now. What I thought was a ‘contracting triangle’ yesterday has morphed (with the down, up move today) into what I now believe is an ‘expanding triangle’….only referencing the DJIA (please remember). This wave’s high would be ‘wave-d’ of that triangle. So we would expect to see ‘wave-e’ head below 17335 to finish of ‘wave-e’.
The ‘reason’ I doubt my sanity is not because I believe in the above count…which I do, but because of what comes AFTER the end of a triangle a ‘thrust’… and in this case UP beyond this wave’s high!! Now that is just TOO MUCH volatility. However our Steve T did say that is what we should expect, so I’m going to hide under his ‘wing’ for my prediction.
Has EW worked for you in last few months? It seems like a lot of effort, like learning algebra, but I wonder if it is still useful with more managed markets.
Tho’ I got to say, I like your analysis of a possible up beyond this wave’s high!
Haha, you are not allowed to ‘pick and choose’ your EW analysis. Changing your mind is all right (even necessary) but not being selective. 🙂
Hi Valley,
Europe is not responding on the US like it should but it’s possible that 19/8 Mercurius latitude minimum can be seen as a top if today the SP continues it’s upward move.
Cheers
Valley, my educational background has been Accountancy, IT and Maths and so I have a ‘need’ for something that has a structured approach. I know TA does provide that but the main reason I stick with EW is because the ‘failure’ points are unequivocal!! THAT keeps me out of harms way, which is why I like it most.
I have now been using EW, Fibs and a couple of other Tech Indicators for the best part of 5-6 years and I almost habitually start counting waves as soon as I see any chart.
So the long answer is yes I couldn’t trade without EW.
Thanks, Purvez! Any advice or commentary on specific EW patterns would be educational to me.
I sense we’re within a week of waterfall stock market declines.
Too many signs that the game is up, credit & oil notably.
Gold stealthily rising.
10-15% down, then second chance into year-end, coinciding with final low in gold & miners.
GM
Agree with your comment!
Once again todays trading smacks of distribution. Stay very light on your feet folks.
I think it it is too early to short U.S. indices. Right now we may be breaking out of the triangle in ES contract that has been forming since mid July. In that triangle, final E-wave “shakeout” was driven by news from China last week. That would mean final throw-over in next few weeks, Fed turning off lights in September and possible crash in October.
But above scenario may be too simple and we may consolidate in bigger triangle until final top in December or January. This may be coincident with Fed being too scared to raise rates in September. That would also be a driver for major gold rally in autumn.
In both cases my final SPX target is 2170-2210 zone and I am keeping my powder dry until then.
Bunell, have you, please, got a chart for the ES triangle? I can’t quite see the triangle and am wondering what it is that you are seeing.
However 2170 to 2210 as a target is a ‘WOW’!! for me. What is your ‘basis’ for projecting so far up please?
Purvez, it is quite close to Gregor Horvat’s interpretation:
http://www.barchart.com/headlines/story/10197752/s-p500-trades-into-a-bullish-triangle
His whole C) wave may be interpreted as yet another smaller triangle where C sub-wave smacks of classical E-wave throw-under for me.
Anyway we should see higher prices quite soon.
Regarding final top in SPX, I count whole bull market since March’09 as simple A-B-C where A wave finished either in Feb’11 at 1344 (preferred count) or in May’11 at 1370 (Bin Laden news). C will be 1.618 x A starting with Oct’11 bottom at 1074. So it gives you 2170 or 2210. I believe this thing will stop somewhere in between.
That would be negated if we take 1960-1980 support zone. This would mean that dramatic bear market is already underway.
Bunell, thanks for your reply. I understand your stance better now.
WMT cuts guidance – for you rabid bears )
I’m not quite foaming at the mouth, but if Wal-Mart is struggling, does the US really have any glimmer of hope at all.
No. They’re doomed. Sell.
Hi GM, I enjoy your posts, but as I understand, you are either long or in cash? This could explain your calm when bears are reeling from a short squeeze than occurs once or twice every month.
I’ve been long gold & its miners through the past couple of years, so underwater, but averaging in continually, so average price equates to around $1,300 gold price.
Long gilts also.
But, just about to commence some swing trading with a bit of spare funds, so will enjoy sharing my trades here.
I am short China. My view is that China analog is 1929, while the US analog is 1973. Different markets in terms of timing of waterfall.
Bunell
Good points well made, there are many possibilities.
To PW, I don’t know anyone who is permanently a bull or a bear – unless of course you mean buy and hold people – they are always bullish:D
J
I’m short Italy 40. It percentage wise very close to its ath.
This is market that just makes the bears who are investment advisors feel foolish AND look foolish in front of their clients. They have perfectly legitimate (and substantial) reasons for the market to go down and yet all their clients see is how well the indexes are doing.
Feels a bit like 1999-2000, frankly.
Gary not quite sure I understand what you are saying? From my perspective a credible investment advisor would be advising his clients to lighten up considerably here and should have been doing so for over 12 mnths and would stand firm in the face of any criticism for that stance.
Stock indices are demonstrably overvalued, over-hyped and any invesment advisor should be telling his clients exactly that and to position accordingly.
I apologise I shouldn’t be gender specfic when I talk about investment advisors or any non-gender specfic role.
I was a former portfolio manager with a few wealth management firms and I can tell you there is tremendous pressure both psychologically and financially to keep up with the indexes, as that is what the clients see every day when they open up the business page.
I fully understand your point that clients are paying advisors to withstand this sort of pressure, and you’re absolutely correct, but it ain’t easy, and when you’re part of a larger institution that has other priorities, oft-times impossible.
Bottom line, if your clients are in index funds beating your rear and continuously asking why you’re not doing better, it’s not fun.
Hussman: ‘One has to choose whether to look a fool before the bubble bursts, or afterwards’.
Credit is becoming a problem. At the wides seen in the panic spikes of December and October,
BlueStar, agreed. The junkiest of junk have gotten eviscerated and now the question is whether it’s spreading to higher quality debt, and across sectors. There’s been some of that but the question is whether we’ve reached the proverbial tipping point.
If the analogy goes according to script, today US equities will close near daily low. But because yesterday’s big surge broke a one-month downtrend resistance line and MACD turned positive just below zero, it implies today’s down day is merely retesting the downtrend line from above (i.e. resistance now becomes support).
So tomorrow the probability is quite good that today’s low holds and an incrementally higher high gets made close to SPX 2110. However, price should fail around there and highly likely Fri Aug 21 is the first big red down bar that breaks the short term one-week uptrend line from Wed Aug 12 low. Projections then call for approx 70 point decline from 2110 to occur by next Wed Aug 26.
Monitoring it …
New post