
Capitulative breadth now down to 6 on the rally in stocks, but still suggestive of some more upside for equities to properly neutralise it.

Source: Rob Hannah
Today is the full moon, and lunar phasing for 2015 looks like this:

Not all have been compelling turns but nonetheless shorting each new moon and going long on each full moon would so far have made a profit every time this year. Historically, lunar phasing has worked better in periods of sideways chop like this. Based purely on the moon, we could expect stocks to peak out again in mid-August. But at some point this price range will break one way or the other.
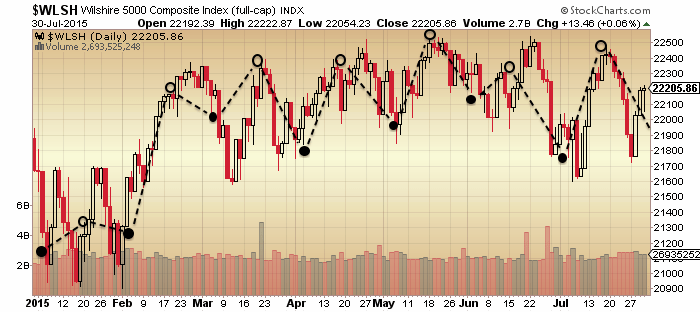
As you know there have been many technical indicators for a bull market peak, suggesting that price range to be a topping process. Here are two more from Dana Lyons:
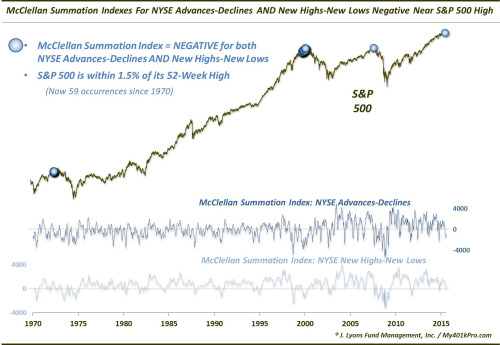
 Source: Dana Lyons
Valuations are crazy high:

And US small caps are the most expensive they’ve ever been.

Source: Meb Faber
But whilst stocks continue to levitate the key question remains whether excesses in valuations, sentiment, allocations and leverage need to be reassessed in the context of ZIRP and QE, and don’t pose the same threat as typically historically. That analysis is further complicated by not having experienced this combination of negligible rates, low inflation, low growth and high debt for over half a century.
However, the reason for ZIRP and QE is that the world economy has been in serious trouble since 2008, with demographic trends in the major nations all having turned negative. Below we can see the break in the long term trends of US growth and employment and how they remain broken:
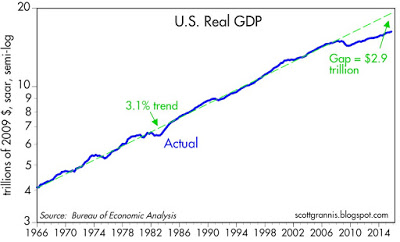

Source: Scott Grannis
So, either (1) the stock market is majorly divorced from reality and reverting to mean soon, or (2) the economy finally picks up from here and catches up with stocks having led, or (3) this is a new norm skewed by central banks whereby current indicators of a top that resemble 2007, 2000 and others no longer apply. You know where I stand on this question, but the sideways price range of 2015 has yet to validate or invalidate any of the options.
Leading indicators still largely point to a pick up now and towards the end of 2015.

Source: Variant Perception
Whereas China looks to be in trouble.
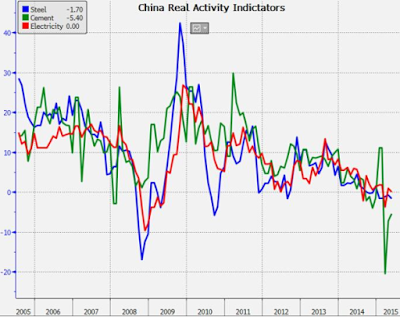
Source: Cam Hui
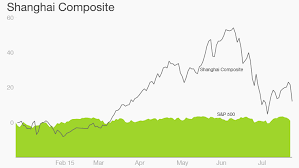
Source: CNN
Biotech is also wobbling currently, testing the bottom of the parabolic. So are these the last gasps of a topping process? Or is the price range of 2015 in broad equities the pause that refreshes the bull? We saw some evidence of reset by the end of last week: AAII sentiment, bullish percent, capitulative breadth, put-call all suggestive of a significant low. However, in the bigger picture historically, these look like a low in a bear market, i.e. from which a counter rally erupts before lower lows ahead. What’s confusing is their occurrence just 5% from the highs in nominal terms.
Right now I expect stocks can move higher before they move lower again. So I am waiting and watching for evidence they are rolling over again. The key is whether they do so before they reach the July highs and then the May highs. At the same time I am looking for a lower low in gold and miners on positive divergence.
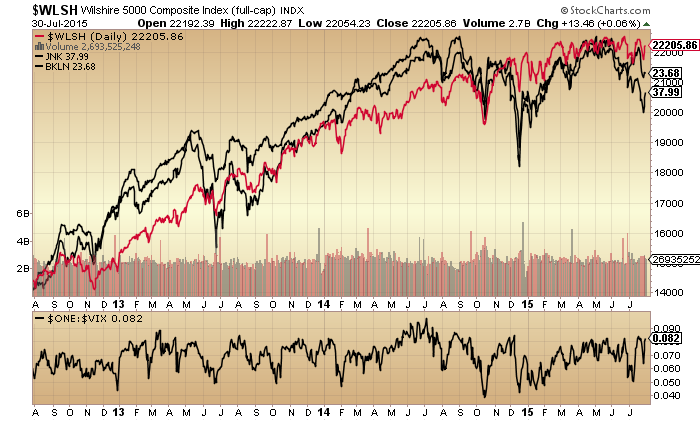
We still have a host of indicators pointing to an underlying peak around the solar maximum of last year:

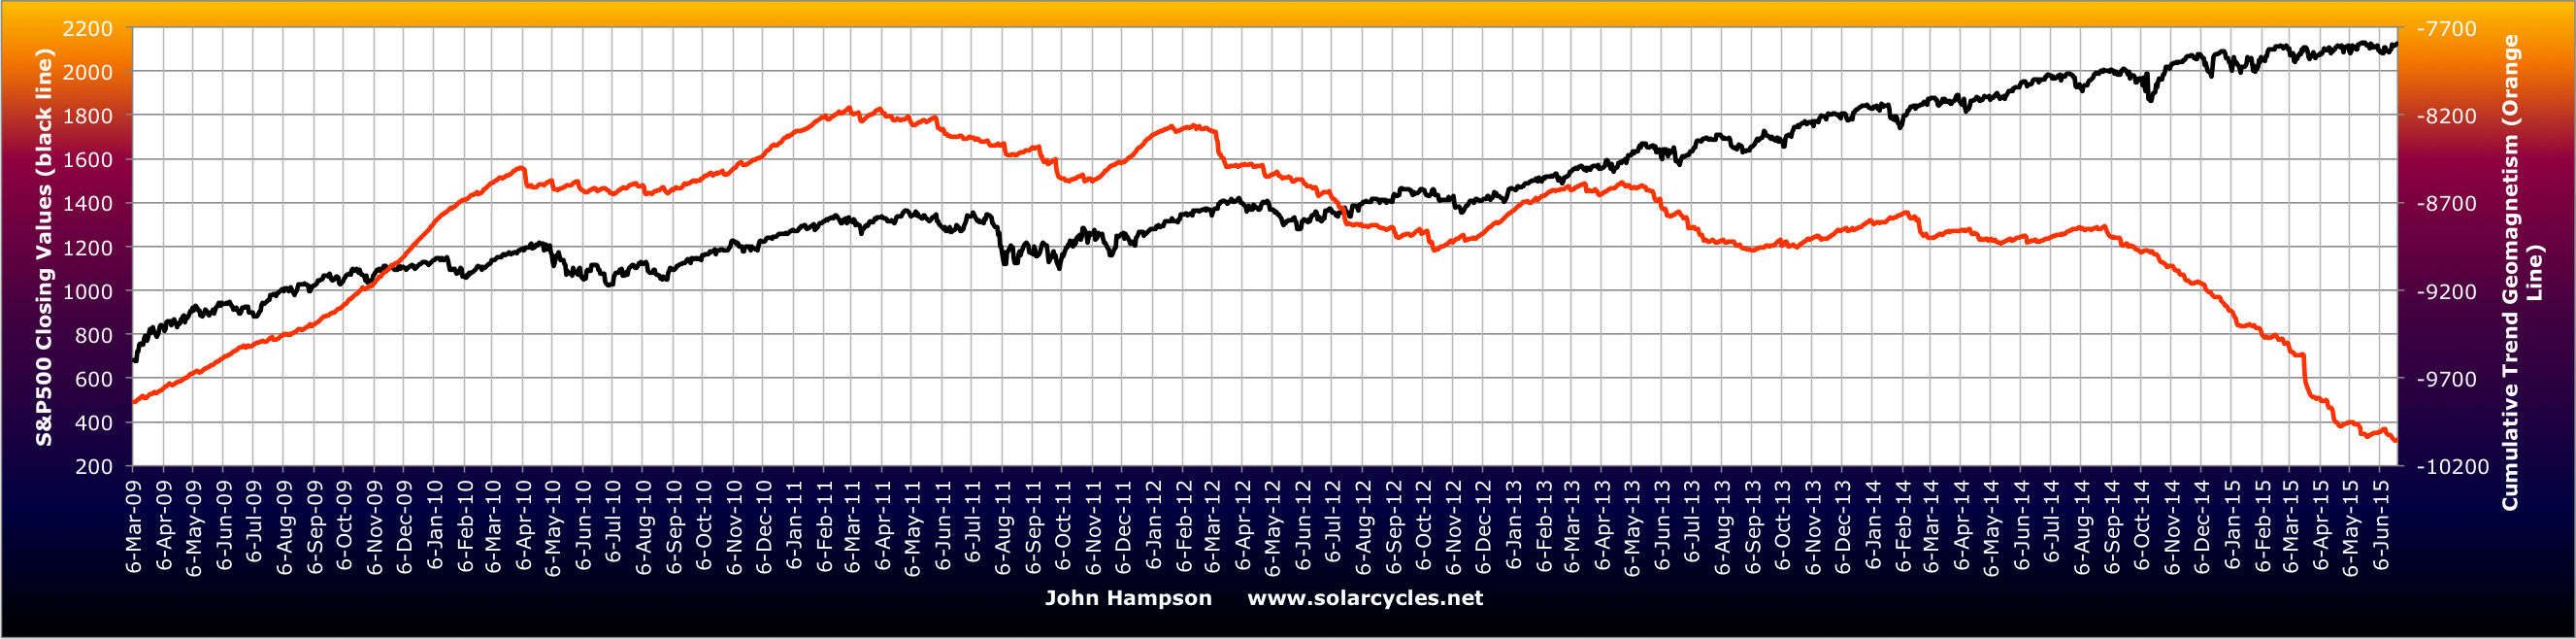 That June/July 2014 peak remains in play unless we see those indicators reverse and reset. 12 months later they still haven’t. So I remain of the opinion that equities will ultimately break downwards. It’s just a matter of gauging the shorter term waves. On which note I have to prudently add that I can’t rule out a final move up to new highs before a collapse. It happened in 1987 and 1929. A range trade over the first half of the year and then a final rally to a peak in Aug or Sept:


Source: Financial-Spread-Betting
That extreme reading in capitulative breadth may support this occurring, so have to stay open minded. Hence the importance of watching indicators and price for evidence of a roll over before the July highs, then the May highs.

Well done on your timing call John.
I am loathe to say this time it’s different as
ultimately it never is – the cycle eventually rolls
over and a bear market follows.
The cycle has been elongated, I think that is
safe to say.
Thanks Phil
If anyone has thoughts on the oil price to the
end of 2015 I would be interested to hear.
Plenty of uber bearish calls abound atm and beginning
to wonder if this could mark the beginning of a turning point?.
Another way to think of this is “what do you think the dollar will do” from here to end of the year…
Again patience bears:) Do not expect a top before mid September
I think SP500 is in a triangle and I suspect DJ will make lower high.
http://practicaltechnicalanalysis.blogspot.co.at/2015/07/update_31.html
meantime, Grexit is back on the table?
What do you expect to happen with gold and gold miners when wider equity market significantly corrects? Thanks
I expect gold to rise and miners to rise if not initially then eventually
Hi here’s another post from Prof Michael Pettis:
http://blog.mpettis.com/2015/07/chinas-stock-markets-and-revisiting-2011-predictions/
As usual it is long (although as usual necessarily so to explain the concepts) but there is a bullet points section at the start of his 2011 predictions bit which was very interesting to read in ‘hind sight’. This guy, imo, clearly has a good finger on the pulse of global finance and more importantly the repercussions into the future.
John H, my apologies for hijacking this blog with Pettis’ stuff but I believe the following para needs a wider audience. Hope you don’t mind:
“But in fact in this fight over global demand it is the deficit countries that have all the best cards. They control demand, which is the world’s scarcest and most valuable commodity. Once they begin intervening in trade and regaining the full use of their domestic demand, they will push the adjustment onto the surplus countries. Unemployment in deficit countries will drop, while it will rise in surplus countries.”
Without a full read of the article I linked to above it is perhaps a bit out of context but there is enough here to create pause for thought….I hope. Particularly the sentence beginning ‘They control demand,…’
No need to apologise
Thx for all you do for us.
Thanks, JH for the reminder of demographics. Also, the full to new cycle chart clearly shows the effect; your lunar edge article would suggest buying at full plus four trading days and selling at new plus four trading days as there seems to be a sell off at and after full moons.
Long dax 11200. Opportunities keep presenting. Sharp euro move will correct back and Euro dollar parity is on the way paving the way for significant equity gains in Europe.
Long closed at 11270. Will buy again on any further dip towards 11200 again.
valey,
are you playing with options or etf.
etf: SPXU
Hi all,
New poster on this blog, from the Netherlands and like some here using Astro + time cycles + Gann in his (swing)trading. I got some questions for the people on this blog that use the moon to guide the course of the market (as I am trying):
I got the feeling that most of the time (as valley is saying above here) is true for the market. However, this only goes for a positive moon period right? So my second question is: how often is it so that this does not work and can we indeed call that a negative moon period (so sell the new moon and buy the full moon +-4 calendar days)? I got the feeling that this does not occur that often…
@valley, I see that you are spot a lot of times. I would like to learn to use the planet influence on the markets. Can you give me some advice where I should get my information (books/websites/other source)? Up till now I have not been able to find a good source, but I am eager to learn!!!
Thank you! I am looking forward to your answer @all and @valley.
Greetings,
Wouter
This site is the best that I have found, as JH’s articles are excellent market summaries and posters such as Andre’ and Peggy who have advanced systems which they share and several other posters who have quite a knowledge of astro and Elliot Wave (EW). A good start is read JH’s article “Lunar Edge” on the home page which shows in chart form the positive correlation between price and new moon. And then there is “TImepriceresearch”.com which has hundreds of articles.
Thanks Valley. Welcome Wouter. A lunar strategy on its own has to be played over a long time period to tease out the edge. But used as one tool amongst multiple tools it can help guide short term tops and bottoms.
Hi John!
I use it as an extra to time for short trades, you are right on that. 😉 I was just wondering if it is correct to say that a negative moon period does not occur that often and 80% of the time you can just buy the new moon and sell the full moon???
I like to hear from you to see if I am right on this. And yes, I have known the article ‘Lunar edge’ for quiet some time now, that is where I learned about the moon (THANK YOU FOR THAT!!!).
Cheers,
Wouter
Hi valley!
Thanks for your response. I know the TPR website and this blog is also very good! However, I am looking for information about planets etcetera. Which book should I be reading to learn what some planets do and what the effects on the markets will be? If you have a website that explains it all, can you give me the exact adress since I can’t find it. 😦
I like to hear from you again, thank you in advance!
Cheers,
Wouter
My Lunar Tuner on this site contains my observations and trade ideas. I use “Theplanetstoday.com” to find planetary positions.
Thank you valley! NICE website! There I found the information I was looking for!!!
Thanks for the update!
Based on the lunar cycle along with other negative astro indicators there is potential for SPX to give back all of its gains this week and retest the Monday low before the end of next week. If it is really bad then it could go lower and even retest the July 7/8 low.
But this would simply be a short term trade and a sizeable bounce will likely reoccur yet again while stuck in the 2015 trading range.
Monday Aug 3 would have to be the final short term peak if today is not already it for price action to confirm the negative cycle indicators. GLTA.
Weaker US macro over the past two days.
The US 10 year yielding over 2.40% just a
couple of weeks ago, under 2.20% at the time of this
post.
US Earnings were overall better than I anticipated
on the Q.
It’s difficult to make a definite assessment,
would still retain the view that the US cycle is
not yet rolling over, however data is dynamic
and needs to be watched carefully atm,
in case we are nearing an inflection point.
Have a good weekend folks.
Phil, data is not just dynamic but also skewed by statistical ‘adjustments’. Since starting to read the Alhambra blog I have realised that most of US data (and I suspect all other countries as well) is subject to so much statistical adjustment based on some very dubious ‘equations’ that they really are meaningless bits of info.
Sadly the Press use them as de facto ‘accurate’ data and create ‘sound bites’ for the general populace to consume from them.
The stuff that Jegersmart was alluding to in a previous post.
Regarding capitulation so close to the peak, I have been seeing this since 3/2014, where we have many supposedly second-chance rallies turn into new mini-bubbles. The best example is the 10/2014 decline and the 11/2014 second chance turning into a new mini-bubble led by China.
I wonder if other bubbles have the same character, where it is easy to say that a second chance rally occurred after the fact, but it is indeed to distinguish at the heat of the moment if we are to rally to yet new highs.
USD weighing heavily on the DOW. Technically it looks the worst out of the three major US indices.
Anyone that thinks that the USD can appreciate much more without significantly damaging the US economy is kidding themselves.
And for that reason alone there will be no US rate rises.
Allan, the USD will rise because of perceived ‘safe haven’ reasons and the US Guvmint will be unable to stop it unless it introduces ‘negative’ capital flow regulations!!
In this mad cap world with negative interest rates etc ANYTHING goes…sadly.
We live in ‘very’ interesting times….sadly too.
purvez, there will be a huge reversal of capital out of the US when the US markets begin tanking.
What you have witnessed the last few years is capital flowing into US markets to take advantage of the combinstion of stonger dollar and rising US stocks.
Think back to 2001 and the tech bubble bursting and remember what happened to the USD then?
Overseas investors that had poured into US equities after the Asian currency crisis and LTCM began repatriating ther capital thus overwhelming any safe haven effect.
We are in almost an exact similar scenario now as the last 18 months the Euro,Russian ruble,AUD,CAD havetanked thus driving international capital into US markets.
Mark my words….wait and see what happens. There is a massive amount of expectation toward the dollar and it is the most lopsided trade in history.
Allan I suspect we are just at different time frames because I agree that what you describe will happen but only after we’ve had the ‘inflow’ into the U.S. first.
There’s still too much USD denominated debt out there that needs a ‘resolution’.
Allan and purvez,
Capital will flow out of stocks into US bonds and t bills. The Fed will have to ramp up reverse repos to avoid negative rates. The dollar and the Fed and the US Govt are still seen as safe havens.
Investors have forgotten 66-82.
Once they remember, that’s when stocks start a new bull market starts, albeit a weak bull in inflation adjusted terms.Interest rates will rise, as money leaves all Govt Bonds.
This is the Armstrong view, I concur, same happened in the 66-82 period. Gold is the only thing that will make real gains. Very large in size.
purvez, valid comment, I take most cues from
corporate outlooks.
John Li, honestly I think it’s only obvious after the event.
I am sure a multitude of commentators will claim prescience
after the event saying that XYZ.. made this clear beforehand.
It may be easier to make broader calls, such as this looks late cycle,
although the uber bulls think it’s still mid.
Steve T, that’s a big call, find out soon enough.
Oh and I am beginning to suspect that Martin Armstrong has Narcissistic Personality Disorder or NDP. I believe there is enough evidence in his previous behaviour and posts to suspect that to be the case.
He has a penchant for the limelight and sees only that he can do no wrong amongst other traits.
Allan, you’ll notice he’s written about gold for weeks on end, and now he has a metals report to sell you for (I think) $500.
What a guy.
FYEO: Fed rate expectations rule. Good news = bad news etc. This wave turns regardless of bull or bear. It will be seen if this is end of the first b in the C or if it is the end of the first impulse in the 3rd. One clue would be a lower low, that’s my take atm FWIW
Peter_ whether it’s the ‘b’ in the C or the first impulse in the 3rd. Surely both will make lower lows. So where is the clue in that please?
One of the three unbreakable Elliott rules is that the 2nd impulsive price action cannot retrace more than than the commence of the 1st leg, if it does then the count is wrong. Another is that the 4th wave price action cannot enter territory of the 2nd…please tell me you know these things
Yes I do and the rule is that the 4th can’t enter the territory of the 1st. Except in the case of an Ending Diagonal.
So the ‘clue’ would only be IF the ‘b’ extends beyond the start of the associated ‘a’. Otherwise we are none the wiser until the 4th wave.
The other thing that occurred to me is that we may be talking about different waves.
Bear case… http://barestbodkins.blogspot.com/
Note that a new ATH can also occur in a complex (flat) corrective.
Seasonal pattern bouncy bearish into 3rd week October.
Warning – I’ve had more conviction in years gone by and been totally wrong.
I will say it again, I am still looking for a mid-October ATH in stocks and low in Gold/Commodities.
May be, maybe not?
All I know is that I have been waiting weeks for Sydney’s biggest bullion dealer to get in a decent amount of 1oz Kangaroos and …………………still waiting?
Those of us that have been quietly accumulating REAL Ag and Au over the years, not buying that pretend stuff have a much better grasp of fundamentals and demand trends and I can tell you that what MSM is shovelling out there about collapsing demand is pure garbage!
Allan;
Have you tried APMEX on Ebay? I can certainly appreciate that many people like cash-and-carry, but if you’re comfortable, I’ve never been disappointed with them or their prices…
I see a 1 oz. Kangaroos at $1192, and I’m sure they have as many as you need…
Thanks Baz will check them out.
Per gold touters, the little guys are buying heavily as are the big guys: China, India, and Central Banks. So is it paper manipulation or is it somebody is selling like crazy? Commitments of Traders reports (COT) over the last 4 years show heavy selling by miners. Now they are selling less as they prefer selling rising prices. But gold, silver, and oil are in bear markets. That generally means ignore buy signals and sell sell signals. After bringing to everyones attention that oil producers were selling at 5 yr and all time high levels, a big drop was indicated. After that happened, someone on this site got a buy signal in the $40’s for oil. I warned against catching falling knives. Oops, should have covered, that $15 rise was not fun. Who got that buy signal?
Based upon VIC (Ven Inf Con) low of 8/15 and two month rally after VIC in all asset classes, agree mid – Oct high but would include Gold in rally.
Isaacson, we got it…. give us some real-time trades pls.
J
I am expecting the NFP for August to be a blow-out number that helps to send the USD ever higher. However, before this Friday’s NFP, I expect the Thia and Brazilian CBs to cut their rates and send their currencies to new lower historical extremes against the USD.
The USD could be entering its final blow-off phase from now to October as many other currencies fall parabolically against it. This will keep the US stock rally going right along with it.
I am expecting many AGs to bottom (August (second week)) ahead of Gold (October) as I am expecting the El Nino to reassert itself and to be the most powerful ever recorded.
I wonder what Nicolas thinks about the current market conditions especially in light of the failure of the DOW to rise much above the 50 DMA, even with a supportive Fed Meeting statement.
A lot of my indicators are possible showing a top in the Dow around August 25th ,2015. ANYBODY else see something similar?
Joe – Check out the BB Width on the weekly SP-500 chart. This sucker is a coiled spring! Going to get a huge drop or huge rally. I’m thinking rally since I have a 2400 target before the sell off.
Thankyou
I don’t have or know of any indicators that can reliably do this Joe…..care to share?
J
Sir,
I said POSSIBLE!
Just a combination of cycles,L to L to H counts,divergences between Dow Ind Trans,Util.Also a few proprietary tools I’m working on ETC.
Lunar Tuner Next Week
Phase: – M,T, + W,Th,F
Distance: – M to Th, +F
Declination: – M to Th, +F
Seasonals: – all week
Planets: worst week of year (drum roll into Venus Inferior Conjunction week)
Summary: Fully short into Monday open. If greater than 2% achieved on short side, will move to cash, but will not go long until 8/15. The VIC and August combo are not worth the risk being long.
The world isn’t solely based on the USD and the Euro. For clearer trends take a look at the Brazilian Real, Thia Bhatt, Mexican Peso, and Russian Ruble, etc. As so many other currencies accelerate to historical (parabolic) lows against the USD the Euro could be pressured to fall to unity with the USD too.
I am of the opinion that these currency trends are helping to send the USD and US stocks ever higher against all other factors such as Cycles and which includes Sun Spots.
JH might want to make a report showing and discussing the many currency trends against the USD with out reference to the almighty Euro.
Richard I, a strong USD generally doesn’t support a strong stock market.
So not sure how you correlate the 2?
There is something about that NYSE Margin Debt to GDP that is worrying.
Volatility seems off…is that VIX or something else?
NYSE Margin Debt to GDP…
Yes, parity between Euro and Dollar could be a “goal” possibly….
J
The writer of the article below needs to get a clue!
“it almost makes you feel bad for the goldbugs, until you remember that some substantial number of them are just trying to scare seniors out of their money”
This is just one statement among several that quite frankly shows how much the writer is ignorant and naive or both.
I don’t see many seniors being targeted or for that matter lured for their savings, by gold promoterd, but what I do see is central banks that have driven down interet rates to zero and in some cases negative and that, as this jerk fails to mention, is what has really been one of the disgraceful outcomes of ZIRP!
Pension funds and pensioners have been forced into chasing yield amd that has created obscene levels of risk and will ultimately end in many of those pensioners losing the majority of their retirement plans.
What a DH!
http://www.washingtonpost.com/news/wonkblog/wp/2015/07/25/gold-is-doomed/
Allan, while the quote you mention is pejorative, at the same time the writer’s main point about gold not doing well when real interest rates are positive is a valid one. Assuming the world doesn’t end and the financial system continues along without crisis (big assumptions, I know), it’s difficult for me to understand why gold will do well until real rates turn negative.
Real US interest rates Gary:
http://www.tradingeconomics.com/united-states/real-interest-rate-percent-wb-data.html
Positive EVERY year, except one year in the 70s (when gold was $42 an ounce), and during credit crunch briefly.
Weird eh? Real rates at 10% in the 70s didn’t stop gold rising.How did gold get to $1,900?
Economic myths do seem to abound don’t they? Hint: do your own research, don’t just believe comments/anything you read anywhere online.
(Happy to consider other data that shows otherwise, nothing on FRED to help though).
‘it’s difficult for me to understand why gold will do well until real rates turn negative.’ said Gary.
It’s pretty simple. The world loses faith in sovereigns and their central banks (generally due to high debts/spending/printing/zero growth), gold becomes the only trustable *money*.
Gary, look back at the action in PM’s in June that coincide with an explosion in the short positions of commercials and a sell off in the USD.
Both gold and silver were looking particularly bullish only to do a very sudden about face?
There is very little doubt in my mind that something very suspect occurred in the PM’s complex the last two months.
That said, the common held belief that PM’s react to inflation, or anything other than a loss in global confidence is incorrect.
http://stockcharts.com/h-sc/ui?s=%24SILVER&p=D&b=5&g=0&id=p01919374737
Growth in UK.
Haha. Goodbye NHS! To be fair it will probably be gone by 2020 or have faced significant changes.
Legally it has already been privatised so I think what you suggest is pretty much guaranteed….:D
J
No, that’s “projected” population growth rates. The UK has had the biggest population growth rate in Europe for a decade, net immigration playing a considerable part and is more susceptible to changes for obvious reasons. Not sure what effect this will have though if correct as above…..
J
Traders with limited experience with medianlines
can still use them to ask basic easy questions
to confirm work given by other tools
When JH said bounce on the 28th
it was a simple matter to see price had traded to the minimum target
given by the tools and refused to go further.
http://stockcharts.com/h-sc/ui?s=%24SPX&p=60&yr=0&mn=1&dy=21&id=p45136849511&a=247870051&r=1438548439537&cmd=print
Taking this as a great example, slater9, at this point you would not be short even though price has moved to the top of the pitchfork formation, correct? You’d be waiting first for a move down, then a .886 retracement of that move before shorting?
Expecting to see a good upward move on the DAX in the first half of August. I think a late august/september dip is possible followed by major gains into year end and January 2016 where I think there is good chance of a top being formed.
Having given GM a bit of stick about his fake out
comment on US BOND yields, it’s only fair to
highlight that the yield on the US 10 Year is currently
well under 2.20%.
Looking at July some of the commodity moves were
just stunning, or stunning bad if you were long,
some incredible moves.
Cheers Phil.
I jut keep an eye on TYX, which has faked out Bill Gross previously. BIIWII often charts it, calls it the continuum:
http://nftrh.com/2015/05/07/bonds-in-perspective/
The last 5 times gold got this oversold, there was $100 or so rallies. But the 5 times before that, it was part of the decline from 1800 to 1200. So be careful out their unless whoever said buy oil when it had crashed to $45 says buy. A more significant trading rally is due within 2 or 3 months. The gap down island in gold is enticing, however the volume was relatively low. Amazings the bulls have been running out calling this as the bottom or big rally coming. Are they wrong again?
Donate your gold now for nuclear desemblance trials, failing which it will be sent by rocket ship back to the Sun where the dreadful metal thing came from…
By Order
Your friendliest Bankster
http://barestbodkins.blogspot.com/
On the oil side, seems WTI is following Brent at the moment (spread closing) – the fair-sized draw this week at Cushing is not going to have much effect imho. The 12 month spreads are still crying storage economics, so would expect oil to move even lower unless storage capacity at Cushing is hit….5 millon or so barrels to that limit….and maintenance season coming into play soon…..
J
I read over the weekend that Iranian super tankers are already shipping crude to the East (for storage maybe)?
The only way is down for crude IMO, next couple of years at least.
Update to my last comment on Jul 31 … the “potential” decline this week with regards to price action is not optimally tracking the negative characteristics for early this week. Thus, I do not think SPX can retest last Monday’s low 2060’s and at best maybe low 2080’s either tomorrow or Wed.
But even having said that, the volatility makes it nearly impossible to hold or trade short without big drawdowns or violating stops, because possibly something similar to July 7/8 could happen again.
Just to add to the above – in some ways the supply/demand picture has fundamentally changed now, until the next conflict involving oil producing countries……
imho
J
AAPL breaking 120 with hardly anybody talking about it is speaking volumes
A couple trader comments today:
Last time $AAPL broke thru 40 wk moving average (Oct 2012) the price declined 30% over 6 months. I think today is big warning.
and this –
If AAPL breaks below the 200MA, I believe that the general market will be in a correction. Hence, I will not buy AAPL at the buy zone.
8/3 15:27 Spiral update Wave 2 complete last Friday. Wave 1 of 3 target 2073. Expected lows of 1995 and 1940 by mid August. New highs afterwards doubtful. Long term target 515 spx.
‘Long term target 515 spx’
That’s a cracking low target Peggy. Just like the bubble bursting in the 20s.
What’s the time-frame on that target please?
I don’t have a time frame for that yet but I’ll post when I see the cycle top.
Cool, thanks.
adding one more short term target – 2015
“Expected lows of 1995 and 1940 by mid August”
I do not think this will even be close to being accurate and possibly it will be the inverse of what you expect. Almost equivalent to your/their 2042 target on July 30 in two days from July 28 where it went the opposite direction.
If one buys the low this week then they will do very, very well by mid-Aug IMHO.
Hi Peggy is there also a big change in price level in the expected low in Oktober
( longterm target spx 515)?
no big change for October. A black swan event would have to cause the drop to 515 but even in 2000 and 2007, there was plenty of time to enter short. I’ll post when I see the cycle top.
thanks I will keep my eyes on your updates..
oh darn my 2042 target was a few days delayed. If you have a price/time target, post it
LOL. Nice reply. Love it.
The bigger news, as I read it, is the odds of new highs occurring has decreased significantly and we have a long term price target of 515 – whoa.
Geno BTFD today. SL 2063.50
Hi Geno, how far up do you see this going?
Thx
Purvez – 2400
Going against Valley on this one and being bullish this week. Don’t like that because Valley is great. Guess I’m just seeing things differently. No problem there.
Wow that’s a big ‘up’!!
Concur with your comments about going up against Valley.
His Luner Tuner is getting particularly melodious!!
Geno, you could be right. The Tuner has been in sync last few weeks, but the market likes to move around and may jump the curb to higher levels at any time.
I have said before I expect us to take out the 666 low on SPX at some stage. Problem is timing lol.
J
J please may I ask what’s your rationale for expecting to take out the 666 low, regardless of timescale?
Thx in advance.
“On a long enough time line, the survival rate for everyone drops to zero.”
FWIW, my short is paying off. All Tuners are negative this week until at least Friday. Buyer beware, seller rejoice.
The man can do no wrong! Well played again, Valley.
I bow before you. Well done.
you da man… do you consider moon in specific signs + / – ?
Moon signs and declination are the same thing; i.e., Scorpio is always two days after equator crossing to South; Gemini is always at far North moon position, etc.
Thanks for the encouragement. Hope this continues.
valley You are on FIRE!!!!! The greenest of the greens I hope. Your VIC call is also playing out very nicely too. All commodities are crashing, and gold is moving down exactly like you said it would. Hats off to you!!!!
Erick, Thanks. VIC is only 12 days away. Going to be a good time to add some gold miners imho then and not look at them for a year or two, I believe Nicolas is wrong and that they will not go bankrupt.
Speaking of Nicolas, I wonder why he hasn’t been posting recently. I guess he will only post when the IBB is up 2 percent or more.
By the way, shorting from here to VIC may be fools errand as a few pop up days on the QQQ or DOW could make it not pay mostly cause prices are in the lower range of recent levels.
Valley, I thought you were very confident markets were going down (hard?) into 8./15. This sounds less so – has something changed? I understand about pop up days but assuming one can withstand a little volatility, isn’t the short opportunity here a robust one?
We are in the center of the weakest possible tuner rating and markets are stay in the middle of recent value which for a short term timing perspective means the tuner is unreliable. Also, Geno, whom I respect is calling for 2400 on ES. I like to be in positions where the tuner is weak and prices are strong. Right now prices are in middle of value and seem like they want to whipsaw next few days, even tho’ next week they may be down, there might be some whippy action next few days.
Valley, I’m looking for a small degree wave up in the DJIA to 18000ish (0.618 retracement from ATH to recent lows) before a bigger wave down below recent lows. Given that VIC is still 12 days away both seem achievable.
Any way that’s the way I’m playing it. I’m hoping to have the 18K target met in the next day or so and then spend the rest of the time going down.
We’ll see what transpires.
G’Luck
Thanks, Purvez. I am beginning to see the value of EW as a descriptive tool for market price action. Hope to learn more.
Valley a good source for the basics is Elliottwave International. There is quite a range of free education stuff on their site and they have a free ‘club’ which increases access.
Despite that their market calls on the U.S. have been atrocious. Lol.
Peggy and Steve T, I think it’s good also to think from 7/31 high decline into 8/7 low and rally into 14-17/8 high? Let see.
8/6 11:46 yes am expecting a short term low 8/7
Jeger,
I closed my long FTSE for 2.5% gain at 6704. Awaiting an opportunity to short again.
Regards,
Kerry
GM:
“I read over the weekend that Iranian super tankers are already shipping crude to the East (for storage maybe)?
The only way is down for crude IMO, next couple of years at least.”
Most of the Iranian fleet is “out of spec” at this point – I think only 4 or 5 (of ca. 24 vlcc’s) are currently capable of moving crude…..I will take a closer look when I get a chance.
J
Thanks. Also, don’t forget to drop me a quick line please.
Purvez: “J please may I ask what’s your rationale for expecting to take out the 666 low, regardless of timescale?
Thx in advance.”
You may indeed, and I am not sure I can give you a good answer. In short, I think future financial crises will be worse than the one we just had. The stock market has really nothing to do with vaulations or state of economies, it is all money flow based on perception, fear and greed. So this is a macro opinion based view if you like.
Secondly and from a different perspective, some of the sharp breakdowns below long term trendlines that we have seen since 2011 (and there haven’t been many) where the price has almost inexplicably clawed its way back, potentially point to an “expanding megaphone” type price action. One could draw lines to see the potential gradients for possible future timelines.
I am not trying to convince you I am right, I am open to the idea that we could surpass 666 to the downside, and with the financial system going where it seems to be going, I see this scenario as probable. In fact, I see it as more or less guaranteed on a long-term basis when we use a debt-based monetary system.
All the best.
J
Thx J, I understand your macro picture and concur with it. My reason for asking was because you are within the ‘trade’, you may have a more specific perspective that us folks outside may have missed.
J – The up wave from 3/6/09 tops in the area of 2049 – everything above that is high risk territory and distribution. Once we get going on the downside, the statiscal projection for retracement is 515.
17.6: “Jeger,
I closed my long FTSE for 2.5% gain at 6704. Awaiting an opportunity to short again.
Regards,
Kerry”
Nice, well played.
J
FAO Allan (and the board):
I’m looking to build (imminently) a portfolio of around 10 junior gold miners.
I have some names to share here, recommended by Brent Cook, whom I believe is highly regarded. More to follow, as I am pushed for time.
http://www.mining.com/web/nine-companies-brent-cook-expects-to-see-on-the-other-side-of-the-gold-market-wasteland/
Allan, if there are any names you (or anyone else) might like to suggest, I will be grateful, and will of course do my own due diligence and research.
Some of there names did 20x from 2008 to 2011, so from 2016 to 2020(?), maybe 100x is possible?
Hopefully we can all benefit from shared knowledge.
I have caught purvez’s typo illness, bugger it. (*these* names.)
Richmont mining (RIC) is interesting. Unlike most jr gold mining stocks, it has a relatively small float. Many have millions and millions of shares due to splits. It also just found another formation within their current mining operations which is thicker and richer. Ck data yourself, have not looked at it in years.
Thanks Kent, will do.
Peggy, is there anywhere I can read a bit more on the ‘basis’ of the Spiral and particularly it’s correlation to the Stock Market?
From what I’ve read the calculations for the Spiral were done over 12 years ago and from what I can gather are mathematical in nature rather than statistical i.e. only one answer.
My impression of the Spiral’s performance so far is that it seems to be very accurate on time and has a margin of probability for price level. So I’m trying to understand why there is a margin of probability for an otherwise mathematically derived function?
Of course this may well be proprietary info in which case that’s ok.
Thx
agree – there should be no margin of probability. I credit what there is to user error. The difficulty is remembering to account for “Z”, the 3rd dimension – the Spiral radius. For example, the 7/27 low occurred after the Expansion high as the Spiral was contracting at the expected octet position on the Spiral but also at the 1/8 point of Z during the contraction. This propelled the electrons back up the tilt for a wave 2. Fluid dynamics! This is the best place to watch and learn. http://www.ustream.tv/channel/7442-analytics
Thx for the explanation Peggy. So the person who derived this function is also subject to user error? The error can only be in the translation from the Spiral’s data to the equivalent Stock Market projection, so I guess that ‘translation’ equation perhaps needs further tuning.
my user error
Purvez,
If I may add a thought, although Peggy is far better at the Spiral than I (and Sean is on another level altogether). I believe that there are multiple levels to the spiral that can be examined. I prefer the vacation method. Take a position and go away, swing trade, of using the Spirals 0* to 45* Tilt angle (singularity to max expansion) as the major low high trend trading cycle. Within that cycle there are several important angle degrees ( or radials) that are important to watch. Inside 3.0 to 3.5, inside 1. There are smaller cycles that are on the 30 minute and even 10 minute level. The calculations are mathematical certainty. For me, it seems that the further into the micro cycles you go, the more challenging the interpretation. But the #’s do not change. But it is very doable, in my opinion. At this Spiral level, the focus is time, however, be aware that the effects of weekends and other off trading times can impact perceived highs and lows. The Spiral really is a study of time, in my opinion. But the Spiral can also be applied to price levels, which tend to repeat. Although related, Sean’s Market BIOS really focuses on price levels, and I believe reflects a certain level of probability in the construction. It is a vast improvement over Elliot Wave. I hope this helps. The main challenge for you is too check ALL of your preconceived views of market inter petition at the door. You do not have to be a astro-physicist, just have an open mind that desires to think outside the box. Time is not linear.
Thanks Steve, that’s a really good way of thinking about the Spiral. I’ll have another go and trying my hand at it.
Hi all,
I was wondering, what do you guys think we are up to now?
My own plan (looking at my turning date system): 3 August I had a turning date, so let’s say that one is oké and we head down now. Therefore I am short.
Next up, 7 August and 11 August I also have turning dates but 1 of them will not be significant I guess. So, I am wondering if this 7/11 August will be ‘the’ bottom for now and than up till 19 August. Or will it just be a bottom little up in 19 August and than full speed down?
@valley/Peggy, what are your targets and at which date do you see these targets happen?
I like to hear from you, thank you in advance!
Greetings,
Wouter
PS: I am not giving targets since I follow the AEX (Dutch Stock Exchange) and this is not relevant for the most of you out here. 😉
Good to have someone following closely another tradable instrument. Would be really interested in seeing if the AEX has similar moves to the DOW and if they lead the DOW or follow since the AEX opens earlier could it be a signal for the next days DOW performance? The Tuner is useful when it is in sync, pointing down this week, turns positive next week but VIC end of next week so not too positive. Price is key and since we are in the middle of recent value, more risk of getting into a trade.
Hi valley,
AEX follows the US market. 😉 So the US is kinda always ahead of us…
Oké so if I understand it correctly, you also say down till 7 August and than 10 August a little up until the VIC.
Thanks for sharing.
Greetings,
W
Yes, that is correct. Any insights into the AEX would be appreciated.
Well, regarding the AEX, you can clearly see that today it does not go up that much (0,3% up atm) in comparison to the DAX which goes up for about 1%. Why? The DAX didn’t retrace 61,8% already while the AEX already did 78,6% on August 3! The AEX is often late, however this time it was fast. 🙂
Cheers,
W
PS: it looks like a top @ August 7 to me now valley and a bottom at somehwere next week 13-15 August?
Some of these charts are eye-opening:
http://www.mauldineconomics.com/connecting-the-dots/6-warning-signs-that-the-economy-is-in-trouble
AAPL – not seeing much concern, but am seeing tremendous damage
cue don meredith..
Peter_ I’ve been referring to your recent Bearest Count chart quite often and relating it to the DJIA which I trade and follow. I am expecting a further ‘up’ in the DJIA which suggests that your ‘b’ will need to be moved upwards and possibly to a new high (marginal high).
We’ll see what actually happens.
GM, for gold miners that will definitely do well in the future, regardless if gold remains weak at current prices, here are two that should be reviewed more thoroughly: LSG and EDVMF. Both are solid cash flow generators but Endeavour is African based and has a bit more debt balanced by 500K+ ounces making it highly leveraged to price of gold.
One more speculative one (that I would not buy now until gold cycle bottoms and bases out) might be TGD. I am unsure if they can weather the storm before it becomes a complete penny stock or out of business due to some ill timed acquisitions that require capex, but if they survive then it could reap huge returns if they turn it all around.
Thanks Steve.
EDVMF seem bullish, even at current prices, they’re still profitable, and generated 5c a share in the quarter, yet the share price is only 37c. Plenty of potential, assuming gold prices perk up.
http://finance.yahoo.com/news/endeavour-mining-q2-2015-aisc-210000760.html
Specie, damn right…..technically speaking damage is being done…..but is it just another lameass fakeout as it has been for a loooong time…?
J
J – good question, trying to be as objective as i can, the damage appears to be different than that of any other pull back since ’08. the island reversal inside an island reversal is one rare chart formation – it says to me an unbelieveable complacency that can only be rectified by much lower prices – but i could be wrong
specie,
can you post a chart? thanks
Hi Bluestar – first let me say i admire your work, i think i see you post at fearless forcasters too sometimes
my charting options at work are rather limited but i noticed that erin at decisionpoint posted some nice charts last night that convey what i was watching
http://stockcharts.com/articles/decisionpoint/2015/08/taking-a-byte-out-of-apple.html
ON a slight different note regarding Oil/Oil sector, here is a table with company, capex change and production change (from previous to most recent announcement). The big guns have still to provide guidance….:
http://tinypic.com/r/2d0grbs/8
Make of it what you will, indicative of larger trend or not….?
J
Not just oil, seems global trade is grinding ever lower.
http://www.businesstimes.com.sg/transport/asia-europe-container-freight-rates-fell-228-last-week
I get the feeling the US markets are shortly about to finally wake up to reality.
For those who believe in the myth of central bank power, this will get you thinking:
http://www.zerohedge.com/news/2015-07-29/russell-napier-asks-what-happens-when-markets-realize-china-forced-seller-treasurys
My brother’s job in the 1980’s was shutting down oil in the gulf of Mexico. The price of oil bottomed over 10 years later. The discoveries in the boom and the conservation measures set in motion due to high prices took years, and will play out for years
valleyofmoon999@gmail.com (J of SR email me please)
My gosh, the quality of the thread lately has been unparallel. Serious, intelligent, interesting. I don’t think there’s a better one out there – and props to our host, John. He sets the tone –
And Nic, you ARE welcomed back.
“And Nic, you ARE welcomed back.”
Steady on, there is no need for such extreme measures, surely?
hahah
J
Maybe I was being rash 🙂
For all those that followed my DAX trades well done. Looking at 300 pips profit from 11150 and there is still much more to go over the rest of the year. I think there may still be another week of strength before another dip and then full steam ahead into year end.
Well done for following your trades? Why thank you Krish! LOL
J
Half ETF longs closed for 350 pip profit. Feels really good when your against the crowd trade works out so well 😀
The ‘crowd’ are still in there with you I reckon.
Imagine how many more pips you could have captured if you’d been playing the prevailing trend (down) or both up and down.
I think taking profits now is wise, still gaps below to fill, and unless we see 11,800 taken out, it’s back down again IMO.
Good luck.
This one’s for Allan, and other Armstrong watchers:
Click to access armstrongeconomics-a-total-eclipse-of-the-economy-and-good-old-fashion-us-witch-hunt-12-22-2010.pdf
Check his gold price prediction on page 6. Gold promoters eh? LOL.
Hey GM I read this article when it was published and I have said it before multiple times to the Martin Armstrong cheerleaders that HE, “the great wise one”, was as wrong as anyone about gold,interest rates, and the markets.
The audacity of this guy to tear strips off gold analysts and the gold bugs when HE was banging the drum on gold back then and sending, possible 10’s of thousands of retail investors into gold and gold stocks only to now be doing the opposite, at a time when they SHOULD BE BUYING!
As for your request RE gold miners I have limited exposure to NA miners, but I can reccomend a look at LSG, which I believe will at some point easily be a 20-30 bagger from these levels, and Crocodile Gold.
I really like the potential of Seabridge Gold but it is heavily reliant upon a higher gold price, which I know sounds an obvious statement to make, but it’s success will be all about its leverage. If the gold price increases dramatically, their profits will explode as will their SP.
Cheers
MA, what a stooge!
Oh BTW back around 2012 MA said the AUD was on its way to double against the USD. At the time it was just above parity.
I’ll see if I can find it?
Thanks Allan.
GM, mate old habits die young. i meant to say Newmarket Gold 😉
I know the mines and in an environment where most producers are doing it really hard, they are chugging along. That augers well for the future.
Oh and f there was evere any doubt in anyone’s mind to what degree the Fed has manipulated the stock markets and thus metals markets, the chart in this article should erase all doubt that it is no less than 100%.
http://www.minyanville.com/business-news/markets/articles/Here2527s-How-Deeply-The-Fed-Is/10/25/2013/id/52399
Allan, much as I’d like to have Mr Callanos’ prediction happen, to base it off ONE historical piece of data is a bit rich for me.
We are and remain in uncharted territory….so anything GOES but to make firm predictions of off that shaky ground is highly dubious.
Purvez, believe it, don’t believe it. I haven’t yet checked his data but have no reason to doubt them or his results, but the striking difference pre 2009 to post 2009 is undeniable.
Allan, yes like many other things pre post 2009 the outcomes are undeniable. My ‘quarrel’, if you can call it that, was his ‘firm’ prediction out of ONE data point. Particularly when almost everything ‘financial’ is in uncharted territory.
If someone had told me 2 years ago that we would have negative interest rates I would have asked for a ‘breathalyser test’. Lol.
With respect to Armstrong, he is obviously not omniscient and his gold prediction was faulty. However, did you notice his stock market prediction back in December 2011. He predicted it would be in expansion mode until 2015.75. That works out to some time in September. Not too bad.
argonaut4, I don’t know how long you’ve been following Mr Armstrong, but I for one have waned simply because of his ‘repetition’ on how the US did him wrong.
Someone earlier said he had a narcissistic disorder, and I know nothing about that syndrome but I have some very close encounters with Obsessive Compulsive Disorder (OCD) family members and I have often thought him to be in that camp.
However neither of those precludes him from making some very good market calls.
I guess what I’m trying to say is that he ‘grinds on me’ now a days.
‘Just’ looking at the charts I’m changing my opinion slightly about the markets next action. I’m now expecting a retest or just lower of the late July lows before the ramp up to 18000 in the DJIA.
Let’s see what really transpires.
@Peggy, what levels do you see for now? Going up or down?
Greetings,
W
spiraling. … 😉 lunatic wise Monday is a dark day
posted earlier – 2074, 2066, 2058. Then bounce, then lower.
Purvez and valley – I cashed in my SPY calls today – Kinda lost in transition right here. did pick up some NFLX puts today.
Good call Geno, I was in cash last night and reshorted at top this morning. Won’t be short overnight.
How’s your tuner look for Friday and next week? All my cycle work says bullish, but daily indicators are still overbought. Swing Trend Indicator went back on Full sell today, which is unusual!
Will go long at Friday’s close. Next week “could” be a banner bullish week even tho’ VIC is on next Saturday which is a wild card. Exited short few minutes ago, will look to short again tomorrow at highest price possible.
Hi Geno
That’s quite astute!! As I said earlier I’m looking for a low first BEFORE my 18K DJIA call.
However have to say this market’s chop is starting to ‘get’ to me. I’m almost inclined to ‘hedge’ and walk away for a a couple of days until things become clearer.
At times like these I DO like to be IN the market (but fully hedged) because then I can capture whatever move happens. Otherwise I’m forever regretting not taking one side OR the other.
Aaaah this ‘game playing’ is hard work.
I have bought a load of gold miners (within a managed fund) today. On a 2 year horizon, 4x minimum, up to maybe 10x from these levels. Client funds, so focussed on the big miners. I smell blood on the streets at these levels.
FWIW, I think gold might plunge down another bit, to around $1,000, within the summer period, but I think miners have had the bulk of their plunge already, hence the buying.
Prob sub 1,000 to 980-940 area. NEM is looking attractive down here.
GM wish you ALL SUCCESS with your position. Do you have time scale in mind? Or just a multiple that you’d like to see?
Thanks p.
Thinking more in terms of events that lie ahead, and will keep hold of miners and gold til those events have passed, skimming off some profits along the way I hope, as PEs on the markets plunge to 5 or 6.
Events include: Euro sovereign defaults, banks defaulting, Japan/UK/US currency collapses. Hopefully events will not include global nuclear war.
Doom list update:
#1 Price Action
#2 Planetary alignment
#3 Natural disaster – asteriods; mini-ice age etc.
#4 Biblical
#5 Pensions
#6 Jim Carrey’s Dumb and Dumber III gets financing.
#7 Puetz crash window – oh dear – wish I hadn’t read that one.
#8 Nicolas changes his investment thesis to Gold.
#9 Global Thermonuclear war
Donald Trump is elected Prime Minister of Australia.
Al
What are the top Gold Stocks in Australia that you would recommend. Probably a better option buying gold stocks then physical gold at the moment due to the value of the AD.
I can tell you that this mining bust is having a massive impact on Queensland and WA. Housing markets in many mining towns has halved. Emerald has 300 vacant homes at the moment which 3 years ago where worth 500k plus and renting for over $1000/week. All this is just starting to flow into places like Brisbane. Misery ahead.
One thing that is starting to look bullish and money is starting to circulate around is Agriculture. Could be something to watch closely. Been in the doldrums for years.
Maybe…market continues down into New Moon on August 14, day before VIC. If 1999 is pattern (which had VIC about same time), DOW may bottom on 14th and then rise 10% by end of year (with usual seasonal patterns).
If 1999 is pattern, from August 14 gold miners “could” rally into mid October and then continue slide from there until the rise like a Phoenix into the stratosphere.
What is VIC? Sorry if it is obvious.
Venus Inferior Conjunction which is when Venus moves across the face of the sun and changes from evening “star” to 8 months of being the morning star. In past VIC market has lowered into VIC and risen months following.
Thanks! I would NEVER have guessed that!
New post
valley, how do you see Monday the 10th?. lunatic trader shows it as a black phase.
John, can I begin by saying your analysis is excellent overall. I believe you have been focused on the wrong asset class when doing the analysis. If you look at your solar chart versus commodities it fits perfectly. Also conmodities are the over priced (in historic real terms due to fear), over owned (less so now), centre of speculation (gold buying shops on high street). They peaked in 11 around the first high of the max and held up last year until after the second high of the max. You can add commodity producing countries into this. Like the max in the 70’s it was a commodity peak not a stock one. Do you think there is logic to this argument? Everything makes sense.
Having said all this I do not rule out a correction in the better assets in the next couple of months as they are dragged lower but oil at $40 is positive not negative. U.S. Demographics are improving for the first time since 2000 and the technological change you talk about for the next solar max has started.
Interested in your thoughts. P.s. When I shot down gold in 2012 on a gold bug site I got crucified was the final nail for me. Pps I would love to see your updated chart of the solar max, geo and lunar updated in real time and more prominent in your posts as before. Brilliant work. Keep it up.
Sorry, for clarity the reason I would like to see the updated chart to determine whether commodities can put in a sustained low which could help the markets avoid the steep correction over the next couple of months. Thanks again.
Adrianjpdoyle. I have been using Gann’s Master Time Factor (MTF), 60 yr cycle. It has shown the turning points for commodities very well. It is a 20 year bear market, but a 2 yr bear mkt rally is due Dec 2015. Does your work agree with this, or what are you showing? I like your idea of using commodities, the energy does not always have to be the stock mkt or RE, and the commodity super cycle absorbed a lot of energy which is now gone it trulynwas a super cycle, and the commodity double top coinciding with the solar cycle double top, interesting.