

Yesterday was an up day for bonds, commodities, gold/miners, and equities, i.e. both pro-risk and anti-risk. Confused?
Retail sales came in weak, not just for last month, but for the revised previous month too. The string of poor economic data, in line with leading indicator forecasts of growth having peaked out, has resulted in progressive revisions to Q4 2013 GDP estimates – here is Barclays:

Source: Business Insider
Q1 2014 GDP estimates have also been cut, with Credit Suisse reducing from 2.6% to 1.6%.
The latest picture for the Q4 earnings season shows blended revenue growth at just 0.8%, and of those companies who have given forward guidance for Q1 2014, 80% have given negative rather than positive guidance.
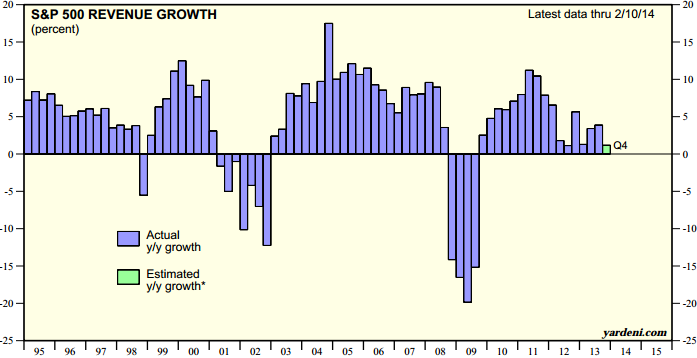
Source: Ed Yardeni
Last year’s multiple-expansion rally in equities was justified on the stock market front-running a return to ‘normal’ economic growth and earnings growth, as well as the underpinning of ‘Fed policy trumps all’. With QE now being wound down, economic data worsening rather than improving, and earnings still disappointing both in terms of revenues and forward guidance, the case for anti-risk is strengthening, and the rally in stocks suspect.
Yesterday ahead of US stock market open, futures were down and equities around the world were struggling to attract buyers, then the retail sales data hit and the scene was set for a bearish US session. But the opposite occurred: a ‘stick save’ as short stops were run and bulls delivered a trend day up. We saw this occurring in January:
 Eventually this gave way to the high volume decline days.
Yesterday’s volume was again weak, relative to the declines leading into the 6 day rally:
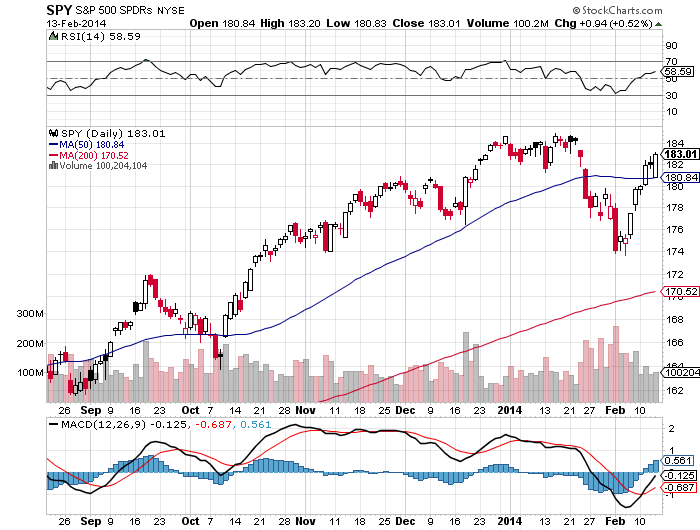
Source: Stockcharts
Complacent put/call went lower, Skew remains elevated, and defensive rather than cyclical sectors continue to lead in 2014:

Source: Charlie Bilello
From a bullish perspective, small caps outperformed yesterday and advance-declines continue to be strong:
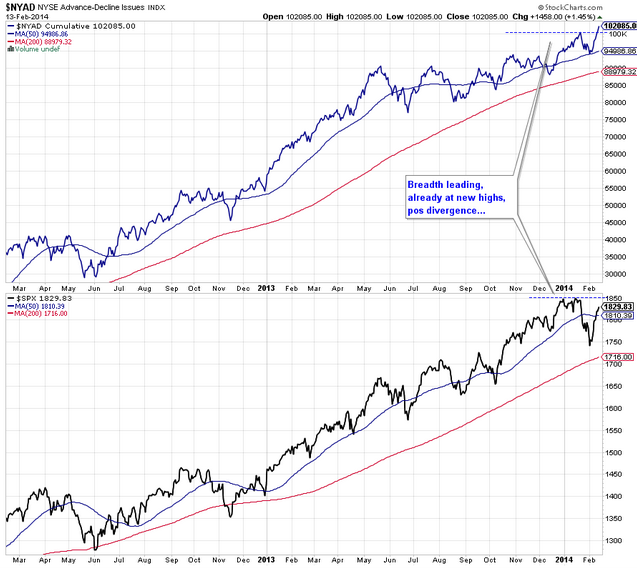
Source: Charlie Bilello
Today is the full moon, which could spell an inversion in equities. The Nasdaq 100 joined the Nasdaq Composite yesterday in making marginal new highs, but it did so on a divergence in breadth (as measured by % above 200MA). So I now watch to see whether the other US indices follow suit or all roll over from here. If the latter, then it could turn out to be the sweet spot of the top of the ‘second chance’, namely the optimal time to short, but if the former, it would open up the prospect of a longer topping process in equities. That makes it a fairly delicate position. If you have been reading my recent posts, then I have a multi-angled case for equities to roll over from here, and the developments behind the price action (volume, defensive asset flows, economic data, etc) have strengthened that case rather than weakening it. So I continue to gradually add shorts into this rally and rebuild towards my intended ‘full’ short position, until the ‘clues’ change.
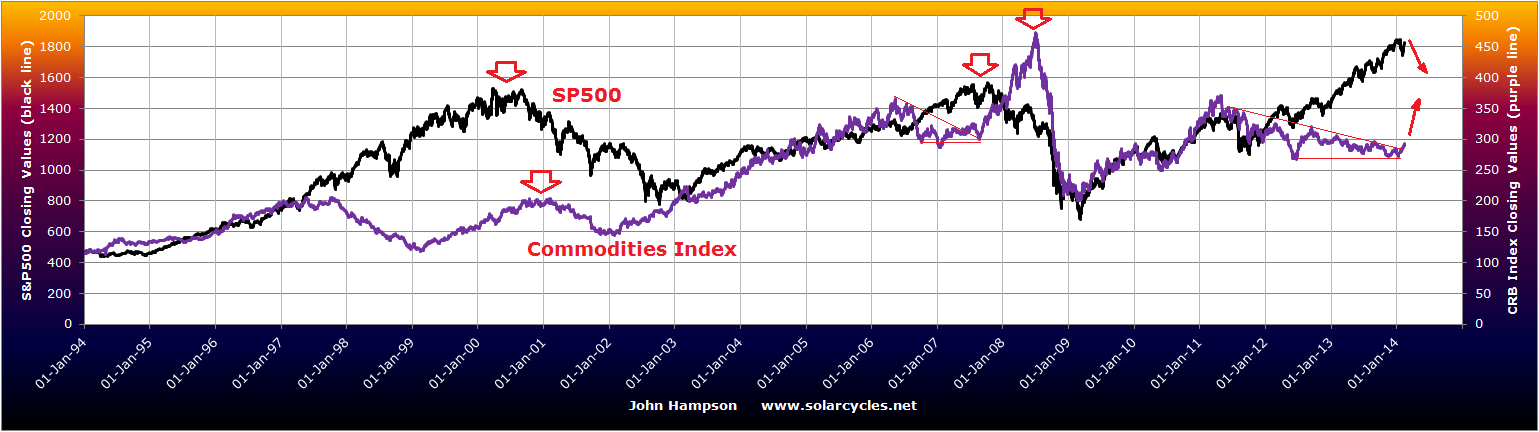
The case for commodities making a late cyclical charge now looks more compelling, with new broad momentum in the class, and siginificant breakouts. Commodities typically top out after equities and once the economy has begun to weaken, sucking the remaining life out of it. On the chart below we can see the last two such occurrences. In 2007 commodities broke out of their consolidation and into a steep rally as equities topped, and I expect similar developments this time. We have been seeing the US dollar weaken on the down days for equities, which should accelerate commodities as equities fall.

John, I have to say that your analysis and commentary has been a revelation to me since I first visited your site a couple of months ago. There are so few commentators (many of who are seasoned experts) who don’t have a personal agenda, often resulting in very biased analyses and comments. As an investor and trader for over 30 years I find your work so refreshing and original! All the best to you and your trading. And many thanks for allowing us all to share our opinions on your site.
Many thanks Simon
Washington’s birthday on Monday may also deter a bullish Friday.
Thanks, 3 day US weekend.
Hi, John, as i read you yesterday, I thought you expected the highs in the end of feb´14 with the full moon, but the day before and today insinuate the top is today, because the full moon.
Could you clarify, please. Thanks.
Friday or monday is closed WS?
@apanalis
Monday closed. 9 trading days after today before Mon 3 Mar. After the momentum rally of the last few days, it is unlikely we start going down without a little doji consolidation first. Say the rally completes with a final up day today into the full moon but a weaker close, then we gently roll over next week, then the declines begin in earnest, then the major down day hits 3 Mar. Look at yesterday’s charts and see the major down days didn’t occur the day after the second chance peak.
Understand I am making a case for these dates based on historic potential. I would not say ‘I expect’ this day to deliver that, only that I have a case.
I think it took strong determination and deep pockets to push the markets up without a look back yesterday despite bad retail sales. If this was due to the imminent expiration week and and a strong interest in high stock market levels next Friday, then a continuing decline will need very bad news in the coming days.
I ´m traying to understand your point, Jonh:
Even thought the major decline is expecting the 3dr of march-new moon, do you think the top is finished more or less last friday with thr full moon?
@apanalis
Hi, John again, let´s see if I understand it:
You expect a big decline the 3rd of march- new moon, even thought the top is on the way- full moon.
@apanalis
Correct
And statistically the day after President’s Day has historically been bearish:
http://blog.stocktradersalmanac.com/post/Presidents-Day-Weekend-Frequently-Interrupts-Rally
Good morning,
I provide the following note that I find “interesting.”
John, excellent site!
best regards.
pd: sorry if there are spelling errors, I’m using web translator.
http://usawatchdog.com/united-states-currency-weak-and-about-to-crash-karen-hudes/
Thanks Adrian
This impasse reminds of the Frankie Laine {1913-2007} song at High Noon…
http://tinyurl.com/oa9lu95 (skip advert)
God bless him.
Otherwise beware the power of hypomania, which can be troublesome if the afflicted engage in risky activities (symptomatic).
Hi John,
Just to clarify your current forecast, you are thinking today is the last up day, and then we move into waterfall declines in the next 2 weeks since you still perceive we are in the “second chance”
That forecast only changes if we make new highs and then you would expect a longer topping process until June, correct?
It seems every headline is trying to backstop the market, today was the Eurozone growth …
Thanks!
I’d keep it simpler for now. The stock market topped 31 Dec 2013, and I maintain that until the Dow breaks above its Dec 31 price. Assuming that does not happen, then that makes this rally part of the second chance.
Todays strength makes me believe that prediction is not coming true. we still have few hours for the market to reverse.
Today’s strength could also be representative of short covering by ’29 analogy followers, they are likely the last to cover because of the deep retrace the analogy called for, once that has dried up prices may resume downward.
Momentum is waning in both NDX and Russell 2000.
I see Russell 2K PE at around 80. I would like to see a mean aversion as my (iron) stomach is being tested. I know my time-frame.
Sweet spot day theory sure looks probable at the close.
I think this commodities levitation is very temporary. The fed will not allow the economy to be sucked out of life again. They can not be stupid.
Hi Jason
You seem to assume that the Feds know what they are doing. From my perspective, given the dot com & housing bubbles, you faith may be misplaced.
Hi John. My cycles still look for a top around Feb 24, that could extend to the end of that week (Feb 28). March is the crucial time, given that this is a weak cycle and therefore should trend down from March 1 to the summer. If March turns out strong, it may morph this cycle back to bullish
Here is a very interesting article on how solar maximums effect weather (which is playing out this year). Its effect on humanity and all other living systems is logical.
http://www.giss.nasa.gov/research/briefs/rind_03/
John (others) I know this may sound rather sophomoric; but does your research show anything of historical predictive significance during ‘blood moons’? I realize a blood moon is also a full moon; but I thought I’d ask if there was anything further to add. Cheers.
As it happens I was looking into market bottoms. The blood moon is the name for the October full moon. It may not surprise you that several major bottoms occurred close to the October full moon = geomag seasonal inverted low and lunar low.
Thanks for your input all
FYI,
http://blogs.marketwatch.com/thetell/2014/02/17/soros-doubles-a-bearish-bet-on-the-sp-500-to-the-tune-of-1-3-billion/
Thanks
Without going into the controversy if my elliot wave count is correct or not, I show you the scenario I think more likely in the coming months as a function of the Dow / gold
Noting the dow / gold ratio, this still suggests that lack indexes to fall. In other words, before falling going up even more.
Given that this is a “ratio”, there is more than a way for it to move in any direction.
Now, looking at the graph it appears that the “ratio” will go up, and I think more likely in the short term, the Dow is up and gold down.
best regards
pd: if there are errors in the drafting, know understand that I am using a web translator.
https://www.tradingview.com/x/tcmlZnzt/
Hello John
Iv been following your site for a few weeks now and I find it very interesting and informative.
Just one question, when a correction does indeed happen, in your opinion will gold and silver will be dragged down during a panic sell?
It does not happen often but it did occur during the 2008 crash.
Thank you in advance.
To some degree, yes. Forced liquidations due to the leverage means there will be some blanket selling. But if it were to occur now, then precious metals and miners do not start from the kind of peak that they did in 2008, so I would expect less.
Thank you John,, I just suspect that a few longs might be taken out if the market really falls.
we will just have to wait and see.
I ran across the work of a fellow named MichaelJ. He is a very industrious chap and has gone to the effort to compare the current market not just to 1929 or 1987 but to numerous peaks earlier in US and a few overseas. Once normalized to the major low these charts all look similar. Once the market goes parabolic, the end is the same, but the “ringing” behavior off the peak varies. Sometimes there is one ‘second chance” sometimes two or even three. The closest analog to now was 1946. According to MichaelJ, “Should a 1946 event occur then look for a secondary low ~Feb 25, followed by another lower high in mid-March. Then down into early April.”
I thought this was worth sharing.
Jim
Thanks, do you have a link?
Hi John
Here is MichaelJ’s twitter link https://twitter.com/mjb4632
John
Thank you John for your feedback. From a cursory examination of all the blood moon dates; I too noticed that they seemed to note a low; or bottom which I believe is due partially at least to the Kondratieff theory.
Maybe “blood” moons coincide with lows because they are associated with panics?
As I understand it, the blood-redness is caused by the full moon being low in the sky shortly after sunset. Gann’s financial timetable is based on the Lunar Declination Cycle (the height of the moon in the sky), which predicts a panic around 2015 – due to the Minor Lunar Standstill.
There will be four total lunar eclipses in a row during 2014 and 2015 – these are also closely associated with lunar declination. There will be no partial eclipses between them. I don’t know how often this happens – I’m guessing not very often. Does anyone know the last time?
Gann also associated the number 7 with panic: on 17 September 2001, when the markets reopened after the Twin Towers attacks, the Dow lost 700 points (7%). 7 years later on 29 September 2008 it lost 777 points (7%). 7 years after that takes us to 13 September 2015 (closest trading day will be 11 September)…
These dates all mark Rosh Hashanah, the Jewish new year – which is based on lunar cycles.
Click to access blood.pdf
Courtesy of Kerry:
http://www.17yearstockmarketcycle.com/2013/03/kerry-balentrhiran-on-investors.html
1949 – 1967 – etc.
Mark, thank you for showing us this valuable data on the blood moons. And, the blood moon prior to 1949 was 1492. If you like I can post the exact dates. Cheers.
Hi eclectic,
Yes, I’d like to see those dates you have. Is it the case that we’ve seen a series of these blood moon tetrads relatively recently, but there had been none for hundreds of years beforehand?
It seems to me that humans respond to sights in the sky (new/full moons and eclipses) because they are a vivid reminder of something which influences us in a fundamental, but subconcious, way: new moons shield the earth to some extent from solar wind ionisation, wheras full moons reflect some of it back to us. This effect is then modulated significantly by lunar declination.
This modulation is at its maximum when the moon is directly between us and the sun – in other words, at times when we witness total solar eclipses at new moons. The same also applies to total lunar eclipses at full moons.
We are now in the early stages of maximum disruption to the solar wind culminating between 2014/5 tetrad and the 2018 triad. This will be an especially trying period for the scientifically-minded, who had become accustomed to extrapolating the recent past into the future. No doubt you’ve noticed the number of intelligent people repeatedly claiming that SC24 has peaked while it has gradually been strengthening – they are effectively willing an end to the disruption, when it is really only beginning to get going..!
Hi Mark, do you expect the smoothed solar max is still ahead? I know you referenced the similar historic cycles on solen previously, but they all point to us now gradually moving down from the peak.
darklordblog – many thanks for those links.
There’s a wealth of interesting information in Mr Vega’s page alone, and I’ll definately be looking through his other work. I like the red Phi spiral connecting the 1949 and 1967 blood moon tetrads/major lunar standstills to the upcoming 2015 tetrad/monor lunar standstill, and how it intersects the timeline at 2006/7 – the last major standstill.
The incidences of dates and timescales in front of us is quite startling – including September 2015. And there are strong indications of a major showdown in the Middle East.
I hadn’t noticed that the March 2015 total solar eclipse coincided with a major timeline I have for gold (part of a series including June 2013; January 2014, July 2014), which could also fit with Kerry’s gold cycle. However, my final gold timeline is May 2016, and I am not expecting gold to peak until at least then.
Regards.
Hi John,
You written before, and we’ve discussed a couple of times, that how the SSN peak typically determines the asset peak. But that only applies to the high sunspot/short duration solar cycles. We now know that SC24 is a typical low sunspot/long duration cycle, with an undulating plateau comprising three or four minor peaks of roughly similar amplitude.
In previous such low cycles, the timing of the highest SSN peak has not been important. Rather, speculation continued to build right out beyond the final minor plateau undulation. http://www.solen.info/solar/images/comparison_similar_cycles.png
We are now around month 60 on this chart, and as you say the SSN is due to imminently fall away significantly. But when I look at cycles 16 (1920s Dow) and 14 (1900s commodities) for example, I see that speculation continued to increase beyond those final, smaller SSN peaks. In other words, assets only peaked when the SSN had unequivocally fallen away from beneath. These two solar cycles suggest that we could easily still be two years away from the asset peak. (Dow data from that period is reliable, but commodities data less so – not least because gold and silver were under some form of government control).
I’ve also previously posted cycle studies which indicate that the solar dipole reversal will have difficulty asserting itself, resulting in sunspot activity persisting for longer than we have become used to over the last few cycles. (I wouldn’t bet my money based on this alone though). In fact, the sun’s northern field strength has been recently drifting backwards – something to keep an eye on…
Additionally, the neutron monitors around the world are not yet showing the sudden declines that preceded cycles 20-23 solar peaks by 6 to 18 months.
So all in all, I think the exact timing of the SC 24 SSN will prove to be a red herring – the critical thing will be just how long sunspots keep appearing at or near recent levels..