

It’s been a while, so here’s how things now stand.
1. The topping process kicked off at the turn of the year with a gradual shift to defensives, as represented here by stocks:bonds, consumer discretionary:utilities, high yield:treasuries and small caps:all caps.

Source: Stockcharts
2. The shift to defensives was a global phenomenon, shown here by German, Japanese and UK bond yields, as well as US.

3. The smoothed solar maximum is likely to have been April 2014. Historically, peak speculation and appetite for risk assets has topped close to that:
 Source: Solen
4. In keeping with that, margin debt peaked in February, the commodities index peaked in April and certain breadth measures peaked around that time:

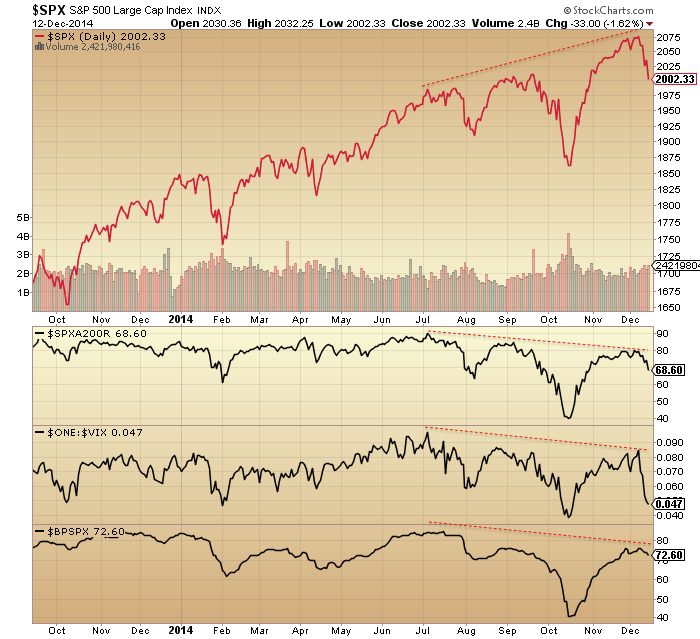
5. Then either side of that, the move to defensives occurred as of January and the price topping formation in equities took place in the window from July to November, with US large cap stock prices rising in a megaphone formation whilst the remaining supports for equities were dismantled and many flags were raised. Here shown are breadth, volatility, bullishness, junk bonds and leveraged loans as examples.

6. Considering the final thrust to the peak to be the rally from October to the start of December, then its size and duration fits in well with similar topping thrusts from history:
2000: 17% in 23 days
2007: 15% in 39 days
2010: 16% in 55 days
2014: 14.5% in 37 days
So is this finally it? Dare we dream that equities have topped out and are now in a bear market? Yes we do.
7. A key change in the last two weeks has been that the remaining leaders appear to have finally reversed, such as the Sensex, Nasdaq 100, Apple, USD/JPY and the Nikkei. These are tentative reversals but the point is they have aligned in the declines.
8. Looking at the bigger picture, households are about as exposed to equities are they likely to be (given no demographic tailwind):
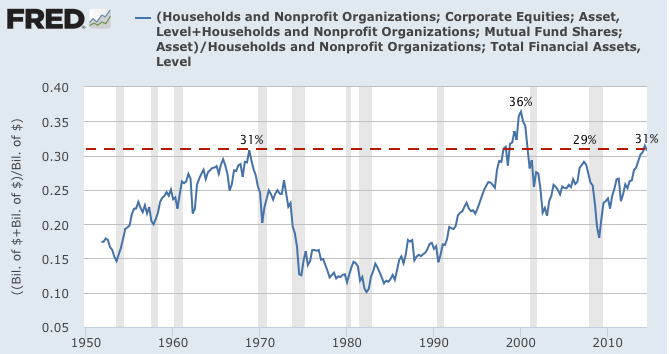
Source: Fat-Pitch
9. Dittto, valuations are as high as they likely to reach:
Source: DShort
10. Sentiment is as lop-sided as it could be:

Source: Yardeni
11. Leading indicators for the US are negative:

Source: DShort
12. Corporate earnings for Q4 have been sharply revised downwards due to both the high dollar and falling oil price.
13. Put/Call ratio is signalling further price declines:

Source: Barrons
14. Stocks are nowhere near oversold yet:
 Source: Charlie Bilello
15. However, Rob Hannah’s capitulative breadth hit 5 at the close of the week, suggesting more selling Monday/Tuesday could take this to exhaustion levels.
16. Which brings us to the phenomenon I have covered before: selling right into the close on Friday can trigger steeper selling on Monday due to weekend reflection. Is this finally going to happen? Allocations, sentiment and Skew are all set for it to occur.
17. But what about the favourable seasonality of year end, the ‘Santa rally’ in the second half of December?:
 Source: Sentimentrader/UKarlewitz
There is upward pressure into the Dec 22 new moon and a limited history of bull market peaks occurring near the last trading day of the year. Offsetting that, we have downward real geomagnetism pressure at this time of year, and that megaphone price topping formation which ought to now have a destiny with the lower boundary given the overthrow turned out to be just that. Meanwhile gold has built out a compelling bottom and is ready for a rally at the expense of stocks.
The whole topping process is already on borrowed time versus the solar maximum, and indices such as RUT and DAX stretched about as far as they could again in November without jeopardising the topping process. Therefore, I see reasonable odds that the Santa rally won’t happen. In mirror topping years 2000 and 2007, December was a down month both times.
Let’s see if Monday opens the selling floodgates. The key should be a gap down open, with weakness starting from early in Asia/Europe. Should stocks alternatively garner support again then maybe they can hold up into the end of Dec before finally rolling over. But it’s high time we saw weakness into Friday’s close follow through, against that sentiment/allocation/skew backdrop.

Welcome back John.
The next few months are likely to be a great final chance to accumulate gold miners, before the market works out these stocks are different from other sectors again.
Go watch the Draghi presser, specifically the question re QEing into gold. His answer was a deliberate misdirection in my opinion, his nervous giggle a big tell. But it will keep the gold price low for their inevitable bid next year.
Good luck.
Yes! Welcome back again John. I wanted to post this question before it becomes lost within all the inflowing posts.
Subject: SoLunar Data
Trying to understand the confusion on my part regards the following chart.
http://time-price-research-astrofin.blogspot.com/search/label/John%20Alden%20Knight
The green arrows point to the calendar days showing the lowest ratings; while the red arrows point to the calendar days showing the highest ratings.
Where is the ‘rating’ data that distinguishes those DAYS; and what does it mean?
And, under “Speculators = Fish + Game?”; Dec 19, 20 and 21 how are these ‘best’ DAYS arrived at because the results seem to be inconsistent with the previous chart?
http://time-price-research-astrofin.blogspot.com/search/label/John%20Alden%20Knight
Thank you for any help the group can provide as I’m very appreciative for your feedback. Cheers.
I looked into this as well. It’s enough to point out on here, but then I was going to integrate it with other data (informatics) to see what if anything is detected. No easy job and haven’t had the time, but my gut tells me something is there. The biological responses of all animal cells irrespective of species should respond similar on a quantum mechanics level to changes in light.
Thank you John, very well done. We might see a bounce off the 1998SPX to 2002SPX area due to a 200 moving average ( noted on CNBC). And we might see a bounce off the Fib. (possible support) at 1990.50 SPX area. If we see a strong abc bounce from one of these levels, the abc bounce would fit well as a wave 2. A wave 2 is a wild card that can be strong or weak, but it is almost always quick in terms of time. It could possibly end by the 17th or 18th of Dec. if it starts its correction on Monday. What is important, is that the bounce is an abc 3 legger pattern. If it is a 3 legger pattern, we can short it in a big way. The following wave 3 down could be 145 points more or less. But this may be getting to far ahead of things.
Kindest regards,
John, your write-up reads as poetry.
May I add that there has been a Hindenburg Omen cluster (8 in 10 trading days). The last one occurred in the fall of 2007. There were no false signals since 2006. The key is to use data containing only new highs/lows for STOCKS, removing all ETFs first.
http://stockcharts.com/h-sc/ui?s=$NYA&p=D&yr=15&mn=6&dy=0&id=p73644625722&a=380363637&listNum=6
Demographics; Deflation; Depression: World Wide.
Great article John. The stage is set for next week. Are we going to get a repeat of 1987 with a crash commencing in Hong Kong?
I remember it clearly as I was up to my waist in it. You could couldn’t get an offer filled no matter what. That is why I have been so vocal toward those that are long at levels that are IMO way over extended.
Crashes are rare events but if you are unfortunate enough to be long when one comes along it can be punishing to your wallet as well as your mental state.
You may be right. According to Charlie Bilello, “Volatility of volatility making history. 2nd largest weekly spike on % basis: 77%, from 11.89 to 21.08.
It is time to become a bit fearful……and bulls sweat. Bears must stay calm or they get thrown off the bus by Volatility.
My scout short is finally profitable for a change….SPX 1980 is my first target which is the 50% retracement level to the Oct 16 low. Looking to $NYHL for clues to close my short.
With China planning a new normal of slow growth to join most of the world economies, 2015 should be a tough year tossing bulls from optimism to pessimism is a good re-set. If SPX goes lower than 322 SMA and can’t rebound quickly, I will close my SPX 1,450 long position and declare the death of FTFD.
So you are net long from 1450, but also short?
I short for bragging right. Trying to pick the top so I can talk about it til I die:-))….. Just like selling GE near the very top at $59.25. If this is not the top, it is OK, I will try again.
I also own STXX50 at 2,500 (based on STRATFOR/George Frieddman’s German has no choice but to bail-out assessment in Aug. 2012) and I have itchy finger on the sell button. Why? Friedman is now saying that there is a lack of commitment to reform by the Greek, French, Italian, alike….while the German do not want to commit additional bail-out money…it is a recipe for a double dip crisis in Europe. I suspect the German will brink again after a 30-40% hair cut because they can’t accept the risks and uncertainties.
The only thing I am buying these days….. ..accumulating oil stocks. I will buy the bottom by accumulation. Joe Sixpack cried in 2008 because of $150/bl oil. I am sure he will cries again!
Something to note: the short interest is really low now, a lot lower than in October and near lowest for the year. No fuel up from short squeeze…
Wonderfully worded John. You have clearly presented the bearish potentials of this market and can’t wait until Sunday evening to see if the Friday sell off continues or even accelerates. I refuse to go short though am happy in cash as
the seasonals and moon phases are positive next week.
Reblogged this on thedarklordblog and commented:
WOT NO SANTA?…Top stuff John.
Thanks John.
For the record I’m long since SPX 2018. Im looking to add on Monday. Anyone who is short next week is going against positive seasonality, fighting the Fed FOMC, and for the next few months positive returns per the presential cycle. Ofcourse it could be different this time but I doubt it is.
Whilst I agree a significant correction is due, the bears has their chance in October.
Duncan
Also the 50 day ma (a reason for Friday’s last hour sell off) and the Japanese Elections. Who knows, maybe the ECB will find a pair, declare economic emergency powers, and begin its QE, while the FED begins a mild QE4 (that will become known as the Yellen Put), and stock regulators around the world increase the leverage that stocks can be bought with.
No broad economic liquidity crunch in sight (energy sector only); thus, stocks aren’t going to crash but rally all over again?
http://finance.yahoo.com/blogs/talking-numbers/this-50-year-chart-shows-rates-are-headed-down-234401679.html
John, are you adding on to your shorts?
I’ve been waiting for you to add more….
Me and the boys are scalping the shorts. No major position yet.
Good update. Glad to see you hold off posting for awhile until we observed some downtrends. I was relocating so I missed several of your last posts in detail, but I am back. It will be interesting to see what happens.
“When Santa fails to call bears will come to Broad and Wall”
Great timing just when only a few hardcores bears left and stakes increased for an expected Santa rally.
I have to say 5 years was a good run, might get a surge Sunday Monday, but I thinks it’s now over, plenty of time to short this hyper inflated market, lots of air pockets on the way down.
no need to rush in… Patience pays off in the end.
Ps
Thank you John for sharing your work.
8 Hindenburg Omens within 10 trading days! This is how unstable the Markets are from shameless Central Bankster manipulations.
With oil prices tanking and more likely to come, I believe sentiment has turned. There might be a Santa Claus rally, but I don’t think Santa will be able to get up to the top that has been put in place.
Charles Hugh Smith whom I have seen post here sometimes did a great interview with Gordon T. Long on the “Oil Drenched Black Swan” http://www.safehaven.com/article/36055/the-oil-drenched-black-swan
When Banksters distort the Markets as much as they do, you don’t know exactly where the next Black Swan is going to come from to knock the Markets back into reality.
Another excellent comprehensive post John. Much appreciative for the big picture.
I love Charles Hugh Smith. If you don’t read him daily, you should. He’s one of the best in the unconventional thinking.
Market chart for next week based upon solunar and seasonals:
. ….. ..
. ….. . …. ……..
. …. . …….. …
………… …… .
Mon Tues Weds Thur Frid
Week to end up .5% higher than it is now.
I am in cash waiting until price stops falling, and shows technical buy signal.
My formating didn’t work. I was trying to communicate that I see continuation of sell off with bounce back late Monday afternoon, down Tuesday, spike up 2% Wednesday (equatorial crossing of moon N to S), down Thursday, and up
Friday. Choppy week with net gain of .5%.
Latest rally on the solar cycle chart once again matching up very closely with solar cycle 16. Solar Cycle 24 (w/ 1st dead 18 months trimmed) vs. Solar Cycle 16 is projecting a November 2015 grand finale spike. With various lead/lags on this analog the peak can come between Sept 2015 – Jan 2016, with the actual market itself peaking two months earlier July 2015 – Nov 2015 , that’s a big if , if the market peaks two months prior to the solar peak as in solar cycle 16.
It is my understanding that the solar cycles are not sinusoidal but saw toothed and left leaning. You seem to imply that this SC will be right leaning instead of the usual left leaning. If so, why?
Richard – every solar cycle is different, but there are twomain categories: the more common, relatively strong (measured by sunspot numbers) ones are typically 11 years max to max and exhibit a distinct spike in sunspot numbers. The less common weak cycles are closer to 14 years max to max, and exhibit several smaller spikes which form a plateau over the longer timeframe (especially obvious in the smoothed numbers).
So the weak cycles could be described as more right-leaning as you put it.
But we only have accurate sunspot measurements for 23 completed cycles; patchy sunspot observations for a few more before that; and indirect magnetic records from tree rings and ice cores before that again – out of hundreds of millions of solar cycles.
During the Maunder minimum max to max times were as long as 22 years, and it looks like we are entering another grand minimum now (though probably not as severe as the Maunder). So an SC24 max extending to around 2022 cannot be ruled out, although it is umlikely with late 2015 remaining the statistically most likely.
It has been obvious for at least three years that SC24 would be weak and long, with 2015 being the solar and speculation peak – the difficult part has been in deciding which asset class will benefit. See also some comments here from April 2012: https://solarcycles.net/2012/04/20/solar-peak-secular-asset-conclusion/#comments
Thanks, I only found out about SCs and markets this summer while doing research to increase my understanding of weather in order to be better at grain trading. I think that the higher second peak of the double top of this SC along with the recent mania by the Chinese Public to buy stocks from July onwards points to the top in the SC being later than is believed. Given that recent SC tops were double peaks with the second peak being lower than the first peak and that the double peak of the current SC had its second peak higher than the first peak must imply something different to the prior SCs. It is a clear broken, or different, pattern that implies other differences as well such as when the actual peak occurs.
Apologies to Tim Channon for linking to his chart in the April 2012 link above, while talking about M A Vukcevic’s model.
23 April 2012: “…gold is due to break upwards if it follows its 1979 historical rhyme – but if this fails the PM market could get a massive clearout, clearing the way for much higher prices over a longer timeframe than is currently expected…”
Yes, welcome back John. We thought you were bankrupt.
What a goofball comment, Kon:
The average YTD change of our 30 key country ETFs is now at -7.5%
Dubia stock market crashing again today, down another 6/7%
http://www.dfm.ae/Default.aspx
Qatar crashing as well. 7/8%
http://www.qe.com.qa/pps/qe/qe%20english%20portal/Pages/Home/
Just my basic beliefs.
Solar activity is driven by 4 planets; Jupiter,Uranus,Neptune and Saturn. The only way to predict solar activity is to analyze these planets. The Jup/Sat cycle peaks August 2015. And Neptune (the 3rd in power) heads for an opposition with Jupiter (the strongest) in September 2015. As conjunctions are the strongest positions, oppositions are the weakest. It also keeps the center of gravity within the sun. This indicates that solar activity is up into 2015.
Gravitationally , we are headed for a low on December 28. Next week will be up as of Monday, with a high on December 22 – the new moon. After that a 3rd (!) wave down into 28 (Bradley has major low on 26). Then up into January 5th.
Just one issue in my mind: Long term gravity peaks by the end of this year and has been a reliable indication from the 2009 low. All the time the Sat/Jup cycle was consistent (up). So we are entering a period where the long term forces are in conflict. This could mark the end of a an 11 or even 17 year solar cycle.
Point is, I have no freaking idea what this will do. I speculate volatility will go up in a final bull/bear struggle (wave 5 of 5?), with the fed joining forces with QE-X before the bulls give up in the summer of 2015. This is not a forecast- just wild speculation.
to understand the sunspotcycle, you need
-the synodic Jupiter-Saturn cycle of ~10 years
-the Jupiter cycle (perihelion) of ~12 years (some detail added by Mercury because of ellipitical orbit)
-the ~11 year cycle of Venus-Earth-Jupiter zyzygies
Short term you want to follow the 118CD cycle of tidal forces upon the sun, from VeEaJu, that has a bigger ~10 month variation
And the 13 month Earth-Jupiter cycle also is somewhat relevant
In the bigger picture there is also a Uranus-Neptun effect, related to grand minima.
Its all very simple 😉
forgot the essential ~42 month cycle from venus, earth, jupiter
In the bigger picture we have a ~11 year cycle (sunspot cycle) that many believe is a decennial cycle, because it has been ~10 years for a lon time (short sunspot cycles last 100 years)
There is the 22 year magnetic cycle (best seen in births, and also wages, housing)
The bigger 44 year cycle is significant for stock market
The major 88 year cycle is significant for stock market, also in fertility/births
At this time we have a top in the 10month, 13month, 42month, 11year, 22year, 44year and 88 year
Should have an effect…. on everything 🙂
finally… simplyfied a new sunspot cycle begins at every third 42 month cycle. This makes an average 10,5 year sunspot cycle. But sometimes there is a long sunspot cycle, so that the next one begins after 4 times 3,5 years. This normally occurs at Gleissberg lows and a period of weak sunspot cycles.
Latest examples of long cycles (4×3,5 years) was in ~2010, 1880 and 1815
Excellent breakdown. I’ve tried explaining this with “global warming”, but it falls on deaf ears. Sunspots and cycles work on the weather as well. According to what I’m divining from your information, this will be a turning year for weather as well, and we will have a 22 or 44 year cooling cycle, akin to the 1940-1980 era.
Scott Batten:
I have done some work on solar cycles and climate. It shows a correlation, and favors colder weather/climate for at least another 10-15 years (maybe 15-25)
However… climate should allready have been colder… so the correlation is delayed or changed… maybe.
I wonder whether this means that global warming actually is cancelling the cooling effect from the solar cycles. Time will show. I have a suspicion that global warming and solar cooling are fighting each other. Temperature will not change much, but weather “volatility” maybe changes with the two fighting forces. Maybe crazy weather… stormy, dry, some places have unexpected cooling, others get warmer. Think we allready are seeing this (?)
Interesting….14 years since 2000 is 2014…is that why you are seeing everything topping now?
14 year, how about 7 year. Cycles, I love them, I hate them. As the renowned Richard Russell said, where are they when you need them. A 4 year cycle bottom worked greatly in the 50’s, 60’s, and 70’s. Gone after 1982 low. So it is with trepidation that I mention this 7 year top cycle. It appears the market tops in the 7th years, punctuated by the top in utilities. Ie, 2014 is a 7th year. During that 12 month period, most indices top, with the utilities the last as they top in Dec of the 7th year, or jan of the 8th year. Dec/Jan appear very significant in demarking tops. Going 7 years back, 2007. 2000, 1993, 1987, 1980. 1973……… check it out. The 60 year and 30 year cycles have been excellent guides for the markets. Especially look how commodity tops have clustered around 2010, 1980, 1950, 1920, etc. Bottoms around 2000, 1970, 1940, etc. How is that Balenthiran 17.6 year cycle going?
yeah… 2000 was solar maximum, and 2014 is solar maximum. Between these maximums we have 4 x 3,5 year cycles, which is the first time in 100 years.
Further we have a 22 year cycle negative (the solar magnetic cycle). And 44 year cycle topping (last time around 1970) and 88 year cycle topping (like ~1929 and ~1835)
We have a tricky situation where someone/markets managed to trick the 44 year cycle in the 1970s. You can see this in interest rates. That it why interest rates are “fighting back” now… suggesting low rates the next ~10 years.
Also the 88 year cycle is one of deflation.
To Kent, 7 year cycles are also Biblically based. Every seventh year is supposed to be fallow. This would be the start(October) of the fallow year. Economically, it would lead to a down market, as the fields are to be left to rest every seven years.
Janbenestad,
Appreciate your remarks. Will study this.
Earlier you were expecting a low by the 19th. Is it possible 19th turns out to be a top and down into 26th/28th?
Abe is in, debt ceiling sorted………….WHOOSH……..?
😀
J
That and with the DOW on its 50 day ma and the American government spending bill was passed so that no government shutdown occurs could restore confidence and optimism to buy stocks.
ECB rapidly running out of time to begin an effective QE (and, so, will act soon)?
http://news.yahoo.com/oil-price-slump-muddies-ecbs-mission-064600285.html
If SC top is not yet in then should the ECB act, the same response by the Public to stock buying could occur as what happened, this summer, when the Chinese increased their leverage to buy stocks and the Chinese media started beating the war drums to buy stocks: a 41% rally in Chinese stocks from July onwards.
FED and ECB to, finally, start acting in concert/together as ECB eases and FED announces Yellen Put:
http://finance.yahoo.com/news/fed-considers-time-end-free-071552929.html
Collapsing Crude prices to be the excuse for acting in concert? Also to capitalize on Japanese election results?
What it really comes down to is if the SC top is not in then the authorities need to act very soon to juice up the “animal spirits” to get the markets/economies moving up from here otherwise deflation will crash the economies/markets before the SC late top comes in.
The beginning of the end of the Dod Frank law pointing towards increasing leverage and that the SC top is not yet in:
http://finance.yahoo.com/news/wall-street-wins-in–1-1-trillion-spending-bill–but-who-loses-162059497.html
GEOMAGNETIC RESEARCH:
A tutorial is available at this link.
Click to access GeomagnetismTutorial.pdf
Historical data is available at this link.
ftp://ftp.ngdc.noaa.gov/STP/GEOMAGNETIC_DATA/INDICES/KP_AP/
======================================================
The measurement in the tutorial, (along with John’s generous research) indicates that the best daily measurement for geomagnetic activity is the; Planetary A Index.
I’m having trouble deciphering from the first link; the Planetary A Index readings?
from the long row list of numbers, without column headings. For example, what would the daily reading be for January 1 and January 2, 1932?
Is it 150 and 261 respectively? Thank you for your feedback.
Breaking it down – Spiral update with positive and negative charges. https://twitter.com/mjmateer
Color coding the Spiral update https://twitter.com/mjmateer
Peggy,
Thanks so much for the videos on Primer Field that you posted in the previous blog. Important information there, thanks for the direction,
SC
If this SC’s top is going to be late then what if it’s late top brings in the Elliot Millennium Third Wave peak too? Elliot third waves are democratic. Proof of that possibility can be seen in Asia with the Japanese elections and the Chinese Public’s mania to buy stocks from July onwards. The Europeans are at the make or break point in the fight against deflation and the return of the animal spirits to help the world wide democratic mania in the Elliot Millennium Third wave blow-of-top. All that the Americans need to revive their animal spirits is another FED “put” combined with more leverage. Increasing the American stock buying leverage would be a very democratic thing to do (excuse) especially with the wide spread use of mobile devices (better informed public?)( safer stock buying public?).
On the downside, after the late SC top, could be the decline of an Elliot Grand Super Cycle A wave of the Elliot Millennium Fourth Wave to the depths of the Mini-Ice Age in 2030.
If the current SC top is not in then it could be said that America has lost the race to the economic moral high ground to the Asians. Why? Because the Chinese have recognized the advantage that mobile devices gives to it people to make better informed decisions and have increased the leverage that the Chinese People can use to better themselves with those better informed decision making abilities that those mobile devices allow.
To retake the ascent to the top of the economic moral high ground the Americans need another CB “put” combined with increasing the leverage of stock buying based on the assumption that better informed stock buying decisions are available today as never before in history due to the proliferation of mobile communication devices.
If it is correct that the current SC top has not come in then the Germans are proving once again to be on the wrong side of history at a crucial point in time by refusing to agree with the ECB beginning European QEs. The German refusal to agree with European QEs is a direct affront and disrespect of the European People’s economic decision making abilities with the recent spread of mobile communication devices throughout all of Europe and not just in Germany. This means that Germany is behind the times, once more, and out-of-step in world affairs (not “the leader” of Europe as they so often think of themselves).
european g bonds saying there will be QE. Also nascent Euro strength points the same way.
Not jumping to conclusions but a loss by Samaras on Wed would put a Greek exit on the table which would cause the Euro to rally and european G yields to rise and stocks to crater. Ideal time for the ECB to announce. Germans have banks to save too.
Japanese voter turn out at 52pct – previous 59pct. Probably a vote of no confidence by the general public in Abenomics. Sell the ‘good’ news. Expect rout in global markets to continue. 1650 to 1745 first bounce zone (ES).
trading with central banks can be counterintuitive. If you look at the last couple of years it paid off to sell government bonds when the CB announced QE. Also it paid to buy the FX at the same time. Bond market is discounting QE ahead of time while the cash market (fx) is going up during QE. I would classify the Fed on one side and ECB/jcb on the other. While treasuries are on their way discounting the next round of QE the cash market ($) has not gotten the message yet and in fact behaves as if QE never stopped. On the other side Euuropean and J bonds are signalling QE is imminent which should lead to weak g bond prices and a rising fx over the next 1-2 years (j already announced QE). Where does this leave stocks? More difficult to call than bonds and fx but rising G bond yields in Europe are unhelpful for banks which are holding most of these bonds. Japan would be the same where banks are the biggest holder of bonds. The FX rising in both will be negative for their exports. Hence for world equity markets the latter environment is less helpful then a rising $. Euro and Yen as cash, fx hedged Treasury bonds and short US stocks (benefit from lower equity and FX) would be my preferred positioning.
Abe same results than 2 years ago but on 7pct less voters.
The Chinese stock market is going stellar. And why shouldn’t it. By the time that the depths of the coming Mini-Ice Age of 2030 is here the entire Russian exports of energy will be to Asia: China, Turkey, and possible Japan. By 2030 Europe will get no Russian energy supplies like they do now. By 2030 the Europeans will become the environmental dirty energy polluters of the world because they will have no clean natural gas to burn but must rely on burning enormous amounts of their own dirty coal to run their industries and heat their buildings in the depths of the coming Mini-Ice Age.
The Europeans need to not only start QEs but to stop their arrogance in trying to control Russian internal energy production and do some serious Russian butt kissing and apologizing over recent stupid stances towards Russian energy trade.
The Russians seem to be the People who are acting the best towards their interest and the coming Mini-Ice Age. This means securing food supplies and energy export policies. The Germans seem to be the stupidest at understanding the Russians and the coming Mini-Ice Age and what stance the Germans should have towards Russia and Russia’s foreign policies and Russia’s foreign trade priorities. The Germans are cutting their throats concerning European QE –and– concerning Russian natural gas supplies for the coming Mini-Ice Age.
Bounce/bottom in energy and stocks on Monday:
http://finance.yahoo.com/video/opec-39-badri-says-oil-091158803.html
China private debts have grown 3X+ since 2008 to 2014. To continue to fuel a 7% GDP grow plan, more debts are needed. More excess capacities while more of its customers are in negative growth.
China market (say the A shares) gone gaga since Nov. due to the retail gamblers who used to bet on Macau casinos. One can short the China market (FXP or YXI) while no one is paying attention.
Solar energy will be reducing the need for fossil fuel significantly by 2030. In addition, Lockheed Martin claims they will be building nuclear energy (fusion) plants by then.
Solar energy works great half the time. Regardless of how good it is, when it’s cloudy or night, it fails. There will still be a need for secondary(I still think it will be primary) power and especially heat. After Fukushima, a lot of countries are steering clear of nuke, either type. Needs may change that, but not quickly.
Hurrah, someone that understands that the sun has a lot to do with the weather! I couldn’t agree more. The only question is can Russia stave off fiscal troubles long enough, or will they have to “stir up” trouble to get oil and gas prices up on a scare.
Richard I:
You seem quite convinced of a coming Mini-Ice Age. For the record, I’m anticipating a Dalton Minimum.
Could you site the sources which helped you make your conclusion.
Russia’s play on the Ukraine (their historical “bread basket”) may be part of a longer range plan.
From what I have gathered from Russian scientific papers, they’re also quite convinced of a coming ice age.
Thank you.
Just look at the history of temperature swings. Last big warm up was the 1930’s, then it went cold 40’s-80’s, followed by global warming 90’s til now, likely flip with the new solar quiet time.
My further research into the weather lead me to this site. Many of the posters here already know about the coming Mini-Ice Age and know more about it than me. What I discovered is that when the solar system’s barycenter does a complete circle rotation inside the Sun –and– this happens before the top of a Solar Cycle that a Mini-Ice Age follows.
As far as governments go the Russians are the most advanced in this knowledge and its use. Obama seems to know absolutely nothing about history outside the US and it is questionable how much he knows inside the US. The Russians are acting for their interests and try to do their best in keeping their smiles from turning into out of control laughter as they handle Obama at international events.
$/Y down in early trading – expect pennant to break around 118.32 – target 114. The whole move in the Yen post the QE announcement was likely a fake out as per my analysis above (FX usually rises during QE). The majority of traders are positioned wrongly which will make for a strong short covering rally.
FX breaking the pennant. Not a sign that equities won’t resume their plunge.
that’s what i see, hope there is no whipsaw here as there is quite a bit of $/Y catching up as it went no where in last Friday’s big down day.
too many people positioned short here. Having a stable Government should be good for FX.
are we going to hit 117.40 today? if we close there or lower the daily candlestick show a pretty bearish patter (i.e. continuation pattenr for the last 4 trading days). it has been a pretty active day and mrs watanabe is probably not awake yet.
still in the pennant (118.75-45) very narrow. Would expect London/NY to make the decisive move lower.
looks like Yen broke pennant finally
Glad to have you back John. We are setting up for something special in 2015, but in the meantime we may get a bounce, as we get into oversold condition with NYMO < -60. I covered 75% of SPX shorts on Friday's close, and if we do get a gap down, will cover the rest:
https://davinny.wordpress.com/2014/12/14/12142014-weekend-update-calling-for-santa/
good news for bears is that TRIN has been low during last 2 days of selloff (no capitulation/panic) and VIX has yet to fill the gap up at 24%, I expect that to happen this week which means there should be a lower low in stocks
dv, yours is one of the few sensible posts here….most of the rest are just the lemmings drooling over each other!
John, wake up….u have been absolutely wrong since Sept in calling for a crash….3 months now! how the hell r u even solvent with your short positions at this point?
new all time highs coming!
ES futures gapping up 15pts, this is exactly why it’s tough to hold on to large position in shorts. to remain in the game, have learned to keep taking profits, reloading, and play both sides to keep compounding on cash. lets see if this short squeeze holds, could be a pump and dump. for the rest of my 25% SPX short gonna simply put a short above 2050 for a breakeven. .
hOW? 3X short ERF’s; trade the patterns using Ta, EW, This and other sites; HEDGE
Per Gann, 2015 will be bipolar. 5 is the year of ascension, and there has only been one 5 down year. It is also a year of panic. Bradley is up first half down second half. There are two Puetz crash setups – the solar eclipse is before the lunar eclipse.
Thanks everyone, great input
Definately agreed- very interesting comments during the last couple of days. Your site has been a brilliant source of new approaches and ground-breaking research over the last few years – both in your posts, and in the comments.
But during the last several months that has been spoiled somewhat by the sheer number of often meaningless comments, many of which are irrelevant to your work, or even deliberately disruptive. This makes it difficult to find the more informative comments, and I’m sure it sometimes.puts off those who have something meaningfull to say.
I know you want everyone to have their say, so would it be worth restricting the number of comments to say three per person per day (if it’s possible)? Hopefully everyone would think more carefully before commenting.
Agree, Mark. Too many meaningless comment,s not to mention those that are deliberately antagonistic, adding nothing of value.
In regard to Puetz Window many are false signals because they do NOT meet the full criteria for a positive signal.
There was only one person I ever trusted to give a correct Puetz Window signal and that was Albertarocks
Sorry I got completely sidetracked then. I was watching watching a news update of the terrorist seige in Sydney whilst typing.
I meant to say Hindenburg Omen not Puetz window
How many rare V bottoms must there be to new ATHs for the obvious to be understood that the SC top has not come in and won’t until late next year? Sunday, DOW futures fell slightly to test its 50 day ma and have been rallying ever since. Even though I correctly called a rare Full Moon top in stocks I was also calling for a four week decline to the next Full Moon as the bottom. It now looks like that all that Crude has to do is not necessarily bottom, though it may have, but to slow its descent, should it not bottom until January’s Full Moon, while stocks are going to bottom and rally right back up to the New Moon. In other words, it is BTFD all over again as the SC top has not come in.
Eurozone inflation expectations fall to a record low. This article and its three charts matter if the SC top is not in but comes in next year. Why? Because the charts mean that the ECB will begin a QE and that CB act will only be favorable responded to by the market IF the SC top is not yet in.
http://www.ft.com/intl/fastft/251061
If the market is forward looking then these charts and expected ECB action points towards a V market low in the DOW, on its 50 day ma, and a rally up to new ATHs.
RI
“How many rare V bottoms must there be to new ATH”
Getting a bit ahead yourself mate. Let’s wait and see how this looks into the day. Both the DOW and SPX bouncing on the 50. I would not be shocked to see it sold off as the day extends or bearish flag develop.
Different CBs have different indicators that are used as the basis for their policies. For the ECB one of those indicators is the 5y5y. Last Friday the difference between that indictor and a German 5 year note when negative for the first time ever. That means that Deflation is becoming entrenched in the Eurozone. So the question is whether or not CBs who say they will fight Deflation really, truly mean it or are only blowing smoke up our rear ends. Recent history of Deflation in Japan and Italy seem to me that the CBs really do mean it about fighting Deflation. That being the case then last Friday’s fall to a negative in that difference in Europe indicators points strongly that the ECB will ignore the overly idealistic Germans and begin its QE. The QEs in America have resulted in bull markets in US stocks. Should the same happen in Europe than it could spread to a continuing bull market in US Stocks too.
A bottom in Crude may have come in for two reasons: the above in addition to statements this past Sunday by OPEC officials. If that has happened then it points to BTFD for US energy stocks and the entire market. I don’t usually try to call turns to a specific day. I prefer to look at weekly and month time bars. But given the closeness of the DOW to its popular 50 day ma along with the above (and the SC top not being in yet) points to the possibility of the turn back up being called within a day or two.
Today’s daily sunspot number is back up to 175, near the upper end of its range for SC24 so far.
There has been relatively high geomagnetic disturbance very recently, and while this disturbance is primarily associated with sunspot groups that is a definate indication that SC24 max is not declining yet.
The “aa” geomagnetic index has two components: aa(r) is the relative sunspot number component, which is proportional to and in phase with the sunspot cycle because it is caused by short lived solar events such as sunspots. The second component aa(i) is the interplanetary component, which is out of phase and peaks between two months and two years after the sunspot peak because it is caused by long lived features such as coronal holes.
So when we eventually see geomagnetic disturbances occuring without corresponding increases in sunspots, then we will know for sure that SC24 max is waning.
Geomagnetism peaks are closely correlated with VEJ alignment – see John’s post and some comments here: https://solarcycles.net/2012/02/23/solar-cycles-and-astro-trading/
VEJ alignment indicates a SC24 geomagnetism peak around 2015 (possibly as far as mid 2016). That peak is very likely to occur within two months of the sunspot peak (during even-numbered solar cycles the particular polarity of the sun interacts with the interplanetary magnetic field so that sunspot and geomagnetism peaks are close together; during odd-numbered cycles the gap is closer to two years).
Also, there is a fairly reliable 87 year geomagnetic/solar wind cycle [Joan Feynman 1982]. 1929 (ie. even numbered SC16) + 87 = 2016.
Understood: Sun Spot counts are old technology.
All this is new to me. I just did some research on Venus and Jupiter and it shows that neither are tilted on their spins like the Earth is. Also, both have magnetic north and south poles. Are you saying that all three planet’s magnetic North Poles are aligned and when the Sun’s magnetic North Pole is also aligned that they reinforce each other in power and accuracy in how they effect Optimism and Pessimism of humans on Earth?
VEJ alignment is just the relative positions of the three planets in their orbits around the sun, so when they line up in conjunction on one side of the sun that is when they have their maximum effect on the tides in the sun’s plasma. Tidal force is created by the difference in gravity (due to the planets) between two different locations on the sun, so it decreases in proportion to the cube of the distance (between planet and sun).
So the inner rocky planets create shorter term tidal cycles in the sun’s plasma; and the outer gas giants create longer term gravitational cycles on the position of the sun (by pulling and pushing the sun around the solar system centre of gravity – the barycentre SSB).
Plenty of reading material here: http://tallbloke.wordpress.com/prp-special-issue/
But bear in mind that some established solar scientists still laugh at the idea of a cyclical connection between the planets and solar activity.
Mark, is it fair to say (or am I stating the obvious) that you have disagreed for many months with John’s interpretation of the solar cycle? For a layperson, it is difficult to know who to believe, as John states quite emphatically he believes the cycle has peaked. Is this a coin toss then or is there a simple measure (or two) where the two of you diverge and the layperson can track? And when would we be able to say with assurance that one of you is wrong?
This is truly a central issue for this board – thanks.
Yes Gary, our views on SC24 have diverged, probably from around three years ago. My approach has been to look at as many solar cycles as possible, and as much research as possible. John has chosen to follow the predictions of the self-professed “blue ribband” solar experts. But their predictions have always been wrong: http://astronomynorth.com/2013/01/did-you-see-that-peak-of-solar-cycle-24-changed-again/
Anyone who has relied on these predictions has been left with a critical gamble on their hands. Nobody can tell with certainty what the sun will do next, or what the markets will do next – so it is not a question of “who to believe”.
For a long time my view has been that SC24 solar-induced speculation will most likely end sometime between November 2014 and late 2016 (or even slghtly longer), with Q3 2015 the most likely time. Now that SP500 has reached a natural high 666-997-1200-1367-1533-1736-2065, just as SC24 is reaching a critical stage, we could soon see some violent moves.
As for a simple measure the “layperson” can track – well, I studied physics through university but have never worked as a physicist, so I am a layperson too. So the only option I think, is to keep looking as widely as possible with an open mind…
The N hemisphere is rising magnetically. As new data comes in the following weeks we shall know if the flip is accelerating or stagnating. http://wso.stanford.edu/Polar.html
Yes, I expect the top to be 5M after the last flip. This time we have flip-flip-flip. How confusing! But this places the window of the top from Q4 2014 to Q1 2015 — so I have to agree to disagree with Mark.
I am just a beginner with the sun though, and I can’t find fault with what Mark is saying. But as a layman, is NASA/NOAA etc so wrong in their predictions?
http://solarscience.msfc.nasa.gov/predict.shtml
It seems that we have to pick which scientist to follow!
Sorry, I mean “WITHIN 5M” of the magnetic flip, which means we could already have topped, or we could make a high early 2015.
WT – I agree that this northern flip could be very important. The sun’s overall dipole flipped during early March 2013. Then the southern field flipped late July 2013 (in a stop-start sort of way which is now not obvious due to the smoothed figures). But look what happened to sunspot numbers in the southern hemisphere shortly after its field flipped (green line here): http://www.solen.info/solar/images/cycle24.png
I mentioned previously that I think northern sunspot numbers will increase temporarily once the northern field starts to gather some tentative strength – that could start soon, if it hasn’t already.
Also, NH sunspot group 2236 is at a very high latitude – not where we’d expect one to be during the late stages of a solar maximum.
Thanks for your post; very helpful.
Above was to Mark.
Worth a read:
http://biiwii.com/wordpress/2014/12/12/pivotal-events-33/
PTB should have let it fall naturally at the open
and try for a rebound later
now, LOB
continuation of Friday’s downward dynamic. Russian ruble introduces systemic risk. Market tries to find out how much excess leverage was built up in the global energy complex (including Russia). Interesting times ahead. 1998 comes to mind.
adding shorts Friday was the right thing to do in spite of what “Little Fish” regurged…lol
Might get a short term bottom trade just before New Years. That bounce will probably set up the divergences in the AD lines for THE END.
charts one at a time soon
Just covered a little more TZA…. Now at 102% short in trading accounts….
My trading system is still at 100% short, but I’m working on building some cash if we get some type of EOY seasonal rally…
GL
http://stockcharts.com/h-sc/ui?s=$NYA&p=W&yr=2&mn=0&dy=0&id=p98743992394&a=370927705&r=1418660396375&cmd=print
pretty much a bear market confirmation
http://stockcharts.com/h-sc/ui?s=$NYA200R&p=W&yr=1&mn=0&dy=0&id=p12588896993&a=372389259&r=1418660485048&cmd=print
for followers of MA he is looking for a weekly close below 17235 to turn bearish
http://stockcharts.com/h-sc/ui?s=$SPX&p=D&st=2014-03-01&en=today&id=p47570277193&a=372609499&r=1418661007269&cmd=print
The high yield sector is terrible. The FED should begin to buy the high yield sector now, before it gets out of hand.
easy peasy! ROFLMnakedAO
http://stockcharts.com/h-sc/ui?s=HYG:TLT&p=D&st=2014-03-18&en=2014-12-15&id=p03210192255&a=370629538&r=1418661868352&cmd=print
http://stockcharts.com/h-sc/ui?s=$GDOW&p=D&st=2013-07-11&en=today&id=p13533684020&a=374801865&r=1418661111758&cmd=print
clearly a wave three in progress ? if so then min target is 1780 on SPX before year end
accelerating like a wave 3 ought to.
the mid and small caps are interesting because they had an amazing run but a poised for complete collapse.
http://stockcharts.com/h-sc/ui?s=$MID&p=D&st=2014-05-19&en=today&id=t13144089111&a=374805050&r=1418661595273&cmd=print
wow, the smiles keep coming
can Big Tunas drown?
the weekly negative wick in Biotech last week seems like it was significant. Last time this happened was at the bottom in April this year (positive wick). 11 weeks up followed.
http://www.marketwatch.com/investing/index/nbi/charts?symb=NBI&countrycode=US&time=8&startdate=1%2F4%2F1999&enddate=12%2F15%2F2014&freq=2&compidx=none&compind=none&comptemptext=Enter+Symbol%28s%29&comp=none&uf=7168&ma=1&maval=50&lf=1&lf2=4&lf3=0&type=2&size=2&style=1013
i see BBE and i have the same sense of humor
I think gold is about to commence very strong advance in days if not hours. Sentiment is still awful for gold
BUY ABE, BUY!
Fibonaccis in the 177.8-117.90 area – once cleared towards 115.5 and first very solid support 111.5
Strong reversal at 38.2% retrace in SPX. If this is really wave 3 then it should be short lived.
how a 3 becomes a C – ABE BUYS!
Nicolas, seriously, waiting for CB’s to “save” the market is a terrible strategy….
They don’t know you, they don’t care about you, and helping you make money is the LAST thing they care about….
Don’t be Mortimer Duke, okay?
“Get those brokers back in here! Turn those machines back on!”
“Turn the machines back on-nnnnnnn!!”
BUY ABE, BUY!
lol. a lot. at the comments directed to “Nicolas”.
😀
J
And J, I’ll bet you “one dollar” that N has no idea what I’m talking about…. 😉
We should get a dead cat bounce, maybe even today maybe until FOMC. Markets don’t move up and down in straight lines (except for that oct 15th to dec 5th blow off rally…lol).
damn ABE is a good customer
Swing Trend Indicator still on full sell, but some indicators saying bears should begin to be cautious…
there is real support at this level but consider that the DOW was up over 100 pts and reversed and now struggling – this type of volatility is not bullish
http://stockcharts.com/h-sc/ui?s=$INDU&p=120&st=2014-07-10&en=today&id=t59436960284&a=368958338&r=1418665264769&cmd=print
It was also down 180 pts from Friday’s close, now almost flat. I would say that’s pretty strong.
well that might be true if downtrend signals like the elder 65ema system hadnt triggered or if $NAHL:$NATOT was frimly bearish
what we saw this morning off the bottom was a bounce to the Keltner mid-channel at around 2016. I said back in October that this sort of configuration heads down to the lower channel and it did. more than likely this time as well only with the other evidence mounting this pullback is going to accelerate. May not but the indicators will have to flip. The VO will have to establish a rising bottoms pattern – it has certainly fallen enough to do so but “I aint heard no fat lady”!
http://stockcharts.com/h-sc/ui?s=$NYUD&p=D&st=2014-06-23&en=today&id=t48211526076&a=367854604&r=1418665769479&cmd=print
AAPL hit a 50% retracement (measured from Oct 15 low to its 52-week high) in low $107’s and it coincides with important support levels along with the bottom of its 2-week downtrend channel. This would be a nice entry to go long for a flip later this week IMHO.
OK, HYG almost green now. I think central banks are starting to buy now. They will not let the high yield sector crash.
all hail ABE! oops! down we go again.
BUY ABE BUY!
this is a good ST chart to see if the bounces are going to roll or not
http://stockcharts.com/c-sc/sc?s=$SPX&p=10&b=6&g=0&i=p39408150539&a=191691104&r=1389629697844
Link doesn’t work. I’m watching settings on SPX:VIX, VIX:VXV and NYHLR telling us bears to be cautious.
Got it to work copy/pasting. Thanks!
One of the biggest reasons I have a hard time being more bearish is that there are just too many bears. This site is proving to be a valuable contrary indicator – it two weeks of everyone bragging about BTFD to just get a 5% decline.
On a more serious note, I started watching the 125 dma on the SPX after I saw that money.cnn.com uses it in their fear-and-greed index (now extreme fear). It has stopped every decline for the past two years except last Oct and guess where we bounced today?
http://stockcharts.com/h-sc/ui?s=$SPX&p=D&yr=2&mn=0&dy=0&id=p00716401603
Thanks Arthurk
too many bears??? WHERE??????
http://stockcharts.com/h-sc/ui?s=!CFLRYRAMM&p=W&yr=10&mn=0&dy=0&id=t91809992883&r=1418668407356&cmd=print
I agree. Talk is cheap. positioning is all that matters.
Retail money indicator. How about following $/y or serious money flows.
look at ever bear indicator from the stockcharts link – bears are extremely ABSENT
http://stockcharts.com/search/?q=bull%20bear§ion=symbol&start=0&showtasc=true&showstore=true&showmm=true&showpcl=true&showscan=false&showvideos=true&author=&blog=&startdate=&enddate=
no bears here – almost the lowest ever recorded!
http://stockcharts.com/h-sc/ui?s=!ASETBEARI&p=W&yr=16&mn=0&dy=0&id=t31643782611&r=1418668787413&cmd=print
KISS – lowest AAII bear readings ever
http://stockcharts.com/h-sc/ui?s=$SPX&p=W&st=1988-02-29&en=2014-11-18&id=p48074593153&a=380613058&r=1418669371615&cmd=print
John Hampsons,
Short Interest like the major stocks lows. Best measure for short covering.
https://solarcycles.net/2014/11/19/bear-market-bottom/
following 2 s-t patterns in $/Y both targeting 113.65 or +4% below current levels (pennant, declining triangle). Not conducive to an ES bounce in my view.
very orderly sell off – no whiff of panic yet.
Friday was orderly? besides there doesnt have to be panic or bears just no bids.
Frankly I can not believe the willingness of some to stick their hands out to catch a falling knife.
Look at Europe and watch how Asia reacts today and if the US can’t regain the 50 day promptly then this has the potential to worsen rapidly Fed or no Fed.
Allan, the Swing Trend Indicator takes time to turn, so I need to look at other ways of catching the turn when I’m short. Since tops are more drawn out, it picks tops quite well. All I’m saying is that some indicators are pointing toward caution for bears now. I’m still short.
Here’s a link to the charts I’m referencing
http://unbiasedswingtrades.blogspot.com/2014/12/couple-of-charts-flashing-caution-to.html
I hear ya, Allan….
I’m at 102% net short, and I’m STILL going back and forth on whether taking some shorts off was right or wrong…
I’m looking for a bounce, based on some very ST things, as well as the seasonal that everybody keeps yakking about, but believe me, I’m not feeling good about it at all…
Seems like I’m picking up (trying to save) a few nickels in front of what may very well be the biggest road-grader we’ve ever seen….
What is your maximum net short? Seems like 102% is quite a bit.
I was 173% short from higher up….
Went to 134% Friday, and now down to 102%…. Building some cash…
It’s only quite a bit if we zoom to new highs….
If we fall from here…..not so much…
Thanks — makes sense. FOMC coming up so it will whipsaw.
this one gives bulls a little wiggle room but really it’s just saying that some people are bears and others are scared (never leaving cash again! lol)
oops – chart
http://stockcharts.com/h-sc/ui?s=!CCFBEARM:$SPX&p=W&st=1998-03-31&en=today&id=p59977518377&a=380614101&r=1418669858200&cmd=print
Bulls must quickly push SPX down through intraday low because otherwise Santa may have arrived at 38.2% retrace…. (just joking)
SMASH SANTA I SAY! WCCG CAN HELP!
IMO high probability of bullish reversal within 24 hours due to:
1. Seasonals kicking in
2. Moon crossing equator today(usually + event, with higher vol)
3. Lunar edge in phase
4. Apogee effect waning from last Friday
Going long at close today.
but can you Tune a Fish?
Elvis, learn from Big Tuna. He has wisdom and insights that will lead you on the way to immense benefits.
SANTA SAVE US!!!! 🙂
“The scream” sells for RECORD $120mil at Sotheby’s http://www.bloomberg.com/image/iPUXb8ZgthPs.jpg
Speculation is well and alive!
that was a couple of months ago?
I’m still screaming!
It isn’t speculation at all. This isn’t just one painting we’re talking about here. Fine art prices, as a group, have been exploding for some time now.
The massive inflation that’s being produced by the central banks of the world is being very creatively hidden and kept out of certain sectors of the economy, but it always finds its way into others. Collectibles are a great example.
It is exactly speculation. Yes vintage rolex, porsche 911’s, premium wines from france, art. Its all speculation at its best.
Inflation has to do with the velocity of money in the general system, you, me, avg. joe buying groceries, cars, homes, not a bunch of billionaires bidding up some paintings that look like 3 year old drew them. i wont feel sorry for them when they have to sell them at 50% discount!
here is your inflation: http://research.stlouisfed.org/fred2/series/M2V/
and
it
sucks!
Shinzō Abe is no santa. I knew santa and Shinzo is not that guy.
http://stockcharts.com/h-sc/ui?s=IWM&p=D&st=2014-03-01&en=2014-12-15&id=p40916840118&a=372769889&r=1418673297045&cmd=print
IWM, NYA, SPX,NID and DOW are all in confirmed downtrends
$WLSH too
http://stockcharts.com/h-sc/ui?s=$WLSH&p=D&st=2014-03-01&en=today&id=t65964348523&r=1418673517241&cmd=print
Sell everything you can day.
god knows what madness will occur tomorrow.
If your are under the age of 6 years, then Santa does exist.
If not then bulls look pretty fooked.
Once again 1000 euros proves to be too much for gold. Breakout second half of 2015 will indicate next crisis is on the way or that meltup is on the way..
http://stockcharts.com/h-sc/ui?s=$GOLD:$EURUSD&p=D&yr=1&mn=0&dy=0&id=p22993123412
close my shorts and bonds
I think tomorrow is red but my ST cycles indicate a small possibility of a day or towards 2000ish
problem is this could let go like colon cleanse anytime…! but I am happy with what I made even missing the buy signal OCT 27
BBE, excellent decision to get long this market. For once, you will make some money. This is just another trap to fool the bears. This market will be back to all time high in no time.
The bears and the bulls act exactly alike.
While the market is going up the bulls cheer BTFD, central banks are buying, every country is easing, etc. etc.
White the market is going down the bears cheer, THIS IS THE TOP, P3, everything is imploding.
Meanwhile, we swing traders watch our account values grow no matter which direction the market is headed.
The short term trend, based solely on price, is down until 2018.69 is broken above. If we break below the low at 1982.26 before breaking above 2001.24, the swing trend buy stop will move down to 2001.24.
oh dear, it has become the Banned by Elvis ‘look at me’ show again
Did anyone think about SANTA / SATAN play of words?
Who is this guy anyway? 🙂
http://www.investing.com/indices/msci-russia-10-40-usd-advanced-chart
Russian stocks in USD trading below March 09.
the $/Y is sure taking its time to break 117.40 level. if it does, do you see a s/h/s pattern, with the shoulders in nov 19 and dec 11? around a 4 yen drop if we break the neck line? the daily candle stick do show a possible continuation thou (see last 4 days).
That is what I see – looking good so far
Counting squiggles see the yen in 3/3/3 down s-t target 116.6
I must say the watanabes are doing a great job holding up the $:y considering the nikkei is down 2%.
If you look the weekly chart of the nikkei, going back about a year and a half, you will see a large wedge and an overthrow the last few weeks and based on today’s down move we are back in the wedge, will it break support? If we have a head/shoulders with the $/y, we may break support on that wedge.
See the same bearish overthrow – with Russia in play I like the 1998 analog which saw the Yen up 22pct in 3 months.
In 1998 the ruble went from 7 to 21. Current move could be from 30 to 90. At 72 looks like there is still wiggle room. More instability for markets possible in my view.
John, your call was a good one! Everything is selling in US and globally. The uniformity of the action is worrying. Some charts: http://goo.gl/e2HJBx
covered all SPX shorts today. we may chop or bounce. but is the big opportunity in gold? setting up a perfect inverse H&S to me
https://davinny.wordpress.com/2014/12/16/20141215-vix-gap-fill-complete/
or just a bear flag:)
Elvis can u please put up the live link to your RENKO CHART TYVM
Of course this is what it is. A breakdown not a breakout and thus signalling lower prices. Negative divergence is once again……negative divergence.
http://stockcharts.com/h-sc/ui?s=$RUT&p=D&b=5&g=0&id=p76275927450
The long term Footsie chart is without doubt the worst of a worsening bunch by far.
If it takes out October then it could freefall:
http://stockcharts.com/h-sc/ui?s=$FTSE&p=W&b=5&g=0&id=p50538107277
the gdow ain’t so pretty either, i believe post second chance already.
http://stockcharts.com/h-sc/ui?s=%24GDOW
Investors still looking for a Xmas rally and pinning hopes on Fed speak, which in case people haven’t noticed hasn’t had much bang lately. The final moves were based on BoJ,PBOC and ECB expectation not Fed speak, so I doubt that they will have anything to add now either.
On another subject how is it Chinese factory output is crumbling and yet US factory output was hitting new highs in November…..to wit I say BULL#*%T!
What I see when I look at indices across the globe is a 1000 tonne freight train hurtling toward us.
Black Tuesday for Russian rouble and RTS index. Is that another canary in the coalmine ? Oil crashed, copper also looks very fragile and chart is similar to oil before its collapse.
Damn., no volitility this morning….much? DAX 100 pts down to 100 up and now even.
US futures from significantly positive to down in less than an hr.
$/Y forming clean waves. Wave 3 lower underway waiting for 5/3 to commence. Until complete there is very little to argue for equity markets to stabilize air go up in my view.
also of note is the now confirmed double top in Eur/Yen. This should have an impact on financials as contagion from Energy/Russia becomes a factor to consider.
Hi folks,
Firstly many congrats to those who
stayed short and benefited from this
down move, that takes both extreme courage
and conviction to have stayed the course.
When I posted that the only real hope for
a significant sell off(right now) was for a rapid
decline in crude which may lead to a
questioning of the global growth outlook,
there is no way that I would have predicted
the % declines in crude or the rapidity.
So are these the first moves in the beginnings of
a new equity bear market?, or just another corrective
move – my view remains that equities are more likely
to peak nearer to the top of the US earnings cycle,
so corporate updates and earnings guidance are
particularly important now.
I always admit to an incorrect call and
my view was for a 2-4% pullback(and even that I
began to doubt) before a strong rise to year end.
Volatility is back, that appears clear.
PTB misplayed it yesterday trying a rally at the start
they are pretty good at turnaround tuesdays though
not much happening with gold, you would think this is the environment where it will shine.
If 08 or 98 is the blue print for this current market move then would expect commodities to be drawn into delevearging despite prices being low. I think the point about possible forced gold selling out of Russia has some negative impact makes sense. For commodities to rally first need a considerable rally in T bonds which also means some panic low in stocks. Cannot see that here.
extreme intraday volatility in gold today.
I am losing my patience for gold. Triple digit scenario may come into play again
Okay, just covered some SPXU, and now down to 55% net short…
Looking for a bounce to re-add shorts from higher levels, but not strongly confident that we’ll get much of one…
Should have added, my trading system is still 100% short, and although it has come off of it’s STRONGLY bearish readings, it’s still very negative….
Personally, only looking for a short-term bounce here, and crossing fingers I’ll get to re-short at higher levels…
Pretty sure I’m done covering shorts in trading accounts, and hopefully will LOSE a little bit of money now, as the market turns higher very soon….
NOT going long…. No way that’s happening right now….
So, com’on Nicolas… Call your buddies at the Fed, and get them buying up all those spoo’s and HY bonds!! You go, boiiiiiiiii!!!! 🙂
Nasdaq in the Fib Support Zone – Count looks corrective
http://unbiasedswingtrades.blogspot.com/2014/12/ndx-definitely-looks-corrective.html
$/y daily first up trend line break at 116.6 and biotech at first daily horizontal support zone around 3100.
geno, spx hit your long reversal price this morning. how do you calculated those stop/reversal prices, or is it a proprietary method?
thanks!
How does the rouble crash fit into the solar cycles, if at all?
Looks like another BTFD opportunities today… just not guts to pull the trigger…
a rebound that starts at 9:30 won’t have the same impact as one that starts at 1:30 or 3:30
Wow – tlt and rates.
charts to follow one at a time.
should have kept the bonds but I have MF cycles on those that show a ST top is coming and a small bounce in rates. May not happen though.
Yesterdays trade:
all Money Mrkt
and for those doubters like Little Fish who think missing that buy signal on Oct 27th actually meant much here is my quarterly results so far. Over 5% in 3 months booked and kept – I’ll take 20% per year with no participation in the downside any day rather than listen to these endless Bulltards and their easy peasy FED crap!
renko for Paul
http://stockcharts.com/c-sc/sc?s=$SPX&p=10&b=6&g=0&i=p39408150539&a=191691104&r=1389629697844
tyvm
i wanted a live link so i can put in the parameters im stuck
I just tried to post my trades yesterday and my quarterly returns and they disappeared off wordpress! lol Then tried to repost and wordpress said it was a duplicate comment.
oh and there it is! roflmao! 20% annualized with no downside…and no Tuned Fishes
wave 4 $/Y 38% of wave 3
looking for an extended 5th into 113.3-113.5 area for a first market washout.
Looks like we are parked right around the head & shoulders neck line, back test or more upside?
would see a backtest complete – triangle, pennant and EW all point to 113.7 now
Another reason why the top in stocks is not yet in:
http://247wallst.com/investing/2014/12/16/2-more-djia-stocks-deliver-dividend-hikes-much-larger-than-expected/
SPX retraces exactly 38.2% of wave down from the top
$NYADV–rallies from a low of 449 to 2,172..good enough for me to cover my shorts.
Chairman Mao war tactic in winning the middle kingdom—one must retreat when the enemy advance.
Oil stock–it is painful when it is painful enough. Changes to come?
No stops shall go untouched in this market, that’s for sure….. Whew!
But come on, Nicolas…. Need your help, buddy…. Get ’em buying!!
“Need more, Scotty…. Gimme more….”
“I’m giving it all she’s got, Cap’n…”
“Lookin’ goooood, Billy Ray..”
“Feelin’ good, Louis….”
ALLAN, u did it again, u r a superb contrary indicator, as soon as u bring out a bearish chart we get a big rally
$/Y patterns aligning for wave 5 down towards 113.7 (retest of triangle break-out complete). Swing high not breached in ES as per Geno?
Has Bradley inverted?
Late Oct, while everyone was predicting a crash in Nov, I said that we were more likely to rally into Thanksgiving to approx SPX 2070 trendline top. At that point we would likely invert the Bradley turn dates which called for a bottom Nov 20 and a rally into mid 2015.
The current decline supports an inversion. If so we should rally into EOY then fall sharply through April 2015. Given seasonality and Pres cycle, rally top could be 78% retracement (SPX 2050+). Decline could be retest (+/-) Oct lows.
http://bradleysiderograph.com/donald-bradley-siderograph-2015/
this should be another opportunity for the machines to scalp the bulltards
this is just the VERY ST bounce that will end more quickly than usual
http://stockcharts.com/h-sc/ui?s=$NAHL:$NATOT&p=D&st=2014-07-14&en=today&id=t33720192839&a=377038763&r=1418748846734&cmd=print
http://stockcharts.com/h-sc/ui?s=$SPX&p=D&b=5&g=0&id=p87549359373&a=380750115&r=1418749605753&cmd=print
2016 is the midchannel and it is good resistance for now
Gold consolidated in huge triangle between July 2013 and July 2014 – one whole year. Move down from the triangle was from 1344 to 1132 – 212 points.
Last rally was exactly 106 points from 1132 to 1238, 50% retrace.
If last move was just correction then gold may be still in the bear market and should decline violently now together with other commodities and stocks.
Last rally was too much choppy for new bull in gold, I am now in bear camp for gold.
BT and BF are the same fishy?
how can you keep track of that stuff?
i’m too busy watching this play out
these intraday moves are amazing oil, gold, stocks, etc
will anybody have anything worth any value when this is all over?
focus on two or three simple methods – I’ve posted the Joseph Stowell method. # bar net line using elder charts and the 13 and 65 ema
simple stuff that works. BUT YOU HAVE TO ACTUALLY USE IT! lol
http://www.docin.com/p-273918909.html
page 23 of the link
Tis a lie, Sir.
Tis no lie, just conjecture and your response is more evidence…lol!
What is your address? Tuna and I could show up to prove our separateness.
these reversals are going to gather mass
http://stockcharts.com/h-sc/ui?s=TLT&p=D&yr=1&mn=0&dy=0&id=p81833386956&a=367751510&r=1418752724657&cmd=print
bonds at the top of the channel – double top or safe haven? this is a real question that should be answered or cash is king.
I’ve had a target on tlt of 150 for a long time but rates are forming a Money Flow bottom and bonds are way over extended. So they may fall with stocks for a short time…VERY IMPORTANT
on the 10Y if support at 2.09 breaks decisively possibility of a declining triangle play out towards 1.60 in yield. Would fit with a significant wash out scenario in stocks by then.
here’s the MF bottom projection on TBT which would match the double top and upper channel max on TLT.
http://stockcharts.com/h-sc/ui?s=TBT&p=W&yr=2&mn=7&dy=0&id=t33108791702&a=380633009&r=1418746199587&cmd=print
here’s TNX barely hangin on…
http://stockcharts.com/h-sc/ui?s=$TNX&p=D&yr=1&mn=0&dy=0&id=p32590184287&a=370906351&r=1418754531305&cmd=print
http://stockcharts.com/h-sc/ui?s=$TYX&p=W&st=2010-02-25&en=today&id=t45388798341&a=367751244&r=1418755139186&cmd=print
Thanks for all the nice chart (WITH insight!).
given the trading relationship between Russia and Europe Euro/Yen will take the brunt of further Ruble weakness. The October 1998 candle E/Y was from 170 to 137 or 23p. Current monthly candle 149 to 145. Looks a lot of room to run. Also tomorrow all eyes of Greece?
http://www.investing.com/currencies/eur-jpy-chart
This blogger had a terrible motorcycle accident but is still posting awesome charts
6 month dollar rally is over, nothing will be the same again
buy……..gold?, silver?,….. oil?, natgas?,…….. water?, food?, …….lead?
Anyone added 🙂
Not sure if it matters to anyone, but I am net long for tomorrow.
I’m “less” short, if that’s what you’re asking….
So I guess I reduced??
You’re going to have to be more clear in your question….
And I’m sure they can speak for themselves, but maybe Nicolas??
Maybe Robbie??
I don’t know…. ???? *crickets…..*
went 30% short at 12:44 pST LOL
10% Rydex Inverse dow2X
20 Rydex Inverse SPX
no bonds yet – I am pretty convinced that there is a 50/50 chance of a good drop and then a massive move
Today was “supposed” to be a very strong up day just like last Thur Dec 11 was also supposed to be strong. Except both days had huge early morning rallies that reversed and ended in massive sell offs. Maybe this is hard to believe but I think what the market is indicating a mirror image of the Sep 19 to Oct 15 correction fiasco, except that the date now begins with Nov 28 and possibly end by Dec 26 (???)
If this is indeed what is happening then look back to Oct 8 which was a significant day and also a FOMC meeting. It went in on an extreme low and had a one day upside surge before resuming its decline in a collapse in the next week. If history repeats then yes tomorrow Dec 17 is also a FOMC meeting and markets enter it also on a extreme low. The other uncanny similarity is Oct 7 was 12TD after the Sep 19 top and Dec 16 is also 12TD after the Nov 28 Black Friday top.
By all accounts we should have had a one or two day rally by Monday latest but instead all we are getting are these volatile but big intraday rallies that fade out. If the market surges tomorrow then it might present a fantastic short trade entry if you believe in the power of repeating patterns ….
Steve T, yes looks very much like Sept 9 to Oct 15 only this time’s initial descent is even more steep. I wonder if the latter half will therefore flatten out?
However my preferred scenario for this descent remains a touch of the blue line on this chart before another ATH.
https://www.tradingview.com/x/nB6D4xK1/
ugly candles
oct 2008 feel to it
Moon crossed equator yesterday, why no bounce today-maybe energy is being stored up until after fed meeting.
Betafish, doesn’t the intraday bounce count? Or should it bounce AND stay up?
Equatorial moon crosses often produces four day up swing trade.
i’m not gonna post any positions (jinx)
but man have i been having fun for the last 2 weeks
Biotech losing its support around 3100. Next area of lateral support 2850-2900.
well, are the Watanabes gonna help us take the $/Y down to 115 and below?
i don’t believe Japan celebrate Christmas, this type of volatility may go on through our holiday season, yikes!
believe same – 115 should get through tomorrow if Fed keeps rates zero for longer. On a bigger picture see the pair finish wave 3 lower around 113.7 before a 4th wave bounce to perhaps 115-115.5 and then a 5th into first triple Fibonacci support around 111 (Lt, MT and ST Fibonaccis all coming together) or 108.5/109 if 5th extends. Both targets are equally possible as wave 1 targets. ES should trade similar. So far $/Y and ES 100% correlation in price during this move lower.
see another pennant on the hourly targeting 113 (break 116.45)
Dumb longs, toasted again. It was so clear what was going to happen today.
Not sure I would agree that ~any~ day is “so clear”, but certainly a disappointment for anyone bullish……
But no worries here!!
I keep being told “it’s so simple – the Fed has our back”…. 😉
This is not correction, like last October or January. This is beginning of bear market. Just like bears hoped for many resistance levels to stop bullish advance since 2009, now is turn for the bulls to lose every support they pin their hope for.
38.2% retrace of 2011-2014 move in SPX is around 1700. I do not see any serious reasons to close shorts before that level is reached. There will be rallies, for sure. But all will be sold. Discipline will be required.
Let’s break 1900 first before bear market talk…or even the oct 15th low. Right now we’re short term oversold, look for a dead cat bounce in the next few days.
I do not think the situation is that trivial. A move to much higher (ATH) levels could still occur before such a retrace to 1700. This is because the market could be potentially forming one giant megaphone pattern (viewed from June 2014) and then it (eventually) breaks to the upside.
I am still looking into it but possible candidates for a pending nasty “20% style” correction so far reside around either early spring 2015 or late summer/early fall 2015. But do not quote me on that at this time.
Simple, long and short term technical facts: http://www.cnbc.com/id/102269174
Tomorrow Janet speaks. It will get our attention. This is getting rather interesting.
I keep being told “it’s so simple – the Fed has our back”….
Sorry to say the Feds never had anyone’s back, some just manage to join a party with no invitation only to get drinks passed through a toilet window.
Feds only work for the elite 1% always has, always will.
Umm, I meant that tongue-in-cheek, but maybe that was missed…
I personally agree with you 100%….
I know Barry, it was my way of agreeing with you, sorry, my post may have been seen as negative to yours.
Lots of volatility to come, I’m sure.
After going through my normal list of charts tonight, I’m a bit more encouraged that we’ll see a decent bounce here very soon..
Crossing fingers we get that “Fed rally”… hahaha 🙂
That said, the charts generally look nothing like they did during mid-October…
So not convinced that any move higher from here – IF we are fortunate enough to see one – would be anything more than a temporary event…
Still holding 56% short, and looking for a pop up to add some short positions via TZA/SPXU…
GL
robbie, I don’t care about day to day or short term machinations I am only concerned with the overall picture.
You need to take a big step back and look at what is happening to all these markets. They are crumbling slowly one by one.
Watch the Footsie tumble very soon. I care not that it rallied yesterday I am only concerned with where itis headed longer term.
Now back in amongst the herd!
From Phil:
“So are these the first moves in the beginnings of a new equity bear market?, or just another corrective move?”
Not meaning to repeat what I just wrote above, but overall, my charts now look nothing like they did (overall) back at the bottom in October….
Then, we had money flow diverging positively against lower prices, for a couple of weeks, as well as some firmness – along with a 1%+ move (Oct 17th) in one day – in the HY area….
Right now, we’ve got NONE of that….
MF is falling just as fast as stock prices, and HY is falling even faster….
I’m looking (hoping??) for an oversold technical bounce from here, but other than that, I’m FIRMLY in the “beginnings of a new bear market” camp…
It’s just my opinion, and like other things, everybody’s got one, so take it for what it’s worth, but that’s what it appears to me….
GL…
Evidence is starting to be compelling: the market has peaked. In addition to margin debt peaking as pointed by John, other measures have also peaked. These include household allocation in equities, corporate profits, and credit spread. For charts, see http://goo.gl/Prx86U
DVD, absolutely and it was beginnng to become evident across global indices several weeks ago and has ow begun to flow through to US indices.
I mentioned three weeks ago that AAPL rolling over ahead of the major indices was significant and I still believe that is the case. In recent days strength has been heavily sold, another significant sign.
I don’t care two hoots that the Footsie bounced off its 200wma yesterday. Overall the chart of the the UK index is about as ominous as one can get. Anyone that refutes that is in denial.
http://stockcharts.com/h-sc/ui?s=$FTSE&p=W&b=5&g=0&id=p70692897475
Further to this the SPX has has made two attempts to regain its 50 day the last two sessions and failed. Third attempt and fail will be the death knell IMO.
Finally, the following chart proves John’s case more than any other. I continue to believe that John has emphatically proven that the SC has topped and is rolling over.
These markets are going to trap the bulk of investors at the top. You only have to look around and you can see how many are expecting a Q3 15 top. That pretty much ensures it won’t be happening then.
Nearly nobody is expecting the top is already in.
http://stockcharts.com/h-sc/ui?s=$RUT&p=W&b=5&g=0&id=p22334155632
Hi all, I’m now sick in bed, so this will have to do instead of a full post:
So far this December action has the look and feel of post-second-chance, which is where we should be, namely leading to the waterfall declines, with bears engulfing all the bull attempts. But yesterday capitulative breadth triggered, and CPCE plus a couple of other indicators are suggestive of a bounce. With the particularly favourable seasonality the 2nd half of Dec we’ve got an either/or scenario: stocks bounce here into year end, or post-second-chance rules and despite CBI we see much starker drawdown yet. As the US session closed yesterday there were no obvious markers of a bounce price-wise, so we’ll have to see one day at a time.
Sun Spot numbers are up and one just got active and its emissions could soon hit Earth.
Awesome!
But is that good or bad??
Are you long based on this?? Short based on this??
Do you even trade with real money??
I’m curious…
Because you’re prolific writer, and that’s all well and good, but I have no f’ing clue as to what to do with any of it….
Yes I trade the markets. In fact, I trade broadly and more then I post about here. Here is a suggestion, if you can’t trade Sugar futures then take a look at Sugar ETFs.
Thank you, Richard…
That is something even I can understand…
It’s specific, it’s actionable, and it’s clear to even me… hahaha
I don’t trade sugar, but I’ll take a look….
And I didn’t mean to seem rude with my comment…
I blame it on too much early morning coffee… 🙂
Thank you…
Richard . . where are you getting your sunspot data? The NOAA site has changed and I cannot find it there. I can get it on Spaceweather but one day at a time only.
I got it off of Spaceweather this morning. Note that this increase in solar activity fits with what Mark has been saying and that is that the top of the SC won’t occur until late next year or 2016.
Hi John
I hope you are back to full strength soon.
I was listening to Jim Rickards this weekend, who is firmly of the belief that the fed will introduce a QE variant in 2015.
He speculates that they will print to fund tax cuts in 2015, thus bypassing the bond purchasing mechanism; in other words, unsterilized deficit printing.
Also, the fed loses two hawks in 2015, Fisher and Plosser, with the result being a more dovish fed overall.
Speculation is rife that today we will get a change of wording regarding the interest rate rise timeline, with the language moving back to being data depended. If this proves to be correct, then this act of jawboning will likely provide the platform for our much awaited Santa Rally, and perhaps a fillip for the PM/ commodity complex.
My own view is that this could give us a lift into year end and just beyond, but one shouldn’t fall in love with the upside. Basically I’m in the UBS camp in thinking that the start to 2015 will prove bearish, but then the final hurrah will take the US indices to new all time highs Q3 2015 before the bear starts in earnest.
That said, I’m not married to this opinion and will turn on a dime if required to do so.
Good luck, and seasons felicitations to you and all your readers/ contributors.
TDL
your forecast sounds very likely. Jim Rickards, I don’t know. He has a strong bias, so I would take his “forecasts” with a grain of salt.
Just another reminder that the market was seriously overbought a few weeks ago and now these conditions have subsided we can resume the bull market higher. Remember the market has climbed a wall of worry for a couple of years now.
Remember that shorting is a great short term trade. However, if your timing is not exact you can end up holding a losing position for a long time. I have a lot of respect for John but I feel even if we do get the correction he is looking for, would 18% off the high (whatever it is) be worth it?
Duncan, mate I respect your views but….”wall of worry”???
If the last two years was a wall of worry then it wasn’t a very high wall. And anyways “walls of worry” are found at the beginning of bull markets following a bear market bottom, not well into a bull market
The wall of worry in this market was off the 2009 lows into 2010. What we are witnessing now is the denial stage as the market is topping out and rolling over.
Cheers
I’m gonna have to agree with Allan here….
Not to mention, would 18% off the high be worth it??
Two words come to mind… Hell. Yes….
It would re-set a LOT of very extended indicators, and cause the “end of the world” talk that would be necessary to develop the base that a solid rally/recovery could be based upon…
That said, I don’t have any idea how anybody can predict a market will go up or down a specific percentage… 18%?? Why not 8%? Or 58%?? Or anything??
Anybody that just throws out a number like that is just guessing….
And all I can tell you is, I’m not seeing anything that makes me think this could be a bottom, and I couldn’t have said that in mid-October….
Me ~choosing~ to dis-believe my own charts and indicators back then was MY mistake, and I paid for that, believe me….
And that will ~not~ be happening again….
But right now, they’re just NOT the same…. Things are changing…
That may not be the case a week or a month from now, but if you ask me, this is NOT a replay of the October V-bottom, at least for right now….
Still hoping for a bounce from here, but things are going to have to change drastically in my indicators for me to have ANY interest in the long side…
And I appreciate you’ve made some good calls too, Duncan, and things/indicators may very well change, and change fast, but I’m just not seeing it yet…
Thanks Barry. My reference to 18% from the highs was to the target John specified. So lets say the top was 2079. 18% lower would be 1705. Now that does not include fees or dividends which can add at least 3% if holding for a year. That would mean you might be lucky to get away with 15% if you picked the top. What if it continues higher into Q3 next year as TDL has suggested in his post above. I think we move higher next year too. So I guess Im asking is it worth it to short a market hoping you might get 18% as long as you nail the top?
Fair point, and my comment goes to John too then, as well as anyone else who throws out a number like that… Who really knows?
It’s all just guesses, is my point..
And projections like that throw people off from looking at what’s right in front of them… I see it ALLLLL the time…
And I’m in a “reduce distractions” mode lately, so maybe that’s why it’s a “thing” to me also… Not meant as a jab to you, or anyone else, it’s just becoming a “personal process improvement” project for myself… hahaha
But yeah, assuming 18%, that IS a lot to me, because I use 3X ETFs….
That could be a 50+% return…..in a drop that could easily occur in 1-2 months…
So yes…..I’m good with it…. 🙂
the PTB shouldn’t waste their limited resources on these overnight bounces
let it sell down vicously in the morning and work for a late day rebound
this has the makings of a real disaster but who knows maybe they can save it
Market may bounce in next hours and days targeting 50% retrace of last decline which would be SPX 2020-2030 range.
What we may face today is typical fakeout move after Fed communique which would be down and after this flush corrective rally will begin. VIX is supporting that scenario.
But if somebody has longer perspective then days then surely bearish stance is warranted as most surprises will be on the downside in this cycle.
For the benefit of Small Specs here is another rare call. I think that today is going to be the lowest day in Sugar futures for years to come. I think that Sugar will rally the best of any commodities for the next several years. If you can’t go long Sugar futures then consider various Sugar ETFs.
I don’t normally make such a call to the day as I like to use Weeklies to call Monthlies but given the rare call I made in US stocks in John’s prior report I’ll make another rare “daily” bar call.
Besides the Sugar reports out there let’s see if anyone can tell me “weather wise” why Sugar will likely rally strongly for several years and possible to new all time highs. I believe that there are some on this site who know the weather reasons.
http://stockcharts.com/h-sc/ui?s=$BPNYA&p=D&st=2014-04-21&en=today&id=t22230953781&a=379301100&r=1418832912749&cmd=print
internals are not indicative of a bounce – spx does tend to consolidate at the 150ma before falling again and that is right where the bounce happened this morning. Gap fill at 1990.
Uptrend doesnt resume until we get above Fridays open price of 2030.
bonds should fall – tlt is pretty over extended and should drop to 122ish and then resume
http://stockcharts.com/h-sc/ui?s=TLT&p=W&yr=2&mn=3&dy=0&id=p33860135189&a=371650573&r=1418833963028&cmd=print
2001 should be the extent of this move unless we are going to see a push to 2030
MA50 is at 2002 so that may be a target. It is also possible the Fed disappoints so we have further consolidation and get flush event tomorrow (Greece ?)
does seem strange that after all that has come to pass recently the FED rumor mill has given a FED DAY bounce legs once again. People love institutional cookie cutter lives.
NYADV at +2,493; VIX dropping below the upper BB are just 2 examples.. It they can hold to the close. The bottom is in and time to go long.
maybe but you’d want to see the 10ma on the nyadv cross 1300 to confirm
also cpc is not really at bullish extremes at all and RSP:$CPCE gave a pretty unequivocal sell yesterday…be careful here until it becomes clear!
http://stockcharts.com/h-sc/ui?s=$NYDEC&p=D&st=2013-11-16&en=today&id=p28099269881&a=379301348&r=1418835604639&cmd=print
http://stockcharts.com/c-sc/sc?s=RSP%3A%24CPCE&p=D&st=2011-11-23&en=(today)&id=p64797109301&a=197681529&r=135
http://stockcharts.com/h-sc/ui?s=RSP:$CPCE&p=D&st=2013-09-24&en=today&id=p94015883709&a=377070526&r=1418835844046&cmd=print
I would wait after close of Thursday for confirmation.
Richard, pulled up a chart of SGG, and I like the look of my chart!
Curious why “today” is the day, though… Could be, have no clue.
Just curious for your reason…
And FWIW, I can remember when sugar was under 3 cents!! 🙂
Seems like I remember it at 2.8 cents or so as the lows, back in the very late 70’s…
And as to the weather, I’m guessing here….
But in my best “Billy Ray” guess, I’ll say global “cooling” is ahead, and sugar cane crops will just not be as prolific as they currently are…
Either ~that~ or there will increasing calls for more protectionism by US sugar producers, fearing Cuban importation rule changes….
How’d I do??
I think you mean the very late 60’s. There was a bit of a bull market in commodities in the 70’s. 😉
You made me re-think it, and you’re right, not late 70’s…
Brain-fade for a moment there…. Mid-80’s…
Maybe 84-85…
Yes, for sure. In 85 we got down around that price point as well. Btw Barry, I agree with your assessment (in an earlier post) that this is not just another BTFD opportunity. I wouldn’t describe it as the start of a new bear market, however. Unlike most here, I view 2000 as the start of a secular bear and what we’re embarking on now as merely a resumption of the primary trend after a cyclical bull within that secular bear. Pricing the stock market in gold explains why. My long-term target remains a Dow:Gold ratio of 0.5:1.
Hi DJ;
I’m on-board with you, sir! And with Phil too…
And maybe I’m not describing what I’m thinking as well as I could, and you probably phrased it better.
I was just trying to convey that this is NOT the same as mid-October, and just want people to at least think about it before they get in a hurry to think it is…
Maybe it’s a big drop, maybe it’s a small drop, but it’s definitely not looking like just another BTFD opportunity here…
Thanks for your thoughts…
I made the post before Obama re-established relations with Cuba. Most likely, Cuban Sugar production will fall in favor of much higher cash crops like fresh vegetables.
Here is two hints: 1) Lunar Declinations, and 2) El Nino.
Price wise; today’s Sugar #11 made a doji candlestick on a Wednesday that could help the week become a reversal week. I am looking for the weekly reversal and that means the odds are high that today will be the low for years to come.
Here is an article wrapping up today’s Ag trade. Note that both the Brazilian Real and Russian Ruble rallied today against the $ and both are supportive of Sugar. Brazil is a large exporter and Russia is a large importer of Sugar.
http://www.agrimoney.com/marketreport/pm-markets-ag-markets-prove-volatile-even-as-holiday-nears–2932.html
Back to a 75% net short position, looking for a pop out of the Fed meeting to add more… Maybe this ~was~ the pop… :-O
Elvis so glad you are on today and your wonderful charts would love to try your RENKO chart i can not figure out the formula to get it together…………….can u please put up a LIVE link tyvm appreciate your post as i do all here
Barry, noted your comment thank you.
I still favour a corrective phase rather than
an early stage bear market (at this point).
As per usual price will confirm either way.
I currently hold 4 different stocks, one IT and one ETF.
My IWM had nice 2% up move today after fed “considerable time” comment on interest rate rise. Looking to cruise into the Xmas new moon for another few percent on the up side. Don’t fight the new moon effect, almost every month around the new moon there is a nice price rise.
Just for anyone tracking, up to 117% net short as of this late pop up…
All hail, Janet!! Thank you, sweetie…. 😉
As previously mentioned it would not
surprise me if the FED does not raise rates
in 2015, at most I expect one increase.
The Eurozone is near recession, Asia slowing quickly,
some of the BRIC’s a mess and commodities selling off hard.
Inflation is not an issue.
Personally, the term “117% net short” does not really mean anything……but it does sound good.
imho
J
Not sure how that doesn’t tell you anything, but okay then…..
And I suppose if you haven’t read anything else I’ve posted here, I can see your point, kind-of…
I think of myself as one of the most “transparent as to position” people posting here… Sorry you find that it doesn’t really mean anything, but no worries, please ignore my ramblings…..
leverage means something to those not drinking jagermeister and trying to be smart! lol
I can smell the fear of the fed-worshipers and the faint trace of pee running down their legs!
Barry, it could be a great short entry that you made but I would have waited until almost to the close of today than just shortly after 11am, and preferably the next day for confirmation. Because the last time in this same technical picture on Oct 8 they drove prices up, up, up right into the close. That time it turned out to be just a one day wonder but it coincided with a Bradley turn date too.
This time maybe it is the same play again but there is always the chance for one maybe even two days of follow through and you need technical price action to confirm safest short entry. If SPX does not make it to 2030 or stalls around that level and begins to sell off then you know it is not another BTFD opportunity and to expect a nasty correction.
fwiw – reliable trader source say this was the biggest thrust so far this year and needs to be sold agressively….
http://www.traders-talk.com/mb2/index.php?showtopic=157870
it will be
changed my $/Y wave count to wave 1 stopped at 115.59 and wave 2 complete at 118.62 just now (48.5% of wave 1 is ok). Now we could be looking at wave 3 lower ideally 1.618 x wave 1 or down to 108.5 which is the rising megaphone line. Then wave 4 to either 112.35 or 113.5 before a final low to 106/7. ES would trade down into the mid 1700 as mentioned by others here.
also of note is wave 1 in $/Y was an ABC pattern which is usually associated with impulsive – meaning direction of the trend is down. Also fast wave 2 has the character of counter trend.
now wave 2 did 50% proper
this move up from 115.55 to present is forming a channel, if this is wave 2, may turn out to be a bear flag if we don’t get above the 119 area (easily seen in a 4 hour chart).
very interesting article relating to the word ‘patient’
http://www.forexlive.com/blog/2014/12/17/feds-considerable-time-drop-recalls-patient-2004-tightening-bloomberg/
Great point! Should be a hell of wave 3 once it gets going. Not much of a Xmas break for markets would be my guess. Quite to the contrary bulls a sleep at wheel or in holiday spirit will accarebate moves as we have seen the last 10 days.
December 17, 2014, 3:18 P.M. ET
Did Janet Yellen Kill the Santa Claus Rally? – Barrons
nothing can kill Santa! (Satan)!
wow – worship
this move may go to 2030 before reversing.
I concur.
Wow, what a rally ! I told you so. This market will be at new highs in no time. Very nice buying today by the FED. The FED is supporting the high yield market, as I expected. Very good news for the bulls.
easy peasy
😉
Nicki!! I was WONDERING where you were these past few days……
I was counting on you to help get the market back up, so I could re-enter shorts at a higher level…
Thank you for that… You “Da Man!” 🙂
RUT Up nearly 3%, is this really a fake out?.
I am surprised the consensus appeared to think
the FED would completely remove “considerable time”.
Why would they need to?.
The yield on the 10 year is close to 2% and major
input costs such as oil have fallen dramatically.
Going to all time new highs imo Phil. 2100+ by end of the year is what im positioned for and expecting.
I still have no idea why anyone would think this time is different with on a FED day.
Now the bears will be saying each day that the top is in all the way to new years day.
No offence intended, I just don’t understand what 117% net short means……so let me rephrase the question:
“what does that mean”?
J
Didn’t mean to be short – hahaha – but thought it would just be an easy and intuitive way to describe my relative positioning to folks…
So, lets say I trade $100,000 total equity…
Was at 55% net short a few days ago, or short about $55k worth of stock…
Brought it up to about 74% earlier today ($74k worth), and then up to 117% net short late this afternoon…
So, for every $100k of equity I trade, I am currently short $117k’s worth of US stock….
Not meaning to get lost in the weeds, but it also changes during the day slightly as well, based on what happens to the prices of the ETFs, versus my account equity.
I have a spreadsheet that I built that calculates it all automatically with price changes and all, so it’s just an easy way for me to track my relative positioning at a glance… Just hit the “Refresh” button, and done…
And even if no else cares about it, or understands it, it’s critical to me throughout the day…. I tend to scale in and scale out of positions, based on a lot of different info…
But my overall guiding “lighthouse beacon” is a swing-trade system I built some years ago, and it’s positioning is always one of 4 readings….
50% long or short, or 100% long or short…
Trades last anywhere from 3 days to 3 months, and you can trade it with no leverage, all the way up to 3X leverage… Whichever you prefer…
I tend to use 2x and 3x ETFs, but the system trades the same….
The system is currently 100% short, 50% from early-Nov, and another 50% mid-November… Average price of current shorts is (2031 + 2040)/2 = 2035.50 SPX
Actual trading is just me trying to “enhance” the system’s return a bit…. 🙂
Sometimes I pat myself on the back…. Other times, I say “what an idiot”…. LOL
Regardless, I think I’ve been pretty transparent about everything all along the way here…. And this was probably more detail than you care for… hahaha
Anyway, hope that helps…
Thanks..
All or most of today’s gains should evaporate by end of the week. All bullish emotions spent on one single FED day. Insane. Cold reality should return soon. VIX has lot of room on the upside.
Gold showing weakness, should also decisively break down.
agree – looks unfinished business in the S&P to the down-side. Have todays high as 4th wave waiting for a 5th lower. Extended can bring us to 1922. Believe there is a gap also which would be handy. Another area worth watching in my view is the Aus$ which keeps on going down. I have some important up trend lines coming in around 75-78 and Fiboanccis between 72-80. Looking at HUI I see an area of strong support between 100-150. Have just scratched the surface there. So agree with you. Until the Aus$ has tested those aforementioned support levels do not believe the wider commodities complex has a firm footing.
jegersmart, perhaps you could enlighten us
as to your central view on equities, where we are
in the cycle?.
Thanks in advance.
I have made my outlook clear,
as have others.
Pssst … who thinks SPX can make it to 2079 by this Friday? Hint: I do 🙂
If not Friday, next week for sure.
Oct 8 FOMC rally was a fake out last time and many loaded up on that day assuming it was the bottom and a bullish reversal. You can imagine their shock and surprise during the following five trading days!
I already alluded previously that there would be a huge rally today Dec 17 that matches what occurred on Oct 8 and we got it. Oct 8 had a SPX +45 intraday low to high and Dec 17 had about +44 from yesterday’s close (the low) to today’s high.
The difference this time is the markets traded much weaker leading up to Dec 17 and thus have a little bit more wiggle room upside before encountering downtrend line resistance (<10 SPX points). If there is no follow through rally or if it stalls before 2030 and reverses by the end of this week then two bearish paths can occur.
1. An orderly sell-off hitting the parallel lower downtrend support line around 1920 (61.8% Fib retracement of the 260 point surge from Oct 15) by Dec 24/26.
2. A more panic driven liquidation that follows a downward megaphone pattern that evolved from the Dec 5/8 highs. Minimum target in this scenario would be 1905 if just a 2 or 3 day panic and possibly 1880 if it extends to the above Dec 24/26 window. The 2 day panic scenario (sell by Fri) would be reasonable too because I can envision many fund managers selling their best performing assets (i.e. USA equities) to match the liquidation of terrible performing assets such as oil, gold, and commodities to minimize tax payments if they want everything squared up by Xmas.
Also in mid-Oct there were two Bradley turn dates of Oct 9 and Oct 16 just one week apart. In December there was a Bradley turn date on Dec 9 or 10 (depending on helio or geo) that now clearly marks a top in hindsight. An upcoming one is pending on Dec 26 and given the path ventured so far since Nov 28, I would assume it marks a bottom.
Anyways, there is too much similarities that cannot be coincidence so I believe it is worthy of a speculative bet on the short side with a tight stop around the downtrend resistance line measured from the most recent Dec 5 top.
Barry,
jegersmart appears not to read posts,
or skim reads which results in a lack of comprehension.
I have made my views crystal clear, and as previous
posts cannot be altered they are there to read.
If people do not wish to read or take any notice
then that’s fine, but to be accused of
stating something completely different
is another matter and unacceptable.
jegersmart, if you comment on people’s views,
at least read them, rather than posting .. I can’t
be bothered to check as you did with mine.
No more to say on that subject.
FWIW a couple tech stocks I follow such as AAPL and INTC both have been trading in downtrend channels similar to SPX. The interesting thing is that both appear to want to head towards the lower channel bottom that when extended out in the following week also coincide with previous resistance levels of $102.5 and $34.60/.75 respectively. These prices for both were the breakout levels after AAPL announced their last quarterly results providing huge iPhone 6/6+ growth and INTC provided positive growth guidance in 2015 from their Nov 20 investor’s meeting.
We’ll see how they both play out. IMHO both have a bright future in the upcoming two years.
Hi Barry
“Phil White” has become upset again, so please take my question as a straight question – if I have missed past explanations as to what 117% net short means then I apologise and I will go back when I have time to see if I can find the full info.
Hi Phil
The vitriol is back I see, but I do apologise if I have misquoted you. That was not my intention and I do admit that I am short on time these days. Your comment above confused me, because they seem to relate to another post some dozens of entries ago. May I suggest that if you are quoting something by anyone, you may consider cutting and pasting the post and then adding your comments underneath perhaps? We should all do that.
As to your sarcastic request in terms of enlightenment, I doubt that I could enlighten many here. I can tell you that I do not trade cycles as such, although I may consider them when directing longer term investments. I therefore have no view on “where we are in the cycle”, because I do not trust cycles. My view is that by recognising one I feel that I have opened myself up to bias and I desperately try to avoid that when trading. I fail, but I do try.
In terms of equities in general, it is an interesting question because I of course do not have the same view on Venezuelan equities as I do on Chinese, US or German equities. Do you? If so, why?
Perhaps I could try to answer your sarcasm with some transparency in terms of current open positions. That will at least give a sense that I am committed and not just fantasising about possible future outcomes for my pension funds.
I am currently long Tesco, 2x airlines, 9400 DAX put, Nikkei and BP.
I am currently short Intertek, SBRT, and CLF.
There are a couple of hedges in place in addition to these, but very few positions open at the moment, having closed 14 positions in the last 3 sessions – some of them short and closed to early…(nothing new there then).
At the moment in terms of the SPX for example, I am inclined to wait before opening new shorts – and I am on the lookout for some FEB/MAR OTM’s. 2100 on SPX? Why not, it is only a few % away……I am starting to fancy a Hang long (suits you sir) but will probably hold off for now.
Hope that helps and hope that you regain your composure soon PW.
J
I appreciate that apology, thank you.
Steve T
Great post btw, thank you.
J
day like today is once again the reason why i never hold shorts for too long. Yellen seems to always get the job done to squeeze everyone out. and I have learned not to bet against it. I am long QQQ and short VXX from yesterday, and am holding until end of week. New Moon is next Monday morning and so i think the highs will be in by either Friday close or Monday morning open, and thats when I look to reinitiate shorts. Ideally we hit the megaphone resistance for the best risk reward.
https://davinny.wordpress.com/2014/12/18/20141217-santa-squeeze/
Given how much pressure Crude is having on stocks the following Crude seasonal charts are very important. They all point to a major low in mid December:
http://www.signalfinancialgroup.com/seasonal/seasonalCL.php
Also note that at this major seasonal low in Crude, meaning Crude rallies from here, that there as been a substantial increase in solar activity. BTW: I hold that Mark is correct in that the SC top has not come in and won’t come in till late 2015 or 2016.
Therefor, I am expecting stocks to rally back up to new ATHs.
Charts of DOW seasonals including years ending in “4”:
https://search.yahoo.com/search;_ylt=Aolbidotq5LlamxicKjb_zCbvZx4?fr=fp-yie10-s&toggle=1&fp=1&cop=mss&ei=UTF-8&p=dow%20seasonal%20charts
Given the recent increase in solar activity and Crude’s major seasonal low in mid December the seasonals for years ending in “4” needs to be considered.
Just a short update….
Nice move up in RUT today, and if anything looks energies seem to have a chance here, but overall have to say it was pretty under-whelming technically…
I know I sound like a broken record, but just not seeing the strength that I guess others are seeing…
Wouldn’t say “All hat, ~no~ cattle”……but more like “All hat, baby calf”….and we’ll see, on just how that calf gets along from here…
All in all, just not looking all that healthy….
And next will be all the rising wedge calls…..
ES contract retraces 50% of decline as of this morning in Europe
Thanks all. New post
Not sure what all the fuss is about. So what the market bounced?….it was oversold and it could have quite easily got more oversold.
Nothing has changed and this bounce, or shall I say “dead cat bounce”, because that is exactly what it is, will not last.
Globally earnings are flat and have been for some time. In fact they are now beginning to trend down.
Global GDP growth is in decline and falling fast. Real US GDP would be lucky to be 2% and current and certainly future US earnings can not support higher share prices which are already overvalued.
The Fed statement yesterday was a big fat nothing. I don’t even think the Fed really believes much of what they said about the US economy, but they had to give the impression that all is OK.
The market will wake up pretty quickly but in the mean time smart money is off loading yet again and they have used the Fed speak yesterday and an oversold status to sucker in more top buyers.
Have a look at the VIX. Two observations – all gaps filled from the october surge in SPX. Secondly RSI got to same overbought RSI readings appox. 72.
This market is going to all time new highs. Given what we have seen over the past year i would not be supprised if we finished the week at 2079. This would give a bullish engulfing candlestick. Like I said no one messes with Santa.
How many Fed meetings have we had where the market has crashed? Yes this market doesnt reflect the economy but who cares?
Some bears like Grantham are predicting 2250 before the market peaks.
ES contract retraces bit more then 61.8 %. Should find some resistance at that level and reverse even before U.S markets open.
Of course further move up would bring possibility of new highs but I still estimate it as lower probability. In case it happens then top is moved somewhere into March.
The moment I have doubt BTFD, SPX rallied +100 points… I bet when I finally believe BTFD, the market will crash. 🙂