
I played the long side of the stock market from 2009 to 2013, which longer term readers can vouch for. I reiterate that in case there is any doubt amongst newer readers that I may be a permabear. However, I would rather hope you can see my work is as objective as I can make it, bearish as it now is.
I began my series of bearish posts in December 2013 as topping indicators began to accumulate and I entered my opening shorts. I made my first topping call in early January as 31 December 2013, and here is the link to that post: click.
In that analysis I cross-referenced over 30 topping indicators and I therefore don’t have many regrets. It was a strong case, and it did capture certain peaks in risk and the likely beginning of the topping process, as shown here:
 At that time, leading indicators were predicting a weak Q1, which then shocked to the downside, and earnings guidance was the worst on record. Solar scientists predicted the smoothed solar maximum was already through by the end of 2013, so the whole set up looked very promising.
However, solar scientists got it wrong, as sunspots continued to a (likely) peak of around Feb/March 2014. Therefore, I can now retrospectively account for speculation increasing from 31 Dec through to the start of March, and the negation of my original topping call. But at the time, not much I could do.
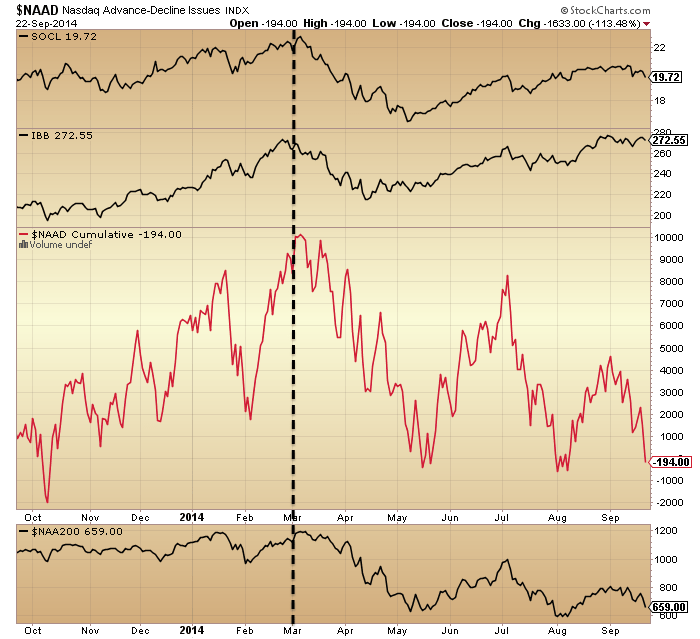
Below I present evidence of that Feb/Mar speculation peak in social media, biotech, Nasdaq breadth x2 (i.e. Nasdaq stocks started to break down here), and relative European and UK small caps performance:

 All peaked at the turn of Feb into March, and this fits with margin debt leverage which currently peaked in February. My biggest short position is in US small caps, the Russell 2000, and this index also peaked at the turn of March, adding to the collective case for speculation and the solar max to have peaked at this time.

In a recent post (click) I detailed the comprehensive case for the market peak but stated we were missing a technical break. That R2K chart above shows the likely trigger for waterfall selling. A decisive break below 1100 would confirm and seal the topping process.
Meanwhile, on the SP500, I suggest the technical break is around 1900, where the 200MA and August low now collide:
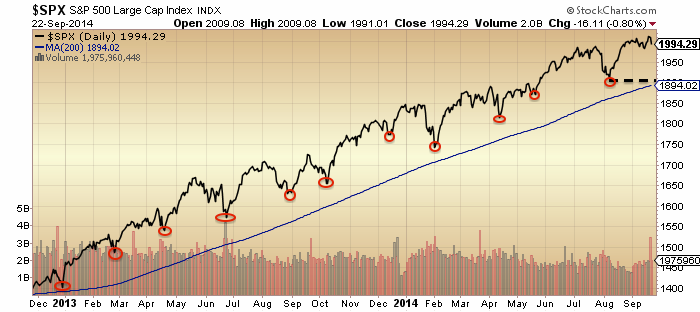 A decisive break below 1900 would produce a lower low, a move under the 200MA (after 2 years levitating above it) and a break in the pattern of v-bounces. When I look at that chart I see clear evidence of the sun-inspired speculative mania, whereby every dip is swiftly bought up and levitation is sustained. Could Elliot Waves or other pattern techniques really predict that chart, and its ultimate conclusion too? I find that hard to believe, as I see a mania which is only predicted by the solar maximum, and the chart does not have a more ‘usual’ ebbing and flowing of sentiment waves. However, something sustained the speculation in large caps between March and now, so what did?
Certain additional topping flags have congregated in the last 2 months: vix divergence, extremes in volume, more negative divergences, higher Sornette bubble end flag intensity. But none of these offer anything revolutionary to what was present at the start of the year. Certain divergences were not so mature in January, but equally certain divergences are now too mature (versus historic norms). In short, I don’t see anything major now present as a topping flag that was missing before, but rather only a few subtle additions which add to the case. However, I put that out to you readers for your views.
The Nikkei did not top until 5 months after the smoothed solar max in 1989, so a top at the turn of August-September in 2014 fits that kind of lag, though here we could argue that the speculation targets were RUT, SOCL and IBB and have conformed to a tighter fit with the solar peak. Either way, I believe the market is on borrowed time since the March speculation peak, which now looks fairly clear. This window around October is the most likely for the falls to erupt, and various measures of ‘fuel’ suggest continuation of the bull market to year end is unlikely. Friday and Monday action looks very promising, and now I look for further follow though to confirm it. But I’ll stick my neck out again and say I believe this is finally it.
So a reminder of targets. Falls were swift and nasty under similar historic conditions:
Dow 1929: 3 weeks 44% declines
Dow 1937: 8 weeks 38% declines
Dow 1968: 8 weeks 18% declines
Dow 1987: 2 weeks 34% declines
Nikkei 1989: 6 weeks 27% declines
Nasdaq 2000: 3 weeks 35% declines
SP500 2011: 2 weeks 18% declines
I am therefore looking for a minimum of 18% declines over a period of 2-8 weeks. I believe such waterfall selling will kick off once the technical price breaks noted above are made, and I expect precious metals at that point to accelerate in the opposite direction. However, history is not clear on which way gold mining shares should go at that point, as they may only take off after the waterfall declines, and precious metals could be held back to some degree by forced redemptions under cross-asset selling.
I believe Friday kicked off the downward momentum in stocks, and that what looks like a breakdown in precious metals will now become a fake-out that is reversed. The very skewed positioning in FX completes the picture for an all round reversal in assets.
Indicators put us at the end of the topping process in equities. This means no ‘second chance’ ahead. Rather, we can see the second chance peaks already on RUT, IBB, SOCL, European indices and in behind-the-scenes indicators, so I believe US large caps are displaying a false safety in their price trends and that those who think a topping process has yet to form from here will be mistaken. If I am correct in where the markets are in the timeline, then bears should remain firmly in control now. Not every day will be down, but the trend will be fairly unforgiving, with little chance for anyone to get out or in. The technical breaks should then trigger the panic selling and the devastation will be through by November. From there the market should begin a slower partial retrace of the falls into year end. This is all based on historical analogs.
My aim is to close out of shorts once the panic selling leg is through, as the partial retrace of the falls should be multi-month. So I’ll be doing my best to use indicators to try to gauge where and when the bottom is in the waterfall selling. Might selling be more measured, say like after the 2007 October peak to year end? I don’t believe so because of various factors: the solar max, leverage, sentiment, allocations, skew, levitation above 200MA / pent up correction. Rather, the set up is for particularly heavy waterfall selling, and the closest analogs listed above. They average at 30% declines over 4-5 weeks.

Great post John. I’m with you longer term but think this is another bear trap. Ive gone long SPX1989 for a swing trade higher.
Thanks Duncan
how is this a bear trap?
it could be if it was set by the bears.
lol
Hi John
Thanks for the above. With regards to the above question of what has sustained large caps, the only thing we know for sure is that there has been more buyers than sellers:) I sometimes wonder if this type of price action can be explained by the ETF’s and tracker products available through all sorts of channels these days. It smells like “dumb money” to me, but you never know?
I agree as per my earlier post in the other thread that the 1904 or around the 1900 mark on the SPX is a major area to watch now, on the way down I also suggest the area around 1960-1970 are of minor interest potentially.
On the UKX however, it looks to me like we may be looking at a retest of the 6580 area, certainly to me for the last few days anything below 6950 is now short term bearish. I may look to go long on the UKX over the next few days but will watch and wait first. In these times, the trading is always non-leveraged for me btw.
Look forward to seeing more discussion on this.
J
Thanks. Dumb money and corporate buybacks appear to have been the two main drivers of the price extension but of the two I would have thought dumb money would peak with the solar max.
John,
Watch the weekend of October 11/12. The tides give a low, we have a lunar declination extreme and the moon wobble on oct 12. And all apo/peri cycles up again.
Doesn’t hurt to put this one in your schedule. As I see it, the perfect moment to hedge or close your short position.
Thanks. I will watch. I believe indicators should provide clues if the selling is to end early.
Sure, but if your indicators give a signal in that weekend, maybe you’ll remember this post 😉
Andre, the fractal that I am currently following also indicates a sharp significant correction from Oct 2/3 to Oct 9/10. Out of coincidence, there is also a Bradley major turn date on Oct 9th too, but that did not factor into my calculation at all since I am tracking the TDs relative to what happened back in early Mar 2014.
But I should also warn that the game is not easy and on Oct 2/3 it should have the indices at new incrementally higher 52-week highs, and this is after indices have just broken below 20D-MA and proceeding towards 50D-MA yesterday. Unbelievable stuff but it is what it is.
Again, I do not think we will get anything remotely close to a “crash” and any decline should be well under 10%, even the volatile Nasdaq tech index, and SPX should be under 5%.
If the oct 3 high is a higher high I can’t say. Just saying we will see a swing up after sept 26. And on oct 3 the downtrend will resume. Remarkable you see the same dates.
Cheers.
Andre
Watching TD Monthly Countdown.Nov for 13rd monthly, the third week of Oct for 9 setup and also 13rd weekly
John another excellent post!! Thanks.
re: ‘Could Elliot Waves or other pattern techniques really predict that chart, and its ultimate conclusion too? ‘
I’m a die hard Elliottician and I have to say that the period you’ve shown for the S&P chart was the MOST frustrating I’ve had in years in trying to count Elliot Waves. Even with the complete wave over I’m still scratching my head over the count, although there have been a number of others who have come up with semi-plausible counts. Most of those in my opinion have had to ‘stretch’ Elliot’s rules quite a bit to make the counts work.
So…yes you are right the Solar Max is the closest explanation for what transpired.
Thanks for everything that you do for us.
Thanks Purvez, and for that confirmation.
The wave patterns have been difficult if a person tries to label everything on the chart. But it has been pretty straight forward if we just look at the 5 leggers going up and the 3 leggers going down. I was able to predict the 1904ish low days in advance ( and post it here) because it was a 3 legger abc down. So we knew another powerful 5th wave up was coming. We can’t always predict the strength of a 5th wave but I stated 2022 to 2023 spx ( area) as a target for a “normal” 5th wave. I was also able to predict the 1979ish spx low within 1 point days in advance ( and post it here). Again, it was a 3 legger sell off ( wave 4 OR “A” of wave 4). But what I can not say with certainty is what the exact pattern is from the 2009 low to now. If a person tries to be absolute in this area, they will likely end up very disappointed with their EW work.
The key to success with EW in this goofy ( probably “B” wave from 2009 low ) pattern is to just count the 5 leggers and the 3 leggers.
2023ish spx was a good target for a wave 5 high, but, the 2022.50 spx high was made with a gyration type pattern that can be viewed as a “B” wave. If that is what it is, then this current sell off is a “C” wave that is completing a very large abc wave 4. 1978ish is “A” wave, 2022.50 as the 3 legger irregular “B” wave, and now down in the 5 legger “C” wave of a large abc.
So at this time, the EW pattern can not confirm a big top has been made, although it is certainly possible. All of my projections have been met, and as John has shown us, the indicators are red lining. The SP is also against long term trend line resistance. Old Yeller claims to cut bond buying back to zero next month. Everything is in place for a top, but the EW pattern has not given us confirmation yet. This sell off “can” still be part of a 3 legger down.
What follows a 3 legger down? A powerful 5 legger up. So the EW has been extremely reliable “IF” a person just reads the 3 leggers and 5 leggers. And until this 5 down is finished and we can see a 3 legger up, we do not have confirmation of a top from an EW perspective….Even tho a major top may indeed be in place. If a top is in place, then this is one of those cases where EW is slow to confirm.
John, whilst not everyone may agree with you those that are open and objective understand and appreciate your conviction and dedication.
Once again a great article worthy of even the most sceptical of observers respect.
Thanks Allan
R2K has failed to make new highs. That alone should be a huge heads up that this market is rolling over. John nailed that top.
Seondly, to those said that gold would tank on a market crash or substantial decline I suggest they take note of the rebound in silver yesterday off the lows and the action in gold on futures weakness.
I have little doubt that the decline in gold and thus gold stocks the last two weeks was engineered by big money to position themselves into gold stocks ahead of a major broader market decline.
The dollar which is currently massively overbought is going to get crushed as foreigners, the biggest buyers of US securities in receent months, sell their holdings and repatriate their funds. The US bond market, which previously attracted much of that capital, have been destroyed.
Nicolas, no offence intended but that “easy money” gold stock short is going to become a short disaster!
Frankly mate, $150 gold is possibly the most absurd comment I have ever heard regarding gold and it was said, I believe on the back of rampant bearsihness that is indicative of sentiment in the gold sector.
Like I said, no disrespect intended but if you say it you need to back it up with reasonable argument and I don’t think you can.
http://stockcharts.com/h-sc/ui?s=$USD&p=D&b=5&g=0&id=p87344861611
Well said Allan, the recent calls for 800 gold 5 silver have been really ridiculous IMHO……. don’t people realise that when gold drops to even 1000, so many mines will not be profitable and will shut down. Then if people like to claim supply and demand – where is the supply then?
US treasury bonds receiving inflows here Allan. When or if the equity markets sell off, proceeds will flow in to treasuries. Look at the charts. It has already started. The Dollar won’t be sold off for any other currency at this stage in the cycle. A crash would see the wide scale selling off of global currencies into the Dollar as is often the case anyway. But treasuries or equities, capital will stay locked into the world’s reserve currency.
Alternative… Whilst everyone is expecting a fall, we rally from here – short term whilst gold breaks 1200 down to 1100 ish. Then comes the booom
but hey.. you could be right 🙂
The market plays interesting psychological games, doesn’t it? Shorts should be more and more aggressive as time moves on in this topping process, yet it becomes increasingly difficult to do so psychologically given that in every prior instance this year buying the dip has worked to one’s favor.
I think the markets are poised for an explosive move higher over the next few days.
Big call Duncan…..big BIG call!
Judge me a few days Allan 🙂
I think it’s entirely plausible we retest the last recorded lows – 16,200 Dow or thereabouts. So a double bottom then rally. But this would be a great opportunity for shooters out there to take advantage. 1,900-1,930 S&P looks to be strong support to me.
Sorry I meant shorters, obviously.
Another piece of great work John. Thank you so much!
You mentioned that the sell-off more likely would not let anyone in and out. It looks like you expect the waterfall starts out as a bang, following by several days of more declining?
Agreed with Alan wholeheartedly that gold is highly manipulated by the big banks. Goldman Sachs specifically said they expect gold to drop below 1100. They probably will make sure gold hit that bottom first before buying back. I don’t think gold is at capitulation phase yet.
Thanks Erick. Measured declines, then technical break, then waterfall declines.
Thank you John. Noted.
How some of you guys have kept your nerve
and stayed short is well beyond the limits
of my psychological resilience.
100% cash is my ultimate defensive positioning,
I really hope this is not yet another bear trap.
It is beginning to have the look of a more
significant sell off than many of the one day
wonders that rapidly reversed.
All eyes on the US now.
The Smoothed Sunspot Maximum is now almost certainly behind us now – in April 2014. But its not necessarily that straightforward:
1) the weak versus strong solar cycle thing I’ve been annoyingly banging on about, which indicates on the balance of probabilities that SC24’s speculation peak is more likely to be around 1 to 4 years after the SSN maximum.
2) SP500 has already surged past its April 2014 (SSN max) level. This must cast at least some doubt about a single, coincident SSN+speculation peak. But something similar did happen to the Nikkei during late 1989, when the Nikkei surged another 12% during the five months after the July 1989 SSN max. (A 12 % increase in SP500 from April 2014 prices would reach 2088 – I’m not suggesting that’s likely, but it is possible).
Solar polar field strengths are still languishing close to solar maximum levels, so there’s no evidence there that sunspot numbers are likely to significantly die away soon: http://wso.stanford.edu/Polar.html#latest
All told, I think we’re looking at a couple of weeks of sharp volatile declines in US stocks, followed by an astounding bubble…
Mark, always enjoy your posts – they provide an interesting juxtaposition to John’s solar cycle analysis.
Thanks Gary – that’s how I would hope they’re taken.
I’m very appreciative of being able to comment here, and John is remarkably tolerant of other’s conflicting views. For me (and I think for John as well) – I’m less interested in being proved right, and more interested in picking up a few bob!
Thanks Mark. Always love reading this blog and your comments. Did you notice comment made by another John about prediction by astrologer Mahendra Sharma? John said sharma is bearish on World Equity up to Oct 8 2014 and then expects bubble up to Sep 2016.
Yes Jigs, I definately noticed those dates too.
So there are several differing approaches indicating a low during this 06/10 October timeframe – yours; mine (a confluence of two varying lunar patterns); Mr Sharma’s (Indian Astrology I presume); and Andre (gravity).
Decision time for US equities – soon!
Look at this plot http://www.solen.info/solar/images/cycle24.png . Each hemisphere seems to have a blow off of activity, perhaps due to magnetic polarity flipping. Seems that collectively the activity shall decline from here on out, since both hemispheres have completed their cycle independently.
Duncan, I always have an open mind but this:
http://stockcharts.com/h-sc/ui?s=$COMPQ&p=D&b=5&g=0&id=p13025435938
Says you are very hard up against it.
And this chart quite frankly is the scariest chart that bulls have been up against IMO since 2011
http://stockcharts.com/h-sc/ui?s=$NYSE&p=D&b=5&g=0&id=p77418252330
Jegersmart,
You’re reply to Gary was very thoughtful and ‘balanced’ to use your word.
We all are – as to extend I believe- using the methods you describe. This blog offers other values. John offers great analysis of the markets. Do I always agree with his thesis? No, lately more often than not I found myself on the other side of the fence (bullish that is; the weak internals do suggest we could be in now for something ‘completely different’). That’s is not important though.
I also like what others posters bring to the forefront, their willingness to research different, often unusual angels and exchange opinions regarding the markets. Is it always useful for trading? No, and that’s not important neighter. Cycles, the way I presented them over here, are just a tiny part of whole picture. It helps me to identify ‘critical’ windows in time. My 55 TD on the Nasdaq was meant as an example how quick and easy this may have helped in trading to identify highs and lows. Said enough. I like reading or lot more than writing, so I will return to the silent visitor as I was during the last years. Thanks for your posting your critical thoughts, Jegersmart.
Peter
Advice from a trader I respect – thoughts are welcome:
When you trade a leveraged ETF, always prefer trading short. For example, if you want to be long IWM with leverage, you short TZA. If you want to be short, you short TNA. The difference between shorting a straight ETF or going long an inversed ETF always favors the Short trade, because these ETFs use options that need to be adjusted overnight. These costs weight on the long ETFs but help the short ETFs.
Gary, brilliant and whoever said I think is right on the money. I need to think about this some more.
Cheers
Wise
Great piece as ever John. One of the best sites anywhere. Keep it up!
Thanks Jonathan
Gary, completely agree.
US futures only fractionally off atm folks.
John, Thanks again for sharing your work. Well done!
Cheers
I said yesterday after the close that silver had put in a reversal and bottomed(and as a consequence gold too) and so far that looks to be the case.
I expect much higher prices in both as the broader markets decline.
http://stockcharts.com/h-sc/ui?s=$SILVER&p=D&b=5&g=0&id=p47274629254
I know Mark Hulbert personally and respect his statistically-based work and integrity. Always amazed at some of the cartoonish comments to his pieces who suggest he is a shill for others. He’s the exact opposite.
http://www.marketwatch.com/story/did-alibabas-ipo-signal-a-top-in-the-stock-market-2014-09-23?dist=beforebell
thank you John .. great thinking
Appreciated
Reopened dow shorts and gone long ftse as a hedge. Ftse is oversold at the moment and I expect it to outperform other indices throughout rest of year.
I repeat my scenario: top between spring-summ´14 in EU indices, top Russell2000 in march´14, rebound EU indices now, similar to 2007, most of them, top in US indices, 2nd top DJI drop 8-10% -Dow Jones, rebound likely nov´14 and within the 17 years cycle, would bottom between 2015-16, I explained my targets weeks-months for a long time.
Remember Us Construction Index topped in 2013-14 , similar to 2006-07>
http://foros.estrategiasdeinversion.com/foro/foros-de-bolsa/1119589/us-home-construction-etf-itb-/
@apanalis
Via currencies……..I’m positioned as short as short can get.
You can’t look to time this thing to the day…or even the week for that matter, and conviction is key.
The downside moves much faster, but you need to be there first.
I am as short as short can be.
Great work John.
Unsure, are you short $, or currencies. May be mistaken, but I was under impression that you were near term bullish on currencies, especially the Yen. Apologies if I got that backwards. Thanks,
SC
Duncan, granted you have made some good
recent calls, that is a very brave one imv.
The US today is key, that will decide direction.
If we fall once again in to the close then some
of the uber bullishness will begin to ebb away,
however you can not rule out a rebound here given
recent history.
US market opens and gold gets dumped back down …..how typical.
BABA shares coming back to IBs
We might have a slow multiyear decline, mirroring a slow decline in the solar max. This solar cycle is notably different than recent cycles, and if there is a correlation, might have a different effect on the market’s reaction. As in slope, rate of change, etc.
Is anyone playing the natural gas prices? If the north hemisphere has an extended cold spell due to diminishing sunspot activity, yet warm summers and solar energy replacement, it seems that nat gas prices have the potential to oscillate wildly.
Yes, I am. Agreed there will be significant volatility. I base that on some very cold winters that are in the immediate future. Unlike anything in our life times. We will be begging for global warming, we will be told of the virtues of owning SUV’s 😉 Yes the cooling demand in summer will be less (less gas), BUT that is dwarfed by other impactors. The winters will be at least as cold as the last 130 years, and they will last for many years. Also the heating season will become longer as demand will rise earlier in the fall and decline later in the spring. Us gas prices are at a significant discount to USprices, hence the potential to arb the product market. Domestic infrastructure is dangerously close to weak link failure, as consumers scramble for ‘deliverable’ gas at any price. Domestic coal burning capacity is being pulled off line and/or made more expensive. And the huge unanticipated event is that nat gas supply (production) under performs significantly. Without writing a lot, there is a problem that is developing in production, that will start to get some attention from the media in about one year. The industry is already aware of the impossible mill they are on. Trust this helps.
Elliot wave charts for natural gas is bottoming out at bottom of wave 2. Which means that a strong wave 3 will take place soon for natural gas. The predicted cold and brutal winter will likely make this a very strong wave 3 up. The opposite is said for oil, it is in the middle of a wave 3 down instead. Likely less demand as people stay inside to keep away from the harsh winter. We are supposed to go down to -40 degree F here in MT. It gets deadly at these temperatures. I will be staying in with my heat turned up and reading John’s great blog.
John,
Do we have confirmation that the solar max is behind us? Is it possible that solar activity will increase yet again in such a way that we get a new higher solar max sometime in the next few months?
follow Raben.com on a daily basis. You get a pretty good idea where we are trending – up or down.
I will check out that site. thanks!
It is probable that it is behind us, but not certain. SIDC still have an alternative model that predicts a year-end smoothed max, but the bulk of models and current evidence do not support this.
thanks John!
Jonathon, you do realise that US treasuries are attracting foreign capital on the anticipation of higher rates flowing through to the dollar and compounded by rising US stocks.
Treasury purchases are not due to perceived market collapse which is about as far from peoples minds as can be.
So what if the markets tank soon? …….What happens when foreign investors see their US stock holdings getting a pounding?
Their selling will weaken the dollar.
Will they opt for US treasuries this time around knowing that zero rates will be inevtable? ….or do they repatriate that money?
What happens to the huge foreign pension funds holding massive amounts of US stocks that begin to receive large redemptions on the back of a collapsing US stock market?
They can’t pay in their clients in USD’s. This market collapse will see huge inflows into US treasuries.
Sorry should read
“They can’t pay in their clients in USD’s. This market collapse will NOT see huge inflows into US treasuries”
Yes I do realise that Allan. I also realise that the U.S. economy is perhaps the only thing keeping the global economy upright at the moment. China has serious headwinds to say the least and you know my views on Europe, where interest rates are going negative. We have push and pull factors at play all over the place. It’s not just about US market perceptions, but Europe forcing capital outside.
It doesn’t really matter whether we believe US interest rates will rise or not. They are just more likely to rise more than anywhere else right now. And higher interest rates don’t mean a market sell off necessarily. Especially when they are as low as they are at present.
The question I am asking myself is this?…. Where else would I be investing if not in the USA? China, NZ, Australia? No thanks. Europe? No thanks. The UK? No thanks. Japan. Nope.
The U.S. is simply the best of a bad bunch. And this is what the money markets are showing me. I’m simply following the money. The UK has been through a similar stage over the past 12-18 months where fortunes were made by foreign speculators via currency, real estate and stocks. But they are moving out now. Pastures new and I’m betting on where as you know.
US markets are open and my eye is one two key benchmarks: the Dow and the U.S. Dollar.
The Dollar probably needs to retrace a little bit at this stage as it would be healthy for the likely bull market case I have put forward. It’s overstretched against the Yen but there is a broadening formation taking shape at the moment so we could be on the verge of a real breakout, rather than a retrace. The Kiwi and Aussie have been dumped aggressively over the past three weeks following heavy selling of the Roble, Pound Sterling and Euro over the preceding 6 weeks. One observation I’m noting is the recovery in the US Treasuries market. This could be due to inflows from the smaller market cap stocks being sold off as John has demonstrated. But more likely is that we are seeing more and more foreign capital entering the US thus, helping treasuries to rebound, maintain the currency Dollar momentum and very possibly providing strong underpinning to these markets.
US real estate prices are also really starting to take off in key metropolitan areas such as New York, Los Angeles, San Francisco etc. This is another sign of increasing inflows especially as top end transactions are being completed in foreign currencies, most notably Chinese Yuan, Euros and Canadian Dollars.
I would expect most inflows to be invested directly into the largest, most liquid stocks therefore the DOW should prove to be fairly resilient. I expect the Dow to lead from this point onwards and thus the Dow is the key barometer and its currently defending the breakout resistance come support level around 17,100/150. This is key for today obviously.
Gold and silver are yet again being dumped and the nemesis of the PMs is this parasitic Dollar. We are finely balanced here but the Greenback really is the key differentiator. I know it’s not a popular view on this board but I see the Dollar as being the one factor that overthrows the multi-layered, multi-dimensional bear case put forward by John.
Keep an eye on the U.S. treasuries market. The bottom looks to be in. This could start sucking in foreign capital even if you think my stock bull market case is of nothing other than pure fantasy. The Dollar, simply, will not die first. We are seeing the global currency market shifting in front of our very eyes.
Let’s see how the rest of September plays out.
Johnathan, I’ve been reading your ‘contrarian’ view point with interest over the last few posts. Do you have a ‘Stop Loss’ limit on the Dow at all?…if it does start to tank, I mean.
Mercury retrograde starts this week. I am in DOG (inverse Dow) waiting for GDXJ to have a few up days to buy it. Merc Rx has been very good for miners last three cycles with sell offs between them. Hoping to receive 20% gain in GDXJ by October 25.
JS, nice post. This connects some of the dots I was looking at.
Took onboard some Tesco about an hour ago, a little “market-tends-to-overreact” play on a slow time for me as I am a little lightin exposure trading-wise.
the bounce that was and wasnt…lol
fwiw
i understand a popular Elliot Wave analyst late last week predicted that the start of the largest stock market decline in history starts this week
my puetz crash window is 10/2 – 10/11
yes cycles indicate 10/6 but Lindsay and other analysis says to THE TOP IS REALLY IN so
get out now
¿Mc Huge, for instance?
@apanalis
I didnt know HE was an INDICATOR! lol
let me guess: Prechter and company over at Elliott Wave International? Just to put things into perspective, Prechter has been an uber bear since the early 1990’s. Many times he and his crew have called for the start of a multi-year, maybe multi-decade decline that will take the Dow below 1000. Yes, that’s one thousand, not ten thousand.
Inital drop by October 6 will be 1000 dow points
back to april levels, a bounce and then erase 2013 by end of spring next year
The future for gold is physical
“Aram Shishmanian, CEO of the World Gold Council, said:
“The growth of the Shanghai Gold Exchange to become the world’s largest physical gold exchange provides compelling evidence that the future for gold is physical. As the market shifts from west to east, the expansion of strong gold trading hubs in Asia will improve price discovery, liquidity, transparency and efficiency; all of which will transform the landscape of the global gold market. As a major global market, this will enable China to take its rightful place in the world gold market.”
http://www.mineweb.com/mineweb/content/en/mineweb-gold-news?oid=253679&sn=Detail
Gore Vidal brilliantly said: “This is not the United States of America; it is the United States of Amnesia”!!!
It is sad how susceptible to and completely unaware of the MANAGED NARRATIVES that CONTROL YOUR LIVES…you are completely conditioned beings
the dow MUST eventually drop down to at least should inquire of the universe and yourself or wait to lose everything and be food for the bands of wasteland cannibals rising out of the ashes! HA!
3000 – 1990 levels
bear trap definitely set by the bears…
once I recreate my archive that stockcharts deleted without explanation or warning I will post the road to DOW sub 3000
Elvis l saved some of your charts if you like i will try to locate them and post them here?
if you saved as a link and not a screenshot then it wont work – stockcharts is “closing a loophole” in their code that allows a person to archive charts via links. They think they lose contol of billing from that so they just wiped out people who where using bookmarks to archive stuff. fun.
THANKS paul! any screenshots would be helpful if you have em otherwise its ok!
I should have just made a trade book of screen shots. Working off my notes right now
problem is I dont want to recreate everything with stockcharts – want to find a new provider
Btw contact stockcharts they can go back and reload them
they wont respond to my emails AT ALL
I’ve had some technical issues with them in the past where it was clear their I.T people didnt know what they were doing and I think I offended them…ha
SP500 short interest. Sometimes contrarian (green lines), sometimes not (purple lines). Last 2 years sideways in neutral range. So I don’t see this as bullish as some have argued, but nor is it bearish in its current range. Neutral I think:
John, Calpers and all the other pensions are throwing in the towel. Why do they need to hedge anymore? Just buy bonds they say and do better than hedge funds. I have no idea when the liquidations are done — if they redeem now, do the hedge funds wait until the end of the next quarter to liquidate? But this would point to short interest declining, and yet I see it as a bearish signal because everyone is going ALL-IN the bull camp, and there is no one left to buy after the Pensions move it all into equities. And then when equities go down -20% and retired teachers start complaining about the stupidity of wall street, will they then sell stocks in hindsight? Who will buy then?
John, generally hedge funds require 30-45 days prior notice with redemption most commonly being either monthly or quarterly depending on the liquidity of the strategy. So no doubt monies are coming out at the end of September (a combination of both monthly/quarterly redemption requests).
Nice find. Bears are mostly right at beginning of bull to bear cycle transition, and wrong at end. Just as common sense would tell you.
By $NYMO standards, we must be getting pretty oversold here…
that is one chart THEY didnt get! LOL
http://stockcharts.com/h-sc/ui?s=$NYMO&p=D&yr=2&mn=6&dy=0&id=p18415994279&a=367906705&r=1411493563786&cmd=print
Who is “THEY”
you know who THEY are surely!
$NYADV:$NYDEC drops to a region where short term bottom may be imminent while $NYDNV already hooked (down). Shorters be aware.
http://stockcharts.com/h-sc/ui?s=$NYDEC:$NYADV&p=D&yr=4&mn=0&dy=0&id=p59682658303&a=256963881&r=1411494690847&cmd=print
another one THEY didnt get! lol
I’m on a roll@!
reverse the ratio and then note it rising which is bearish – watch the green target line and note symmetries…
I have been following you since your old site and see you transform as well , as always great work and thank you for the gift of your efforts and time.:)
Thank you
john
I have become your ardent follower since 1 year. great work, keep it up. Do you think if market does not crash by October then it is possible that rally will continue until next year May? Why is October has been the month of big corrections. I have never seen crashes during Dec, Jan or Feb. I wonder why it is so?
1969, 1973, 1990 are three examples.
Thanks Praveen. The seasonality of geomagnetism and its influence on human sentiment I believe is the answer. If no falls in October, then I favour a top around 31 Dec.
Elliott posts here are waffle. Now in intermediate 5th of major 5th of Primary 3rd. Clear as day. SPX top target 2085 and rising. Choppy stuff has been intermediate 4th through to choppy minor 1st. Minor 2nd finding its base now, thanks to the no QE speak of Draghi. Expect explosive Minor 3rd probable as the QE parcel is seen to be passed between central banks but reasons come later.
The top of the Primary 3rd brings corrective Primary 4th of 3 to 5 months similar to Primary 2nd. Primary 5th starts 1st Q 2015. Expect similar size and duration as Primary 1st. Only then can a 2-3 year bear market commence.
Elliott is never wrong, only the misguided or biased point proving counting.
John, do you think the presidential cycle will break next year? The third year should be bearish but it is really the seventh year. The counter example I have is the 1907 crash, which was also the third year, second term. Of course there is also 1987 — it seems likely the peak to be 10/2014 or 1/2015 as opposed to 9/2015.
I think the solar cycle overrules.
the AD is getting severely divergent and the T-Theory T ended with a falling VO and
http://stockcharts.com/h-sc/ui?s=$NYUD&p=D&yr=0&mn=11&dy=0&id=p27960962328&a=367854604&r=1411496692324&cmd=print
INDU version – this is why I say the first target before a bounce on DOW is april levels
http://stockcharts.com/h-sc/ui?s=$NYUD&p=D&yr=0&mn=11&dy=0&id=t03790330232&a=367854604&r=1411496815382&cmd=print
clear as day that it is headed to the lower channel
comment is awaiting moderation so I’ll post just this
INDU “Magic T” version – this is why I say the first target before a bounce on DOW is april levels
http://stockcharts.com/h-sc/ui?s=$NYUD&p=D&yr=0&mn=11&dy=0&id=t03790330232&a=367854604&r=1411496815382&cmd=print
clear as day that it is headed to the lower channel
your charting skills are awesome
but my love life sucks!
pomo
Total Par Amt Accepted (mlns) : $1,775
dippers welcome!
clear as day it is heading where? Like in mid-April?
Would it be Ok to ask for people to collect their thoughts so that we do not have 3500 posts per day with 5-10 words in them?
J
Jegersmart, I like that idea!
No
that
my thoughts are collected – just as your fear manifest as directive.
peace be with you
collect your thoughts free of fear, look at the Volume Oscillator projection and the divergence, review where and when other similar setups occurred and you will see that the INDU is headed to the lower keltner band…
this post had more than 10 words I think?
Great work John,it fits like a new pair of jeans..
I m a fan of the the bradley siderograph and this is my view
The bradley made it’s turn on the 18th September and will be (down) till Oktober 8
So there is a big chance that the (first) bottom will be Oktober the 7th.
That also will be 13 day count.. and the decline will stop before full moon like so many this year..
Then thing will be very interesting because the bradley goes up for about 6 days (REBOUND) and then straight down again into november..
The waterfall decline could be till full moon November 6…
When you take a look AT THE BRADLEY 1998 en 2014 there is a big synchronisity.
This was a 20% decline in the DOW and a 40 % in the AEX (Holland) and the DAX.
I don’t see the turn date in September which you referred to:
2014 Bradley Turn Dates List
Most important dates
January 1
July 16
November 20
Other Bradley Turn Dates
January 9
March 22
April 6, April 27
May 6
October 9
October 16
December 10
December 26
these are so called important dates but in the graphic it’s clear that you can see a turn september -oktober..
Let’s see what happens…
John Li,
You may be using Helio Bradley indicator. I believe that Carpedium is using Geo Bradley. Often they give the same turn dates (or close to), but not always. However if you look closely at the data or graph of the Helio Bradley around September 18 you will notice that although it did not change directions, it did change trend considerably almost turning up. Also important are when the Bradley crosses 0 line.
SC
I only measured and verified the statistical significance of the major turn dates, not the 0 mark or the minor turns.
John,
As always, one of the most thoughtful and original analysis. As I has said before, as far as I am concerned your analysis has already been proved correct. Now it’s just a matter of watching how the impact sequences through the global economy and various commodity, real estate, yield, and equity markets. I do believe the US equity capital markets will be the last to dive.
You mentioned that solar science got the estimated solar activity peak wrong (and still might be off). Do you have any opinions on why they were wrong? Let’s hope solar science isn’t as settled as global warming science. In the past you have made mention that one of the solar impactors was JEV alignments. Could that factor into it? Thanks in advance,
SC
Carpedium,
Often wondered, Do you find the Helio or Geo based Bradley better to use, or are the both always giving good signals? Thanks,
SC
Thanks Carpedeum
is rude.
ps – JS, if your literacy weren’t compromised by internet kerfuffle, then you’d see that what I SAID was price is headed to april levels (which match the lower price levels on the keltner bands….
go watch a sitcom bro
l feel any amount of words to a comment is fine,,,,,,,,,,,,
I’m going to contradict myself by writing a very short note: THAT was an ugly close.
It certainly was………..ooooops 🙂
I regret selling my puts at the close.
That 2000 to 2014 sunspot peak-to-peak (Schwabe cycle) could be very significant for climate change. 14 years is significantly longer than the normal (strong) solar cycle average of 11 years, but it is right on the average of Maunder-type weak cycles.
It suggests that the sun is entering a period similar to the Maunder Grand Minimum.
That would mean colder temperatures for the next 80 years…
Click to access icrc0538.pdf
There are better, more accurate, and more detailed papers covering solar trefoils and inertia motion SIM…driving sunspot via angular momentum tweaking of the solar atmosphere. Just gave you some Google keywords…
Hi Mark:
I posted similar information a while back. The newer models suggest that the cold trend should bottom in about 20 years. The first 3-5 years of transition will be chaotic. Lots of precipitation in the wrong spots. Thanks for the PDF.
I think what you posted is important due to the impact on food production. Canada and Brazil will go offline, US decline. China can no longer feed themselves, even using “old” methods. Northern EU and Russia will take a major hit. Persia, the Med and North Africa will bloom again.
Should be interesting.
Please post anything else you find.
Thank you.
Very interesting Earthabides, thanks.
I would also have a concern about food and energy prices.
Do you have a definate timeline for that “first 3-5 years of transition”? Starting around now, perhaps?
Archibald’s views are always worth a read: http://wattsupwiththat.com/2014/05/18/dial-m-for-maunder/
We don’t want another Maunder minimum: http://en.wikipedia.org/wiki/The_General_Crisis
RTH still needs to get below 62
if that happens XRT will drop below the 100ma and the fun really begins
I just noticed the volume on inverse ETF:s since the start of the year:
http://scharts.co/1qrrOqy
This dynamic is new. You could not short (easily) in IRA, 401k etc. Now you can do leveraged inverse ETF. I suspect that John is correct. If this dip is not bought, then the drop may be faster than a speeding bullet.
The inverse ETF volume has persisted indicating that many traders feel the market is ripe for correction and are persisting with the bet.
The contrarian view is that shorts are already in place.
If this dip is not the drop, then it some other dip after. I doubt we will make any more meaningful new highs.
FACT: The amalgamator is not a permabear.
FACT: 1990 Sun went to retrograde angular momentum.
FACT: We breathe 10 to 23rd power number of molecules with each breath. Excited molecules contain photons from the Sun.
FACT: As much as naysayers would like to believe there is no direct connection between the Sun and Humans, I just provided one.
FACT: The 2009 low in sunspots was predicted in 1964.
Edit that- in addition to 2009, 2002, 1995, and 1990, and 1984 and 1977 and 1967 and 1963 all predicted in 1964 to be important solar sunspot years.
Can you elaborate? Not sure why 2009 is important for example, or why 1963 needs to be predicted when it is passed in 1964.
It was predicted (1963) back when other scientists were still not ready to call that point int he cycle to a close.
Thanks wx
FACT: The amalgamator is not a permabear.
Amen, for those who have been with John for years, we can confirm he’s not. He’s merely one of the clearest thinking investors I’ve had the privilege to know (quite aside from whether his calls turn out to be correct or not).
Much appreciated Gary
Andre’
I analyzed Apogee-Perigee to see if there was a recurrent cycle. They seem to go in a 4 year cycle. Every 4 years the perigee comes back to the same date +/- 1 day. A few to +/- 2 days. Although in any year some monthly perigee/apogee’s will hit to the day, while others in the month are off by +/- 1 day. I haven’t spent the time to determine if there is a cycle in the Apogee/Perigee distance, but if there is one I don’t think it is 4 years. Hope you find this info useful, assuming you don’t already know it.
Steve,
The current multi-year lunar cycle turned up early 2010, so it is underway for more than 4,5 years. I look at (apo+peri)/2 to see the average distance.
This cycle is not stable; that’s why I prefer to talk about the 4-something year cycle.
But as we can read the actual cycle from the apo/peri table we don’t have to assume anything.
My only assumption is that we will see 2 minor cycles within one 8.65/9.3 year cycle.
Cheers,
André
Major US markets are yet to confirm this move lower
imv, see what today brings.
I would not become to complacent on the short side,
lots to be decided yet on my take.
too complacent even.
Duncan, mate I am curious as to what makes you such an ardent bull. Certainly the saying goes the trend is your friend, however there are literally so many facts and indicators that point to a top and I am wondering if you have some indicator long term target that I have maybe missed that you talked about previously that has convinced or proves to you that the markets go higher?
TIA
That aside were the markets ever NOT going to at least stall around here. I mean we are at a point where the 3 averages are approaching their 50’s.
“Wash, rinse , repeat”
I vouch for your past positioning and have cited this on occasion.
Allan, I try to stay openminded
and remain currently in cash.
From a bulls perspective this has ripped back and
reversed so many times.
The resilience of this bull market has been incredible.
I was a little surprised by Duncan’s expectation of
an imminent powerful reverse, however would it really surprise
you if this happened?.
The next couple of days look key as to whether this develops
in to something more significant.
Awesome work John. This is the only site I now read! You’ve bought me
Thanks mate. Now I look at my post it looks a little confusing. My question was to Duncan but I actually clicked “reply” to your post.
I do however appreciate your response and I do understand how most like yourself are extremely cautious on the bear side given the continual pounding of bears for three years, but then that is the nature of the beast, to pound all but the very last of the bears into submission.
I just think that given the evidence, most notably the failure of R2K and DAX to make new highs signals a major reversal soon.
The DAX is important because Germany is the powerhouse of high end manufacturing and if it goes nothing the rest of world does will stop it. I don’t think the importance of Germany can be overstated.
The only thing that would change my stance at this point would be higher highs in either of these two.
I agree with you though, the bears definitely need some decent follow through here because the DOW did break above that double top last week and any good upside would bring it back into focus despite price currently being back under.
Maybe we get a re-test of the underside of that break out area and then back down.
I am keeping a very close eye on iy.
Cheers, Phil appreciate your views.
Apologies, appreciate the question was to Duncan,
just a few of my thoughts.
If we see a decent down day of 2/3% on
the DOW/SPX, I may be more convinced
in this move, that may begin to dent sentiment.
No apology needed mate. And I agree, bears severely need to get serious and decisively break some support levels here starting with the 50 dma’s and previous lows. The R2K and NYSE are taking the lead but the big guns need to follow.
Cheers
Margin data out
http://www.nyxdata.com/nysedata/asp/factbook/viewer_edition.asp?mode=table&key=3153&category=8
Which column does John look at?
absolute breadth crosses the BB’s to the upside and that would be a SHORT TERM buy signal or cover shorts
rth needs to go red
right now looks like small bounce and then tank – VO is indicative of this too
http://stockcharts.com/h-sc/ui?s=$NYUD&p=D&yr=0&mn=11&dy=0&id=t11794625575&a=367854604&r=1411568957378&cmd=print
pretty sure the divergences on the AD and various oscillators are not going to let this bounce too far before getting a break of the mid-channel on the Keltner (55,4.0,110).
http://stockcharts.com/h-sc/ui?s=$BPNYA&p=D&yr=0&mn=11&dy=0&id=p06544106151&a=367906801&r=1411572406689&cmd=print
Hints of Eurozone QE, DAX well up on the day,
UKX trading above 6700 atm.
DOW/SPX had not confirmed this move lower
as I mentioned earlier, appreciate it can reverse
again quickly.
Don’t get too complacent folks on the downside
potential, a considerable amount yet to prove
is my take.
Today spike is an obvious bounce as VIX was up 9% over the past couple days. I don’t recall if I have recently seen VIX up 3 days in a row. In the bear case, selling off has to resume tomorrow or Friday to validate the trend imho.
According to Robert R. Prechter, Jr., the current extreme sentiment, optimistic predictions, and a rising US Dollar signal an epic turn ahead. Of course nobody could or has ever predicted exactly when the crash will happen. October 2014? January 2015? April 2015 or September 2015?
“The percentage of bears among advisory services, as tallied by Investors Intelligence, just reached its lowest level of the current bull market: 13.3% This means 86.7% of advisors are bullish on the long-term trend. The percentage of bears hasn’t been lower since 1987, during wave (5) of 3, near the end of the strongest wave in the bull market. That run resolved in the biggest crash since 1929”.
cause of the spike: “China Set To Fire Its Central Bank Head, Unleash The Liquidity Floodgates”
erick, interesting and would tend to agree on tomorrow
or Friday.
RP usually looks like he has the worries of the whole world
on his shoulders.
Phil. Agreed on RP. As far as the crash timing, I personally believe that John’s scenario presents the strongest case, as most of the technical indicators would be invalidated if the markets keep chugging higher into 2015. History rhymes as we all know.
On another note, gold/miners might be in trouble if what RP said is true: “Near term, the Daily Sentiment Index recently recorded only 4% bulls on the euro, so a countertrend bounce against the dollar is in the offing. But long term, the dollar is probably starting a bull market. If the US dollar has started a major rise, all other markets are doomed. Since the stock market has been holding up in the face of the recently strong dollar, it seems likely that when stocks cave, they will play “catch-up” and cave big”.
Just a brief update to whomever has been following my fractal analogy. See previous post: https://solarcycles.net/2014/09/18/us-demographic-peak-of-2000/#comment-29047
NDX underperformed SPX significantly on Mon Sep22 but has subsequently outperformed SPX significantly on Tue and Wed so far this week. Obviously this is cause for some concern because Nasdaq should be creating lower lows in the fractal analogy.
Using the NDX index, I reviewed some of the past key dates and the count of the TDs and here is what I came up with as equivalent dates with regards to establishing relative highs and lows. I start with Oct 9, 2013 since it was a significant key correction low at the time.
Oct9, 2013 = Apr15, 2014 LO
Dec18, 2013 = Jun25, 2014 [+49TD] LO (consolidation low near 52-WK high)
Feb 3, 2014 = Aug 7, 2014 [+30TD] LO
Feb28, 2014 = Sep 3, 2014 [+18TD] HI
Mar13, 2014 = Sep16, 2014 [+9TD] LO
Mar18, 2014 = Sep19, 2014 [+3TD] HI
Mar27, 2014 = Sep30(??), 2014 [+7TD] LO
Is MAR7/2014 = SEP9? [YES IT IS!]
I included the additional count of TDs from the prior date to arrive at the new date. The interesting characteristic that you should observe is that the TD count from the older fractal starting in 2013 matches EXACTLY to the mirror fractal that began from the mid-April low. This is obviously no coincidence if indeed this current trading pattern is merely a fractal from a prior pattern.
What does this mean? On Mar 18, 2014 NDX hit a relative high and consolidated for the next 3 TDs and it declined hard on the 4th TD. The decline actually began on the third TD. Since we have deemed Sep 19 to be the fractally equivalent date of Mar 18, then today Sep 24 is equivalent to the final day of consolidation. As I type NDX has rallied to the top of its range and above yesterday’s high which is cause for concern. But if history is any guide then tomorrow Sep 25 should be a very ugly down day. Friday it likely rallies back slightly but the fractal date count implies further weakness for an equivalent low to occur by Tue Sep 30, 2014. I refined the implied price target to be closer to 3960 for NDX.
The fractal analogy will be proven wrong if there is no significant decline that occurs by Thu or Fri at the latest or if this current rally exceeds the high of this week (Mon Sep 22).
Excellent work Steve T. Big thanks!
thank you Steve – great work!
NASDAQ remains the most ridiculous on the planet and its technical impostation is the better among us indexes. The run will stop only after a blow off top. Probably on new all time highs over 2000 superbubble.
don’t forget
sell rosh hashanah (sunset tonight)
buy yom kippur (10/3 sunset)
puetz crash window 10/2 – 10/11
banned by elvis: Would you care to explain your handle? I want to compliment you on your chart wizardry. You surely do know how to look at what seems important!
I am the only elvis impersonator to actually have an injunction enforced against him by THE KING’s estate…
just kidding –
it has to do with another blog and the fact that I was known as “elvis” there once and then I banned myself from there and then I came back but I could come back as elvis as I said he would never return and had left the tent!
if any of that makes any sense to you (in spite of being true) you need to up your meds! roflol
you were a bear in those days to Elvis.
How you guys stay afloat is beyond me.
im not always in a single trade or in a trade for more than a week or so – this should have come apart in 2011 but that doesnt mean your dont trade the cycles, net lines and breadth indicators…
that’s how ELVIS LIVES! lol
Steve T.: agreed, plus moon enters scorpio at 6:29AM Friday. Moon in Scorpio
= doom (or at least 1 to 2% down with 85% confidence, IMO). BTW I just completed a study of “void moons”, where the moon is between signs for the year 2005(year chosen randomly):
Results: 59 void moons during trading days
20 down days
26 flat days
13 up days
Return for the year on void moon days -6%.
Return for the year all days 3.5%
Return for year if out of market on void moon days 9.5%
If anyone has any inputs on void moons and there effect on market performance please share.
Just bought PSQ (inverse QQQ) to profit from tomorrow and/or Fridays big sell off!
Looks like we are setting up for a H/S pattern with SPX RS at 2011 around EOM, now with DB at 1978. Likely this will be fakeout (bear trap) with low around 1950 Oct 8-9 with final rally to 2050 2nd half of Oct (anytime OpEx to FOMC).
As I noted before the Dow spent all friday above the upper 20,2 BB.
If history continues to be a guide, today’s action on day three after that event leaves room for each of the following types of historic (since 2007) results: Either the Dow is going to continue its bull market as soon as next week or the index will move up and down in a small trading range for two to six weeks before a deeper correction, maybe even after slightly higher highs.
For both alternatives the downmove this week was within the range of historical precedents after identical BB-events. No thrilling myths nor cycles, just simple and sober historic retrospective.
Steve: Joyce Wehrmann in her book called “Winning” claims that if your natal chart shows ‘void of course’ you will lose.
Back in the day she rectified my natal chart. BTW, I don’t believe in the personal side of astrology.
http://www.astro.com/astro-databank/Wehrmann,_Joyce
http://majormarketmovements.com/shemitah-year/
I believe that the market already topped exactly 7 days before the Shemitah, on Thursday September 18. More likely the waterfall sell-off will begin as soon as Thursday October 2, exactly 7 days after the Shemitah.
Hmmm…3 down days in a row only to have 1 up day reclaim most of the losses. Nothing new here, same signature of this bull, bounce off the bottom and work up. Buy the dips as they say. If we are changing trend, like John has said, I would expect the new bear to work the opposite – as he has mentioned waterfalls with small bullish bounces, less than half the move is reclaimed. I agree with the other posters, let’s see what happens Thursday and Friday. Needs to move through some MAs to really be onto something…
RTH huge day but only closed the gap from three days ago – XRT closed the gap but the price structure is very dissimilar.
crazy stuff. Most all the other indicators have vast distences to cover to signal green but the market acted today like internals didnt matter – very dangerous I think but the numbers short term are in the favor of the bulls…
You are crazy, this market cannot go down as central banks all over the world are printing lots and lots of money. Some central banks are even buying stocks. It looks like we’ll have another very strong rally to end the year. I will probably buy calls again on the QQQ and short more GDX and GDXJ.
Nicolas – keep your rude comments to yourself.
P i second ur post.
The spike today looks quite suspicious. Major intervention by the Fed it seems, since the markets were held remarkably strong during the last hour. However, both SPY and XIV show a rising bearish wedge that they fell out of. MACD is still quite bearish.
I still believe that the reversal will be quite epic and it may start as soon as tomorrow. September reversal should be imminent as a prelude to the epic sell-off in October.
increasing volatility – in both directions- keeps the 1929 analog alive. Waterfall selling in a month time. Not the time to give up shorts despite marginal new highs in biotech today. Animal spirits are alive and well. Ready for musical chairs. Keynes would have thrived in this environment. Or not.
http://www.macrotrends.net/1319/dow-jones-100-year-historical-chart
Ck out following years on the above chart for doom and gloom. Every 7 years there is a substantial correction in the djia:
now to 2015…
2007 to 8
2000 to 1
1993 to 4
1986 to 7
1979 to 80
1972 to 1973
1965 to 1966
1957 to 1958
1950 to 1951
1943 to 1944
1937 to 1938
1930 to 1931
1923 to 1924
In all of these time periods there was a major correction that was followed by a substantial rally. The 7 year cycle lives!
Steve, at a glance the above is highly correlated
with US recessions which occur approximately
every 7 years, 87′ being an exception.
I would need to cross reference with a chart on
US recessions for confirmation.
Mark and Steve:
You both touched on the coming cooling. Good stuff. Mark, I believe that last year was the intro, and this coming winter is the confirmation of the trend change. The next few years should be the most chaotic until northern waters freeze. At that point, it should get colder but dryer. With the coming increase in cosmic rays, I have to wait to see what type of cloud cover/precipitation plays out in the southern hemisphere. Also, increased volcanic activity seems to be associated with these periods. However, most of North America and Eurasia should be dryer.
Note, China is going to fry.
OT. Being a bit slow, how do I post a graph? Had a nice one correlating Neutrons vs SIDC SSN.
Thanks.
Fascinating!
I’d also recommend reading the link posted by rp1 in the comments above – wars; social, economic, political breakdown; demographic decline; high precious metals prices; between 1618 and 1648 (during the Maunder Minimum). And I would add speculative mania to that list – the Dutch Tulip Bubble was in 1637.
It wasn’t all bad though – music from northern Italy c1618: http://www.youtube.com/watch?v=lnisMPOQ6-o
Earthabides – John has mentioned in the past that he will consider posting a relevant graph if you email it to him.
DAX well ahead again, Gold down.
This needs to reverse from about here
or it’s just a continuation of the previous
very well worn bullish path imv.
Perhaps it will rally Phil but Im thinking this may be dare i say it a bull trap based on my analysis.
cant believe how excited u all start to get with the tiniest of moves, nasdaq didn’t even move out of its trading range
Thanks all. New post is out.
To post a chart from the net into the comments, put a link to it on its own line and it should display the pic. If you have a chart of your own with no web link then email it to me and I can upload it into the site to display it.