

No real up move in equities into the new moon / end of lunar positive period, but US indices have potentially carved out a rounded bottom the last couple of weeks.
The Nikkei still remains unresolved, having broken up out of the smaller wedge but been contained in the larger triangle:

Commodities pulled back overall, particularly precious metals, as the US dollar mustered a rally. Gold and silver were at some point going to take a break after a 20%+ rise off the lows, so it’s what happens next that’s important.
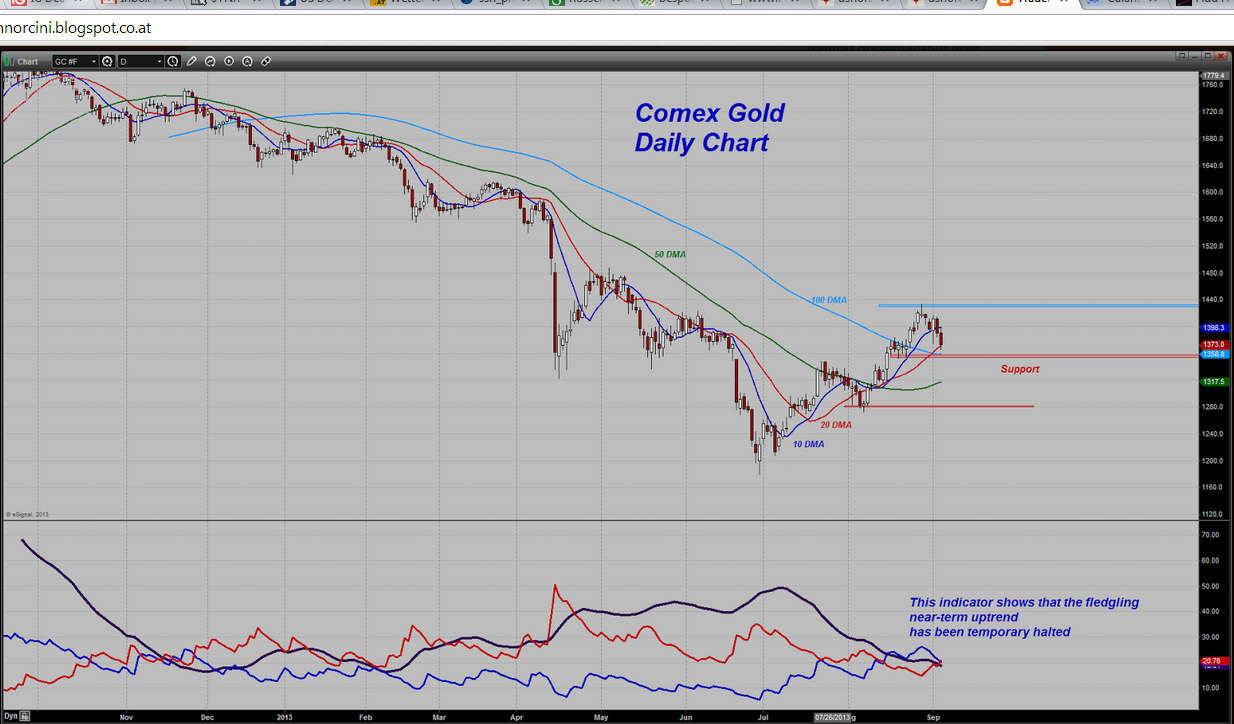
Source: Trader Dan
My target on gold and silver remains a retest of the breakdown – on gold this would be the 1450-1550 area. I would then take half profits. So, I am looking for gold to make a higher low and continue the uptrend in due course.
The US dollar is at an important juncture. A breakdown would fit with a commodities rally. A break-up could be enabled by tapering.
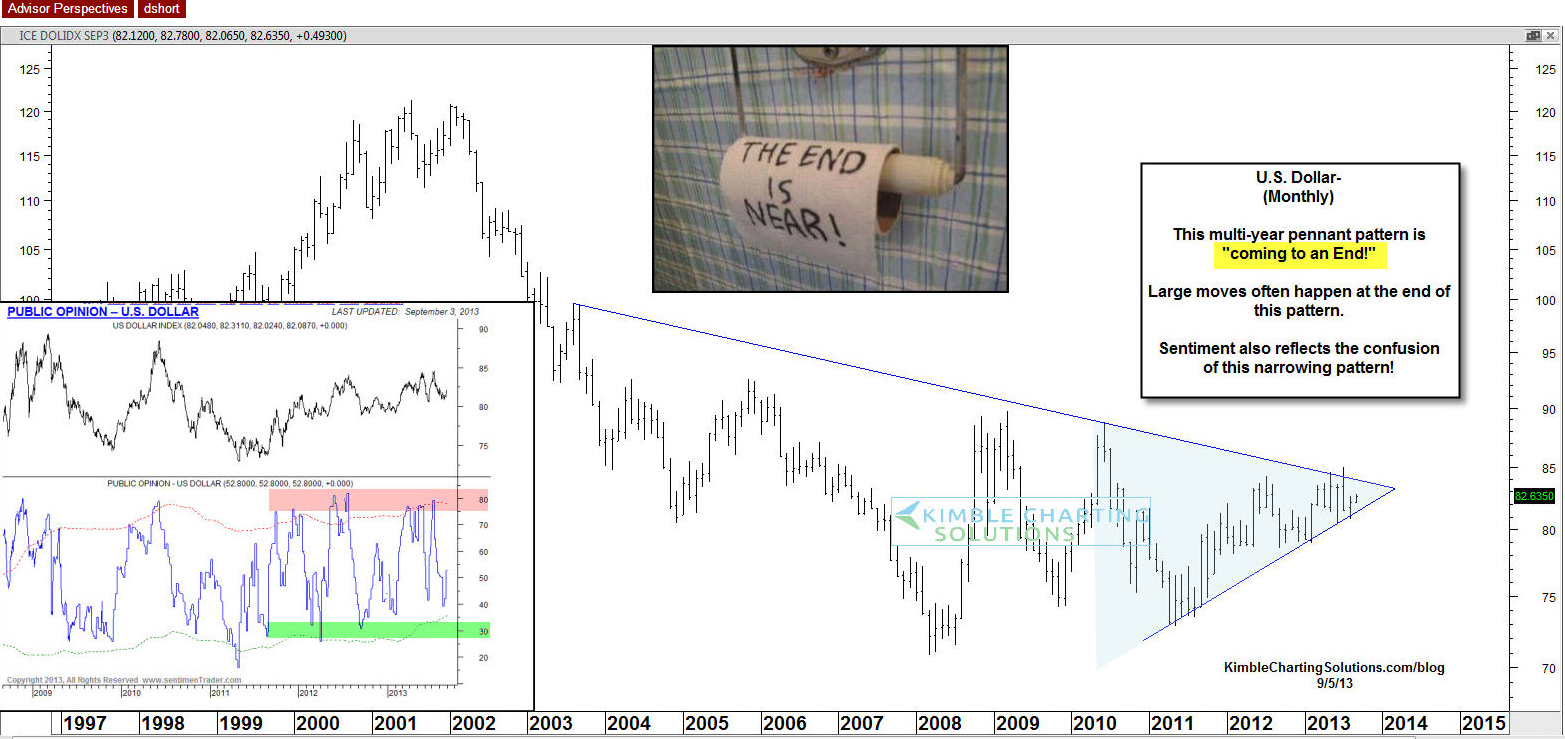
Source: Chris Kimble
Syria action and Sep 18 FOMC expectations are going to remain in play next week.
Regarding prospects for September tapering, the economic data has been overall good. Here the latest ISM composite for the US.
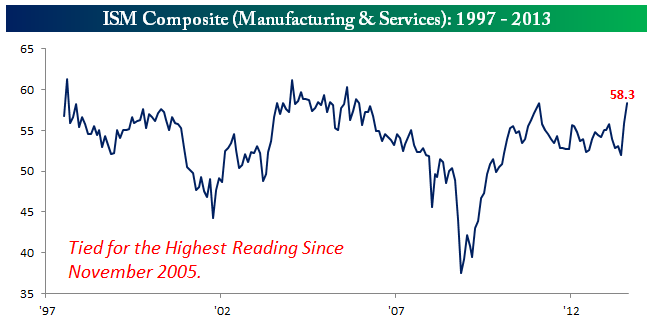
Source: Bespoke
Global composite manufacturing and service PMIs also came in overall very healthy this last month.
 Source: Markit
Although there remains the divergence between developed and emerging economies.
A stronger US economy and increased expectations for tapering have continued to push up treasury yields, with the next chart showing the possible eventual target of 3.5-4% yields:
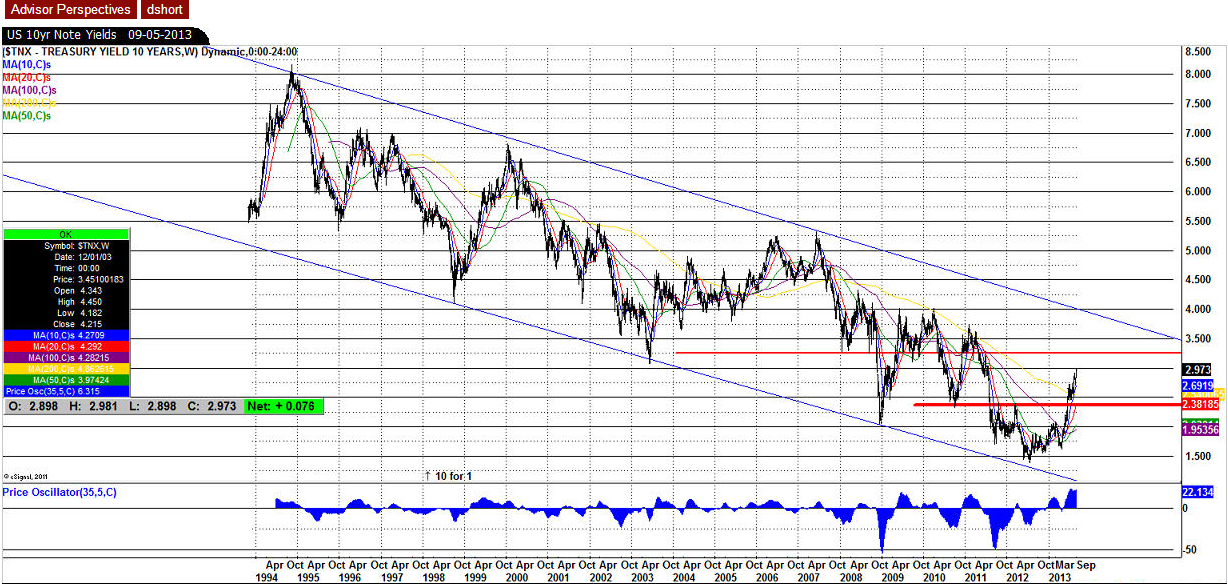 Source: D Short
Russell Napier’s stock market history work states that cyclical bulls have typically ended with the over tightening of yields together with excessive inflation. Yields may still be low by historic norms, but they have doubled from the lows in the last 4 months and we should not expect historically normal higher yields in the current environment of high debt and negative demographics. So, this doubling has been bad for the housing sector and other interest-sensitive groups. Excessive inflation has not yet materialised, and the fortunes of oil are key to this. It still looks technically strong and has the 2011 highs within its reaches, so that missing problematic inflation may arrive.
The key is “excessive” inflation and “overtightening” of yields, i.e. it has to be set against the economy. A strengthening economy can cope with higher yields and higher inflation, but not if it starts to weaken or if the latter two rise too far too fast. Moneymovesmarkets still see evidence in global narrow money for a turn down economically by the end of the year. This may provide the window over the next couple of months for commodities to gain momentum, we shall see.
Playing in to that is the solar cycle. Here is the latest NASA forecast, and they are sticking with a summer peak. For a higher smoothed max we would need to see a rapid uplift in sunspots now, but that depends if their forecast is more accurate than SIDC’s, so let’s see.
 Source: NASA

Initiated a position in Fannie & Freddie equity. A pot of gold under the house of cards…
FNM and FRE equity? “0” value, you’ll only make money on PURE speculation via pump and dump by the HFTs (even the preferreds are unlikely to have any value down the road but the common has no chance).
=). Really. Why do you think there is no value?
And what is your problem with HTF?
I bought the Prefs at 0.5 cents and people said the same thing… Do your HOMEWORK.
re previous thread
predictions and trading is not the same 🙂
regarding cycles
the tidal cycle for the Sun has a top around Sept 10. So far sunspots are weak, and this tidal top is the weakest in many years. So perhaps sunspots will stay weak during this 4month cycle. If so, the sunspot cycle seems to be breaking down from its platou… so solar max is behind us.
My 6month cycle in markets (correlating with solar wind cycle) is topping this week, and the markets normally top +/- 1 week. SPX topped allready many weeks ago, setting up a potentially bearish left translated wave.
SPX is very close to trigger some very good buy signals, but is at a crossroads today Friday. If we rally to 1670, we get projections of a next top early October.
But if we sell of, we could see a low in 1-2 weeks around 1570 and the June lows.
Thanks Jan
John,
I have never commented as my market knowledge is extremely limited and I’ve never felt I have anything to offer. I have been reading you since/near the beginning from a Nadeem Walayat (The Market Oracle) link. I pretty much read every post and all comments and continually garner valuable insights which strengthen my investment confidence and success. So, great thanks to you (and other contributors) for the insight you have offered without charge. If Karma is reality I can only think your cosmic bank account to be quite content.
That said, I have been selling good gain positions through the late summer but am still of the belief that a second top lies ahead and so am holding other positions with limited trepidation until they reach my targets or my thinking changes.
Again, many thanks for all you do,
geopark
PS If you and your family ever wish to travel to southern California I have a vacation home in the Palm Springs area where you would be welcome to stay.
Many thanks George!
I mainly post this for those energy minded investors where Atlantic hurricanes mess with prices…
http://www.reuters.com/article/2013/09/07/us-weather-hurricanes-idUSBRE9860AY20130907
2013-1851=162 162 / 17 years = 9.529411764705882 years. Fairly close to average solar cycle? Given how steering winds are impacted by the cycle, no surprise.
Thanks wxguru
John
Have looked at our sunspot cycle, and the tidal cycle.
As we have a very weak tidal peak this fall (Sept), I get a very strong bias for weak sunspots the rest of the year (or at least until ~Dec).
Sometimes the Sun does “strange” things relative to the tidal cycle, but mostly the correlation works fine. So if the Sun doesnt surprise us, there will be little sunspots this fall.
Looking at the bigger picture, it is getting clearer that the sunspot maximum is behind us. I see three peaks in sunspots, in 2011, 2012 and 2013.
Normally either the tops in 2012 or 2013 should have been the maximum, however something strange happened in 2011, probably making it the maximum.
There is still a strong tidal cycle in January 2014 that probably will result in another sunspot peak, but very unlikely a solar maximum.
Thanks Jan. That Jan peak would align with SIDC’s second option. Guess we won’t know for sure until after that.
Do you have a graph of this Jan? Would be interesting to see. Many thanks.
http://oceanservice.noaa.gov/education/kits/tides/media/supp_tide07a.html
Your definition please?
Eclectic
was that a question to me?
If so… the tidal cycle on the Sun that I speek of, is the cycle of planetary tidal forces on the SUN. Mainly by Venus and Jupiter, but also significant from Earth and Mercury.
The simplyfied version is Venus-Jupiter only, and the ~118CD cycle between heliocentric conjunction and opposition
JAn 🙂
There’s a difference between the “official” inflation rate, and the real inflation rate. Just ask any middle income family about thier cost of living from the supermarket to heating the house. 😉
BTW, I just posted a basic cycle analysis that you and your readers may enjoy, and everyone’s invited to comment!!!
Thanks HighRev
John,
I follow your call very closely. I would like to see what kind of time line you are looking at. I follow cobras chart and lot of other astro guys. So to make sure we understand your thought process you think
GLD,SLV and commodities will be running higher by dec 31st.
SP500 will be down by dec31st. Do you think it will be a 15 to 20 percent pullback or start of new bear market.
In other words whats your timeline and expectation.
Thanks Bill. Equities to complete topping process Autumn 2013, so by Dec 31st new cyclical bear already in progress, commodities peak early 2014. Equities cyclical bear to last most of 2014. All subject to incremental evidence of course, i.e. commodities to sustain momentum rises, leading indicators to topple over, more topping ‘internals’ on equities coming to light.
Still very skeptical on GLD from a prediction stand point. We had a major break so think it would be natural for a regular AB correction down to 100 and the HS that was formed during 2008. Would need a lot of push in the market for a reversal from here without some type of bottom pattern. But it depends what system you are trading ;). You can be bullish or bearish on it all and still make money ;). No need to be right.
John, is there a chance we continue in to 2014 and the bear shows up then? How would your scenarios look then? Kind regards Rob
If equities break up and out again and internals support, and leading indicators continue to show strength (which I guess would imply central banks have done enough to offset demographics sufficiently), and the solar cycle max already occurred in Feb 2012, then yes continue up into 2014. I am of course open to it if those features fall into place.
Regarding gold I think bull or bear it would be fairly normal for it to backtest the breakdown area, before either failing decisively or building energy and breaking back up. Hence I am looking to exit half positions at that point, if we get there.
Paulson cut his gold position by 50% in the summer. Would not touch it before we break to new highs unless I see a clear bottom pattern. Bet 150 this year but I think we may also then get 100 after that =).
Robert
Allthough not updated recently, this page shows what one needs to know about the sunspotcycle
http://www.sibet.org/solar/index.html
Let me know if you have any additional requests 🙂
This is an update of Solar flux versus tidal cycle.
I have also added an appropriate wavelet indicator (for solar flux) in black that corresponds with the tidal peaks (except one).
The wavelet indicator is kind of a momentum indicator, and therefore leads the solar flux peaks.
and this is my latest pattern recognition in monthly sunspot number. It corresponds well with the projections from planetary cycles that suggested a solar max around September 2013

Updated for August 2013:
All models updated this morning. Sunspots currently weak, and geomagnetic trend still has a downward bias looking out to the end of Sept.
When the bombs flew in Iraq 1 and 2 it marked significant highs in oil and significant lows in the stock mkt. Previously, oil had already rallied in the buildup to war , corrected and rallied partially back to the high and was then smashed when the bombs flew. In both cases, oil went from $20-25 to $40 and back again. So, was this peace initiative the correction before the missles actually fly or equivalent to the invasion? But either way, oil should have already seen its high.
Do not think there will be a war. The Russian’s let the US exit gracefully. Not for now at least but what do I know.
Iraq 1 and 2 plus Afghanistan have made us war weary. The only thing that makes sense to me 1. Putin is ropa doping Obama, or maybe they FEAR us bombing Syria into submission just like Kosovo.
Kent: What I meant is that good if they can solve the issue without starting WWIII or something. Russians probably fear as little as Americans when push comes to shove. Both have enough hardware to destroy the world several times over. But the solution that came up does neither make the US or Russia look weak and it can be solved without bombing so maybe we do not have a war – also sunspots are not that active… Arms stocks are going up so probably good to follow, probably says more about what is going on unfortunately.
Hi Kent,
I agree with you
And…. not but… if everybody else agrees,maybe thats the time to do the opposite
BUY oil.
bobc
Most of what I said is just factual.
Jan, I checked out your website. I did not realize your technical expertise on this subject were over my head. But I waned to say thank you for answering the question. Cheers.