
Latest OECD leading indicator updates show a healthy picture globally. Emerging markets continue to trail advanced economies but the picture is improving for them. Macro economic data for China yesterday beat expectations and Chinese, Indian and Brazilian stock indices have all risen sharply in the last couple of weeks. Rather than advanced economies joining emerging economies in weakness, we have been seeing the opposite, with emerging markets beginning to join advanced economies in strength. This should continue forwards as evidenced in the overall G7+E7 narrow money leading indicator picture no longer showing weakening around year end:
 Source: Moneymovesmarkets
Which brings me to the big question of whether central banks can offset negative demographic trends in the advanced economies, and this is the subject of a new paper from the IMF (click HERE to read, hat tip Gary). They conclude that demographics do indeed affect unemployment and inflation and central bank policy therefore has to be more aggressive and more unorthodox to offset this. Holding rates at zero and running large QE programmes could be deemed aggressive (in the former) and unorthodox (in the latter). If these actions and collective central bank actions across the globe have offset demographics ‘enough’ then we ought to see enduring strength in coincident and leading data. Regarding coincident data, US economic surprises have broken upwards and are strong positive (whilst emerging markets have been steadily rising and are now just beneath zero). This picture could provide the grounds for a reduction in QE at next week’s FOMC output.
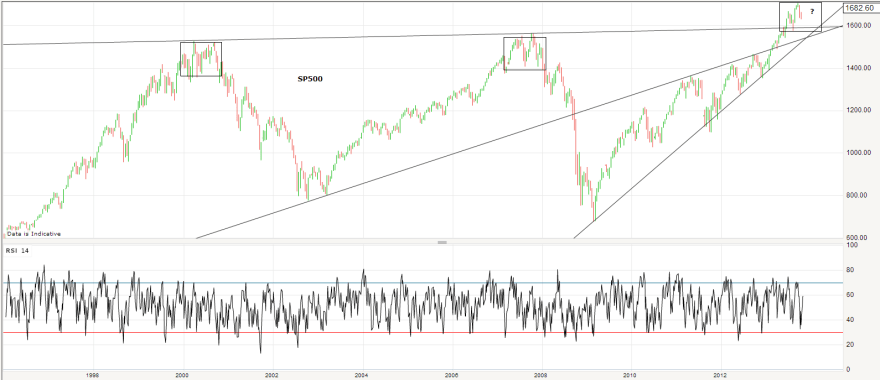
If the Fed tapers, then we could see precious metals further punctured, the US dollar rise, and treasury yields jump further. The twin threats to the economy are rising yields and rising commodity prices, particularly oil. Yesterday the softer line on Syria produced a pullback in oil and precious metals, however the recent evidence has been for a shift in outperformance towards commodities and emerging markets, which would be in line with a cyclical topping process in equities. If I am correct about the cyclical top in progress, then we should see commodities quickly come back, regardless of Syria, and energy stocks and materials stocks lead the way in this new leg up in stocks. Below I show the SP500 and the last two cyclical bull topping processes. The new upleg we are seeing now in stocks should be contained within the boxed range, if this is a top.
Meanwhile on gold, the GLD ETF shows a fairly tidy picture. Either gold has been turned away at resistance in a continued declining trend, or it is shaping up for an inverse head and shoulder pattern with an obvious horiztontal support. Resolution one way or the other should occur soon.
 Source: Stockcharts
The Nasdaq has broken out and the Dax is flirting with new highs. Marginal new highs would befit a topping process, breakaway would not. I still give higher probability to an overall multi-month topping process due to evidence recently presented (such as breadth divergence, transfer to late cyclicals, technical shaping), however if leading indicators stay strong and early cyclicals regain momentum or other such developments, then I would be open to cyclical bull continuation. However, I maintain that rising yields and/or escalating commodity prices are more-potent-than-usual threats to the global economy due to the particular demographic-related fragility. Strong leading and coincident data as we are seeing can push up yields and commodities, and this is what I expect to continue. Neither have risen enough so far to put the economy at tipping point.
Trading-wise I am sat on my hands at the moment. I await to see whether oil and gold can resume advances following yesterday’s puncturing. I believe equities can rise further towards the top of the range so do not yet want to take long profits or add to short positions. I await the FOMC output next week and more importantly the market’s reaction. I am also watching the US dollar for resolution.

John, would it be possible to get some info on the solar peak study you have done in terms of standard deviation with years and peak or is it on the spot from historical data i.e. I know lunatic trader did something on this but unsure how clear it was. I mean the cyclical peak will come but the is it totally aligned with the solar peak or is there a standard deviation? I am more and more leaning towards consolidation and that we move further quite aggressively and then have a larger retracement back to were we are now before we get into the new bull market. Kind regards and thanks for your great posts.
Hi Robert, normally within 6 months of the solar peak.
Makes sense to include this graph always in the analysis… http://research.stlouisfed.org/fredgraph.png?g=f14
Robert
I will give you feedback on the solar max versus market top
The problem lies in defining solar maximum. One can use the top of a moving average, but sunspots or flux? Or perhaps the shifting og magnetic poles.
My approach will be using a wavelet transform on monthly sunspot data. it will define the moment where the “momentum” of the sunspot cycle is at maximum. Then I will compare the market tops relative to this. And a special focus on the weaker solar cycles.
I have allready presented some work on this, and as I can recall the avreage projection suggested a market top before the summer, and a possible double top this fall.
Or in other words a ~6 month range ending this fall. When looking at SPX the range may be morphed into a rising wedge (rising range)
But I´ll check some statistics and what kind of extremes we have had
JAn 🙂
this approach because the official solar maximum based on a 13 month smoothed sunspot number is a poor definition. First one cannot define a solar maximum before long time after, and sometimes one can get two alternative dates for maximum.
However the “momentum” approach will probably give one destinct date, and the momentum tops much earlier than the actual sunspot cycle, giving us much more time to prepare.
A first visual observation of the sunpot data shows that mostly the correlation works, meaning that there is some kind a bearmarket around/after solar maximum. But bearmarkets are frequent, so no surprise that we find bearmarkets around a solar maximum. Need to see some convincing statistical data that support it.
Looking at the cycles, I see that for example the ~1990 bearmarket was very mild in DOW, but in other markets (like Norway) it was a severe bear market. So perhaps I should look at both DOW and FTSE (must chech what kind of historical data I have)
Looking back further, there may be some “trouble” around year 1860 and 1820-1830 for DOW… but that is just visual… must check the data 🙂
hmm, have looked a bit on the data, and I think I will do some various approaches: market versus official solar max, momentum max… and find a couple other markers. And compare these to see which one that works best.
At first glance there is quite a bit variation around the solar max – market can top out either before or after…
Good rally in commodities coming? The first phase of major bear markets are frequently 2.5 years, 30 months. Stock mkt Sep 3, 1929 to Feb 27, 1932, gold Jan 1980 to Jun 1982. Well, the CRB peaked in May 2011; therefore, next month is the 30th. Coincidentally, Oct 9th is the final low before the 60 yeat cycle had its final run to its final high on April 19, 1954. The CRB actually peaked in late 1951, and fell 20% over the next 2 years and then stayed remarkably stable until 1972. The rally here is based on Gann Global Financials index. I guess the difference is which commodities are included and how they are weighted. But with Europe, Japan, China, and the US all improving, it certainly makes sense. And as John has indicated, the commodities are the last to peak.
Robert
Thank you for motivating me to do another analysis of the sunspotcycle. Have found many interesting new things, that I will keep for my own forum members. But I can sum up some preliminary conclusions.
The 13 month smoothed sunspot number seems to be a good indicator after all. It correlates well with the “momentum” indicator, allthough the momentum indicator seems to be somewhat better.
Current sunspot cycle 24 has a smoothed sunspot maximum in March 2012, and a lower top in Nov 2012. This lower top, together with my cycle work, gives a very strong bias that the solar maximum IS March 2012.
Looking at the correlation with DOW monthly, the average market return has pretty much the same shape in the 1800s and 1900s, suggesting weaker return around/after solar maximum. But going a bit more in-depth shows that the correlations are more consistent after ~1890 and up to today.
Of 19 analysed sunspot cycles, there are three where I cant find a distinct bear market around solar maximum (1816, 1829 and 1860). And two bearmarkets came very late relative to the solar maximum (1850 and 1870).
The rest (14 of 19) has bullmarket tops in the range 20 months before to 20 months after solar maximum. That is a wide range of 40 months, and the bull market tops are in generral an ATH or close to it.
The bull market tops cluster in two groups
-an early top about 0-20 months before solar maximum (9 case)
-a late top 13-21 months after solar maximum (5 case)
Current bull market top is July 2013, which is 16 months after solar maximum. And we are at an ATH.
So if this market/sunspot cycle shows a normal behaviour, the bullmarket top was in July, or it can be as late as around December 2013 (21 months after solar maximum)
from this we can also see that the 2011 top was a potential bull market top (11 months beafore solar maximum), BUT is was not an ATH.
Cyclical bull markets dont always make an ATH, but most do.
So when we didnt get a bearmarket after the 2011-top, the bias was for a top in mid/late 2013 (now that we know where the solar maximum is)
I think I will define 1819 and 1830 as cyclical bull market tops, leaving only 1860 as the exception… where a depression managed to cancel the rally from a new sunspot cycle, and thus “inverting” that cycle.
I also think I will define another mechanism, explaining ~1860
I will define 1847 as a cyclical bull market top, and what happened from ~1853-1860 was a mid-cycle collapse.
There are other setups for a mid-cycle collapse that were avoided, around years 1812, 1904, 1922, 1974 and 2008. These could have turned into depressions and thus inverting the cycle. But instead the market managed to avoid the collapse. Have to examine this closer…
the next step will be to examine what kind of bear markets to expect at solar maximum (depth, length) and where it is safe to get bullish.
I would also like to check other markets, like FTSE and commodities, but I dont have any good long data series. If anyone can provide me this, please email me. You find my adress on my site http://www.sibet.org
btw John said the bull market tops were ~6 months after solar maximum. My average says 4 months
HOWEVER no bullmarket topped at 2-13 months, so using an average will mislead.
The tops cluster as I wrote, either before or well after a solar maximum 🙂
Thanks for this Jan. It was a very interesting read. How can we be sure that the solar peak is actually in? Can we have several peaks? Kind regards, Robert
anything can happen Robert 🙂
We have two peaks now, which is pretty common. Double tops in the sunspot cycle (13 month smoothed) are often spaced by up to ~2 years, so this second lower peak could suddenly spike up wildly at the next major tidal peak in January, and produce a higher second top.
my work says no no no, wont happen… but only time can tell 🙂
Very interesting. Why does your work say it can not happen? You mean that it did not happen in the past? Did not follow that correctly. Many thanks
The DOW Jones Industrial has a nice HS in so question is if we go down next week… The QQQ had it earlier this year and we squeezed through. SPY can probably test old highs but maybe we get a double top in but looks like a cup with handle too. I do not like the upward gap. Statistically it often gets filled but recently mostly applies to downward gaps and do not see a real topping pattern. QQQ looks in a wedge on its way to break up higher. Just drunken predictive thoughts without any system =). If you trade chart patterns then trade the same pattern day in and day out =). I want to see more craziness before we have a real top i.e. vertical spikes and “new normal” articles. =).
“When the market starts to rise, there is widespread disbelief that a bull market has begun… The old trader told the young trader… we are in a bull market you know…These words [bullish, bearish] are not in my vocabulary because I believe they can create an emotional mind-set of a specific market direction in a speculators mind. I came to learn that even when one is properly bearish at the very beginning of a bear market it is not well to begin selling in bulk until there is no danger of the engine back-firing. The best tipster was always the tape.”, Jessie Livermore.
http://www.dacharts.com/articles2/_Quotes_by_Jesse_Livermore.htm
Trade YOUR System.
Thanks for your research Jan. I will give my thoughts on this in my next post.
Robert
The sunspot cycle gets its energy from the Sun-planet system. The gravity from the big planets makes the Sun wobble when seen from outside the solar system. Depending on how the planets are alligned, this wobble changes.
A change in wobble causes a change in the flow on the Sun, and one of the effects is sunspots.
However the cycles in solar tides can force the sunspot cycle to be out of phase with the energy-cycle, giving us weak sunspot cycles when there is less energy.
This solar cycle 24 is out of phase with the energy-cycle. This means we have a Gleissberg low, and weak sunspots.
The current situation is that the energy cycle could have allowed a solar maximum as late as Sept-Oct 2013, but beyond that has not happened before according to my data.
However the tidal cycle is very weak this fall, not allowing any solar maximum.
There is a strong tidal cycle in January, but at that point my energy cycle has got much weaker.
So stretching the cycles and historical data, could allow a solar maximum this winter.
BUT a solar maximum is defined by the 13 month smoothed number, and with weak numbers this fall… it is very very unlikely that a couple months surge this winter could produce a higher 13month MA than 2012.
So Id say it is 99% certain that solar maximum was in 2012
And we can be 100% sure in Feb-March 2014
there is a third element in the sunspot cycle, and it is about timing
The sunspot cycle is an oscillation, and whne it first has started, it will have to complete, whatever energy/wobble and tides.
So the critical point is about timing – what makes/allows the next oscillation begin?
When we know the starting point, we have the initial conditions for the sunspot cycle, and can thus predict how it will evolve.
But timing is tricky
-first the previos oscillation/sunspot cycle has to die or reach a low critical level
-and there must be forces/cycles that can trigger the next cycle
My work suggest that the most interesting part lies in when the old cycles dies. Certain cycles have the ability to prolong a sunspot cycle, and as long it is prolonged, a new sunspot cycle cannot start.
But when the old one is too weak, there will begin to be a “vacuum” that need little to trigger the next oscillation.
My cycles say that this SC24 will be prolonged… a long slow dying cycle.
Thanks Jan! Interesting stuff.
One thing that is dangerous with all this even if you pin point the peak is that even though the “stretch” before or after the solar peak historically has been a certain amount of time and there is average standard deveation. There is no way to say that it will not be longer or shorter this time. Keep that in mind and keep your eyes on the tape.
This table John has made is important to keep in mind… Buy at max yielded 100% return several times… Was there anything particular with these solar maxes?