

In Martin Pring’s work on the business cycle he proposes that bonds top first, then stocks, then commodities. Here is an illustration (click to view better):
 I am of the conviction that bonds began to top last year, with momentum having taken hold the last 6 weeks. Here are US, UK, German and Japanese 10 year government bond yields:

Source: Bloomberg
Equities have made a steep rally over the last 12 months which echoes previous cyclical bull terminal runs:
 Source: MSCI
The trajectory and the duration suggest stocks should be due to top soon, however it is usual for a topping process to unfold over several months:
 Such a process usually unfolds with negative divergence warning signs. We have one current divergence in the geomagnetic model:
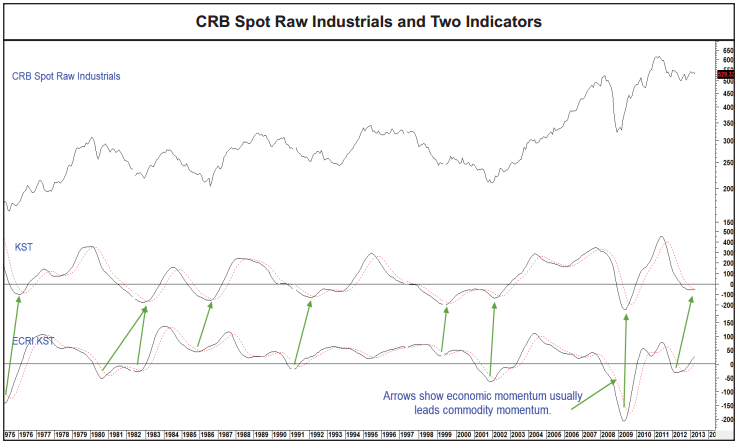
 Meanwhile, bond yields should continue to rise and commodities should attract momentum. ECRI leading indicators have historically given rise to commodity price action with a lag, and the LEI strength over the last 12 months should now turn commodities upwards:
 Source: M Pring
We see crude oil once again making an attempt to break upwards out of its long term coiling or triangle, with the support of an inverted head and shoulders pattern:
 And mid-June is a historic take-off point for gold:
 Source: Zealllc
By Russell Napier’s work, cyclical bulls in stocks historically end with yields rising and inflation troublesome. I see this as a fit with Pring’s work and my own, namely that we see equities rising, then yields and velocity, commodities become a beneficiary until inflation and yields start to tip leading indicators over and money exits equities, with commodities late cyclicals often rising into a peak once the business cycle has started to turn down. This, collectively, is the historic norm, and I believe we will see a repeat here, but it’s a question of timings.
I believe we are at the start of a multi-month topping process in equities, that commodities are from here going to be the momentum class, and that money should continue to exit bonds. However, we do not yet see rising inflation and we only have 6 weeks momentum out of bonds, which suggests the whole process should take some time yet.
A look at the equally weighted commodities index reveals that commodities prices are still elevated, and a momentum rally of 25% (red line) off a typical W-base would take us close again to record highs:
 Source: MRCI
That would ensure the missing inflation, but I suggest we may need one or more triggers to held generate such a move into commodities. I can only guess at such trigggers. One could be if crude oil can break out this time – as crude is an input in agricultural commodities and an important inflation driver, it could inspire price rises in both softs and gold. Another is the June 19 FOMC output, either sticking to or scaling back QE. The latter should create an initial sell-off but then I believe would translate into a faster flow out of treasuries and into commodities.
On a personal note, since moving to Austria we have been living with the in-laws. We will finally move into our new place 1 July, and we are renting there with no plans to buy in the foreseeable future. We just sold our house in the UK at the end of last week which means I now have a large lump sum in the bank account at my speculative disposal, because it is no longer stuck in the housing market. I am going to take my time to work with it and work out how best to deploy it, but it clearly alters the status quo. It means I am flush with cash, but as a trader I see this as a golden opportunity to turn it in to something much bigger. In the short term it means I can and will want to be more aggressive with opportunities, in building up my exposure, so I wanted to share it with you to set the context when announcing future trades.

John, awaiting your announcement of future trades.
Just added to silver, copper and coffee arabica
I wonder why you chose June 2012 as starting point for your expected last steep advance.
E.g. looking at the Nasdaq, June 2012 barely fell below the 200 day MA, so that was not really a major low. November 2012 was the most recent significant low below the 200 day ma, and before that we had October 2011.
From the October 2011 low, the Nasdaq rallied for 6 months recording a 36% gain over that period. Since the November 2012 low, the market has now rallied for 7 months, recording a 25% gain so far. So, the current advance is also less steep than the previous one.
Because it’s an MSCI World chart. Not a Nasdaq chart.
Yes, I see, but June 2012 doesn’t stand out as anything special in the MSCI World chart either. Just a ~10% pullback to its 200 ma, that’s not rare to find in any chart.
Do long term bull markets often end with some steep 12 month advance? Sure, that’s fairly common.
But we can easily point to many strong 12 month advances that happened several years before the end of a major move as well. E.g 1927 or 1995.
So, the problem becomes how to determine where to start counting the final 12 months. I still don’t see any good reason why June 2012 is to be chosen in the current case.
Danny, not to pull one out of Atlas Shrugged here, but some see John Galt, some do not. Some keep asking for quite awhile…
Hi wxguru. The spirit of research is to go on asking, even when one has seen what one is looking for (or not looking for).
Nice post as always John.
A short term bull trap could be setting up in world indices currently rebounding off of last week’s lows. It’s a little complicated to outline, but the reasoning and data start here: http://highrevsopenhouse.blogspot.com.es/2013/06/double-top-reversals-to-target-and.html#comment-924995390
Thanks
Reblogged this on thedarklordblog and commented:
More fascinating stuff from JH.
Thanks TDL
I have signals pointing to unfinished downside, and my weekly/monthly data (for Norway) smell danger
For SPX I have two scenarios:
1-we are near end of bounce-B in an ABC-correction
2-kind of double top in ~1 week, and target ~1530
Alt.2 is the most bearish one, which may harmonise best with the signals i weekly/monthly.
So perhaps a dip to SPX 1620, and then up to ~1660.
FOMC June 19 may start the bigger correction from double top (almost too obvious).
So have to see… should be one of the two scenarios. Either finish down, which should be bullish. Or trap bulls
Cheers Jan. End of the lunar positive period today, so maybe to your ABC.
servus John 🙂
One “problem” is that Norway and FTSE are so oversold. If SPX starts a 6-7 day C-down now to 1580 +/-, it could mean that Norway and FTSE will crash.
So I suspect we will get the ~1660 double top in SPX, allowing Norway and FTSE to make a bounce-B first.
But it is undecided… 🙂
John, a thought to cycle inversion
I know of at least 3 “solar cycles” of ~1, 4 and 6 months. Mostly they all work, but often they will give conflicting signals, and some win and some loose.
Also we have the Lunar cycle.
many people will have discovered one or two of these, while others have discovered one or two others. And when the cycles conflict, som win and some loose.
But when all cycles are in phase… everyone sees the same result. And to create panic/momentum, someone has to be fooled and trapped.
So the problem with cycles in phase, is that all the “cycle-traders” get trapped, and the cycles invert.
Right now all my 3 cycles AND the Lunar cycle point down the next 1-2 weeks.
That may work for all… or we could get the inversion…
hmm, we had a major inversion/collapse in August 2011, where S&P gave fuel to it. And here they go again? Allowing the double top?
“S&P revises U.S. outlook to stable from negative “
perhaps a couple days early… now it could be sell on news
Nice staying in Austria, John. You Know my point of view. Regards.
HUI Hurst Cycles Analysis
4 year cycle low is in play …
http://sentienttrader.com/2013/06/4-year-cycle-low-for-gold-miners/
cheers,
john
Please pick up a chart of Weimar Germany and Zimbabwe and keep that in your scenario. How do cycles theory work then is something I need to get answered. Has anyone done the research?
considering the sunspotcycle, it was near minimum and just before the next cycle in 1922-24
http://www.businessinsider.com/heres-what-happened-to-stocks-during-the-german-hyperinflation-2011-11
Normally stock markets perform well around solar minimum
Hi Robert. One of the best reads on that topic is “Fiat money inflation in France” by Dickson, 1933. Can be downloaded here: http://mises.org/books/inflationinfrance.pdf
The French “assignats” were of course an earlier version of the current QE. And the results were very similar to what we see now. Investors and speculators benefited from the QE, because it drove up asset prices. But the positive effects on the real economy were very weak, angering the man in the street.
When all was said and done, the Bernankes of those days were standing in front of a guillotine.
That doesn’t mean every QE experiment has to end in exactly the same way, but it is a scenario to consider.
Their hyperinflation peaked near the solar minimum, and was tackled by Napoleon in the next solar cycle. Maybe that experience was the inspiration for his famous saying: in politics stupidity is not a handicap.
Have added to long gold, MSCI Brazil and JPM Russia
And added to gold miners
Norway is establishing projections for another ~5% drop
Should bounce a couple days from here, unless we crash. Looks crashy…
DOW will typically try to hold 200hourMA (~30dayMA) around 15.200
But should in this setup end up failing and flush ~5% below 200hMA, which is around 14.500 and the April low
Could try 200hMA a couple more days, but when/if breaking ~15.000 it should be ~14.500 next
Have updated all models.
A cluster of storms has sharply turned the geomag model:

And sunspots have dropped sharply:

Plus it’s the lunar negative period for a fortnight. So a bearish combo all round.
Yes, looks like we may be getting some spotless days. The last remaining sunspots are about to disappear off the right side:
http://spaceweather.inf.brad.ac.uk/fm/
I think the sunspot cycle is done and dead now
There is a tidal peak around September, but it is very very weak tide. And the strong tide in January should be too late to have good potential
but it should be a long and slow decending sunspot cycle… could almost call it a depressing one, as in depression 😉
Hi Jan. Does your model have any explanation why last month’s sunspots have all gone away so quickly? We were counting +100 in mid May. Due to the 27 day Barthel rotation these sunspots should now turn back into view, but they seem to be gone completely within one cycle.
Danny
The tidal cycle (last peak on May 16) has probably two mechanisms:
-pulling up new spots from below the surface
-exhausting existing spots
So what we see now, could mean that all the existing ones exploded away (flares and CMEs), but there was no new ones to find below the surface (the “dynamo” is stopping). But is still room for slow ascending spots, popping up next weeks
the “dynamo-cycle” suggested it should have been a good potenital at this May-peak, and the tide was strong.
The next peak in Septmeber also has good potential, but the tide is very weak. So the product should also be rather weak.
And the tide in January has weaker potential, but the tide is very strong…
So both next tides have mixed total potential, but in general too weak to produce any soalr maximum.
John, a must see – this CNBC article citing the Chicago branch of the federal reserve about computing unemployment and demographics. 35,000 new jobs by 2016 a new threshold?
http://www.cnbc.com/id/100806733
If this takes root, expect other decisions to change on this basis.
Thanks – would make for a feel-good positive trend – another interesting demographic effect.
Hey John, good points here. I too follow Pring & Turner. A good explanation of this relationship is- http://stockcharts.com/school/doku.php?id=chart_school:overview:intermarket_analysis. Looks like this cycle’s timing is running a bit behind schedule.
Thanks