

I decided to add Brazil, France and India into the demographic composites (currently USA, China, Japan, UK and Germany) to expand the major global giants from the core 5 to 8 (based on GDP / stock market / population). I gave all three a weighting of 1, the same as UK and Germany (China and Japan 2, USA 4). This is the result:
 From 1980 to 2000 investors had it good, with all three measures in strong rising trends. The current window, marked by the red box, is the opposite, with all 3 trending down, but as we are working on 5-yearly intervals in the data, it would be useful to be more precise, so here are the forecast turning points in the biggest economy, the US. In 2014 US net investors bottoms out its downtrend and turns into an uptrend; in 2019 the US M/Y ratio moves into a new uptrend; and in 2022 the US M/O ratio switches from down to up. That means there is a gradual turn around in US demographics over a period of years and that the current bull market since 2009 is counter trend. The key is whether the current strong bull ought to roll over into a bear market, and I believe it should, as all 3 demographic measures for the US are still currently declining.
In the 1970s most of the 8 giants were in declining demographic trends and in the 1980s and 1990s most in rising demographic trends. That made for a fairly clear broad global bear market followed by a fairly clear broad equities bull market. Going forward this is not the case as we have divergence amongst these leading countries and less compelling trends. As global stock markets continue to largely move together I think it is still more likely that we will have a ‘global’ bull or bear with some countries dragged along counter internal demographic trends. I feel fairly sure that the demographics of the US, still the most dominant economy and leading stock market, will be very important to the overall trend. To this end we can be glad that the USA is ending down trends in all three measures between 2014 and 2022, but what happens over the next few years whilst it bottoms out these negative trends is less sure.
Japan’s net investor and MY demographics have been rising since around 2002, with the former due to top out by around 2015 and the latter by 2020. As Japan’s stock market has been suppressed until November last year I believe there is a good chance of a strong belated bull market here and certainly for the next couple of years. The threat to this is if the US market tumbles into a bear in line with its demographics, pulling down the world. Nonetheless I expect Japan to outperform so choose the Nikkei to load in on the long side.
Meanwhile, France suffers the worst demographics trends forward out of the 8 giants. Here we see the three demographic measures of France versus Brazil and India.
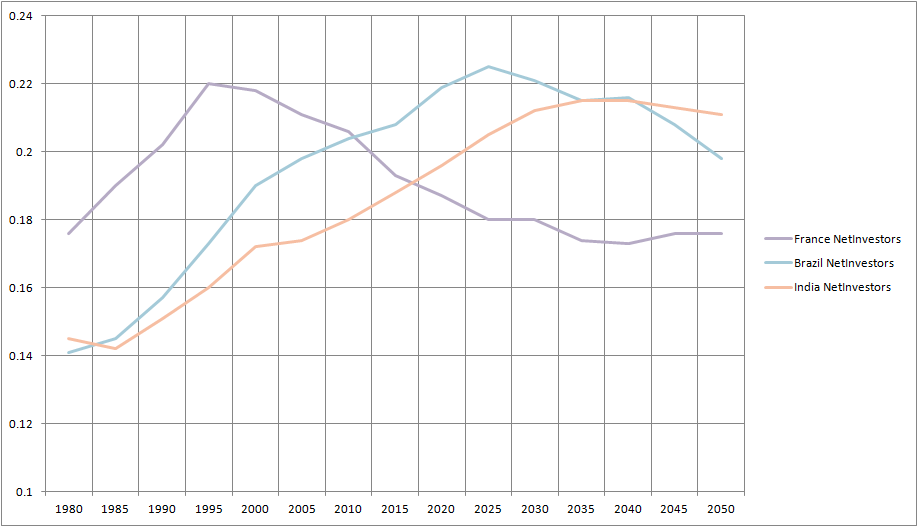


As of now all three demographic measures for France are trending down with no let up until around 2035-2040. Additionally the CAC is on a p/e of 17 currently, one of the more expensive markets, with no demographic justification. I therefore see France as a good market to short going forward. However, right now there is evidence of a pan-Eurozone improvement ahead this year, with France’s PMIs turning up along with other Euro nations. I am therefore not convinced right now is the time to open short. However, I will be looking for the opportunity ahead.
The best period ahead for a global bull market would appear to be from around 2022, at which point the USA and China become stronger again, with Brazil and India in support. Clearly that is some way off. The next solar peak is likely to be around 2025, and should produce a secular peak in ‘something’. The work of the current solar peak is also likely not yet done, if the smoothed peak is still ahead. With all that in mind, I suggest these are the possibilities: (1) commodities go parabolic 2013-2014 and make their secular peak, taking stocks into a bear before stocks become the desired class again, led by Japan, Brazil, India (2) commodities only make an intermittent peak around this solar peak and make the secular peak around 2025’s solar peak, making for a 2 solar cycle commodities bull (supported by global wierding, global population growth) with equities in an extended global bear, (3) Japan equities go crazy and makes a truly rapid bull market to exhaustion closely following this solar peak (belated take-off, ferocious climb, premature exhaustion versus demographics) or (4) Japan makes a 13 year bull market and peaks around the next solar peak, extending its run to a few years after demographics have turned, i.e. a greed peak again.

Added again long Nikkei 12660
Hi John! Great blog! I don’t know how you do such elaborate analysis it’s amazing! I think this snap back in the NIkkei is soo violent but perhaps overdone by now – look at the USDJPY it’s insane how volatile it’s been. I notice you seem to trade so many different markets. Now you are trading the Nikkei but before I remmeber you traded the HangSeng. given how weak it has been recently, what do u think of HSI going forward, as it has been underperforming quite badly lately.
Hi,
Just a note. Nikkei will need to hold above 13000, key level for the rest of the week to consider a support level, otherwise, this will be a weak bounce and risk is greater than reward here.
Also,Strength of Hang Sang is highly correlated to Shanghai composite/Shenzhen Composite. Data coming out of China is lacklustre, and more strong data is require to life the Hang Seng. .
Thanks. I share on the China relations. There are some positive developments for China: the basing in the Shanghai since Dec, and the credit markets as a lead for industrial output:

Time to start adding US stuff. Either we get a double top or we break out again.
With Japan QE and demographics to support #4 sounds most plausible in my eyes. If you look at Japan outside of Nikkei to GDP or factory output, may be misaligned.
Problem we all face is companies owning companies. To avoid taxes here in U.S. Apple, Starbucks,etc. using Ireland. Doesn’t count in GDP right? Japan similar to extent it’s auto industry factories here in US. A NAFTA GDP to demographics would be interesting. I think one more element to add here is theoretical economic unions for demographics. Merge or add the population totals of countries in economic or fiscal unions to see as a whole how they fair?
geomagnetic storm today… probably another one in the weekend…
It should be noted that most geomagnetic storm alerts we have seen this year have failed to push the Ap index above the 29 threshold that was used in the Krivelyova study, and even less so above the 50 level that marks major storms.
So far this year only 3 storms made the cut: March 1st (Ap 34), March 17th (Ap 72) and May 1st (Ap 31). Only the major storm of March 17 was followed by weakness in the stock market.
By the way, it looks we may be going to some spotless days, only one sunspot group left today : http://spaceweather.inf.brad.ac.uk/fm/
NASA also has an interestingly article today. In another sign of a struggling solar cycle, noctilucent clouds are appearing surprisingly early. This is what one would rather expect near a solar minimum: http://science.nasa.gov/science-news/science-at-nasa/2013/07jun_nlcs/
How do one transform Ap to Kp? I agree that geomag storms are not that reliable. My feeling is that you need several in a row or a major one to have it work. Fed is pumping.
Hi Robert. The relationship between A and K-index is explained here: http://www.ngdc.noaa.gov/stp/geomag/kp_ap.html
The Ap index is a 24 hour average. So, to get an Ap index above 29, the high K values need to be sustained long enough. What we get recently is brief spikes in Kp index, but they quickly reverse to very low values due to general low solar wind. That’s why we are getting few sustained geomagnetic storms.
With regards to the solar cycle vs stock market hypothesis I think we need to question where the possible effect comes from. If there is indeed higher “exciteability” in people near solar max, then it’s probably not an effect of the sunspot number itself, but rather caused by one of the real physical metrics that get elevated near sunspot max (e.g. higher solar wind/storms, solar flux, proton flux,.. or the higher ultraviolet radiation, Ap index, and so on).
Now, let’s assume the effect works through geomagnetism (Ap index). Then what happens when a solar cycle is too weak to really lift the Ap index meaningfully? The normal cause of higher exciteability is then absent (or too weak) for that cycle.
A lot of solar metrics remain near levels that are normally consistent with previous solar minima. Then where is the expected exciteability supposed to come from?
The complexity of the market ought to grow along with the observed senescence attributed to the demographics of regions and countries, We’ve never been here before! I’m not convinced that the ‘drag’ will play out in the future as it has in the past due to the steep decline in the M/O ratio. It might suggest a dramatic transfer of wealth that is very hard to measure. Where will the money go? An 88 year old neighbor recently fell, hit her head and subsequently took a $39,000 helicopter ride. (She’s doing well) A small example perhaps suggesting massive sector rotation never seen before (rotation into healthcare/pharma/bio-tech/nano-tech). And then, there is the debt… that ratio dove tailing with the demographic ratios appears ominous. A point of exhaustion will be reached echoed by the observation of Water Supply issues growing as pointed out in Trading the Sun (couldn’t put my finger on the page #). Also, although pure demographic numbers are on the decline, participation rates of ‘savers’ will be forced upwards as individuals become ‘mandated’ to ‘save’ and the ‘net’ numbers will likely increase out of necessity, and even more so as pressure on government programs increase. Dent is notoriously off base, but my hats off to him as the penultimate salesman. Nevertheless, the complexity grows… as we march and evolve into a NEW WAY.
HVA
Hi HVA. While trying to make long term projections can be a useful exercise, we have to bear in mind that it is only a projection. There are several monkey wrenches that could get thrown in the demographics machine.
One of them is wars or epidemics making serious changes to the population numbers in certain continents or even worldwide.
Another one is the “singularity”, which is now expected before 2030 by some “experts”. A sudden expansion in life expectancy could mean that “middle age” becomes age 40-100, and then people will postpone their retirement indefinitely. The implications for investors would be huge.
Danny,
Excellent. Point taken. I think postponement of retirement is already happening… In terms of epidemics we may be especially vulnerable to air born diseases and the so called designer viruses. Some crazy stuff on the web about it but also some interesting research… Life expectancy expansion is an odd phenomenon in spite of inorganics, pollution and environmental poison… the implication for government pensions might be the proverbial nail in the coffin…
HVA
Long transformer manufacturers?
http://www.telegraph.co.uk/technology/news/10103492/Solar-storm-could-leave-Britain-without-power-for-months.html
John,
As for gold, its interesting that Charles Nenner who got his clients out of gold at 1900 now sees gold bottoming in middle of June. Today’s (June 7) gold & silver slide in the market may indicate that Nenner is right. He expects gold to hit 2500.
Did you hold on to your gold positions?
Jack
I think he had mentioned on several occasion solar peak is ahead, and he is expecting gold to outperform. Bottoming will occur in the coming weeks, and it may be later than June, if solar peak is projected to be between now to September.
Yes I held on to most and I am looking to add – will post when I do.
thoughts on solar activity
geomagnetic storms affect biochemistry, through melatonine, serotonine, heart rythm disturbances and more. This can cause a drop in overall trader sentiment.
However the market must be suceptable to show a significant effect – the marked trend must be weak, so that many sell-signals can easily triggered.
Severel geomagnetic storms over some weeks can wear down the trend/sentiment, while a single strong storm in a strong trend can be shrugged off.
Another effect is from solar flux, or rather the change in solar flux. I dont know the mechanism, but could it be that the solar flux (high energetic radiation) that causes ionisation in the upper atmosphere, has an inducing effect on the lower atmosphere? If the ion-balance changes in the air we breathe, there are hypothises that say negative ions cause good sentiment (anti-oxidant). And positive ions are bad (free radicals).
Negative ions are related to water and sea, or after thunderstorms, and makes us feel good.
If something like this could be a mechanism, the rising solar flux may cause rising sentiment, and vica versa.
Other effects I know of, are proton radiation (negative sentiment). And the more mysterious solar wind… which I think is a similar effect as the geomagntic storms… but rather a solar wind-effect that is ever present (while the storms are short term events)
All these effects work at the same time, and the accumulated effect is seen in the marked (-trend). And the weker the trend is, the more suceptable the marked is for negative influences.
another observation: sometimes the marked is suceptable for sentiment-changes, and sometimes there are other dominant factors.
If the marked is very oversold, there will probably be a cascade of technical buy-signals, that all have to be finished, before the marked cares about sentiment.
Like after the two year bearmarked that bottomed in 2003. That gave edge for at least one year rally, triggering golden-crosses in 50/200MA, rising 200MA and so on. And in this rally-phase, any geomagnetic storm is irrelevant, because the market trades on stron technical signals, cascading buy-signals, and an accelerating trend. Could even be that there is an inverse effect, where geomagnetic storms create more buying-panic rather than selling panic.
And buying-panic is often seen as the initial reaction after a geomagntic storm. Maybe bulls get irrational and think the sky is the limit, or that bears feel panic and cover. This will cause a blow-off, overbought and stall/drop (swith to sell-panic)
Future predictions must take into account the natural evolution of consciousness as we move from a crude domination of nature to a new nurturing role and more choices. From being gross consumers of resources we will become wiser users. We need and will have smaller more affluent populations. In the 1st world the emancipation of women is a direct result of the birth control pill, and a middle income family has better food than royalty of 200 years ago. Looking at poverty levels in the 3rd world the internet will enable complete education. Out of this will come new careers and priorities for expenditure and changes we cannot imagine.
To base the future simply on demographics and current spending patterns may miss these points.
update on sunspotcycle

Two mechanisms:
First he “dynamo”, angular momentum, wobble etc has a cycle that is topping around September 2013. This cycle tells what kind of “potential” that lies beneath the Suns surface
Second the tidal cycle shows what goes on on the shorter term. This mechanism “pulls up” the sunspots from below the surface, and/or exhaust those that allready are floating.
Messy image: http://www.sibet.org/images/2013/20130609a.jpg
Two observations:
1-the tidal cycle (dark red) corresponds with local flux tops (green wavelet). Mostly the flux-tops lags the tidal tops.
2-every two or three tidal tops are major, producing major peaks in solar flux (black wavelet). One peak was lagging more than normal, and cannot be explained by this simplyfied model.
Current situation:
May 16 was a major tidal peak, and has so far produced a major flux top also in May. Now flux has dropped much, and it looks like the major top is done (unless there is a lagging peak still ahead).
The next major tide is in January 2014, where the dynamo has turned down. After this tide, the tidal cycle is also loosing strength.
Conclusion: At the moment it looks like we have had the major flux-top after the May 16 tidal top. And the next major tide in January should be too late to produce a solar maximum. So unless there is an anomalous flux-top coming… it looks like this sunspot cycle is about to roll over. But we know for certain first around March 2014.
here is solar flux and the Norwgian index

Sometimes one can see correlation, and other times one has to “explain” what happened.
In August 2011 the index was at a critical point. Solar flux spiked up bullishly, but we also had some major bearish sunstorms.
The index broke down, triggering technical signals, like the death-cross in 50/200MA. But solar flux “told us” it was a great shake-out and buying opportunity.
After the bounce up to December 2011, solar flux dropped. Were we really trapped in a new bear? However, somehow the market broke ut, triggering technical signals, golden cross 50/200MA and so on.
Thereafter solar flux has practically went sideways, and the Norwegian market is locked into a (rather weak) uptrend.
It looks like a rising bearish wedge… and if solar flux should start to drop and trend down… it could favor the wedge to break down, soon triggering a new death cross and so on… and that could trap us into a new bearmarket…
and adding some statistics for Norway
Friday we closed about 4% above 200MA, and have been 234 days above 200MA.
Historically 200-300 days are normal, so a break below 200MA should be expected in the coming months, unless we have an überbullish situation like ~1996 and ~2004
The trend is weakening, and 50MA getting closer to 200MA. So unless we see a new surge in momentum, it looks like we are topping… potentially soon breaking the wedge, go below 200MA, getting death cross 50/200MA and so on.
breaking the wedge does not have to trigger an immediate crash, allowing us to retest the wedge and make a bigger double top first, before we get the death-cross and so on 🙂
Thank you all for your input and comments