

I am now of the mind that there is a complex interaction between demographics and solar cycles bringing about what is more commonly known as ‘secular’ bull and bear markets in equities. We need to understand the demographic trends of the main countries (those of major GDP, stock market capitalisation and population in the world), whether these are broadly trending together or divergent, and when the trends change. We also need to know when solar peaks fall, as demographic trends peaks that fall close to solar peaks are likely to be brought to an excitement maximum around the solar peak. We also know that solar cycles influence birth rates and thus demographics, adding to the complex interaction.
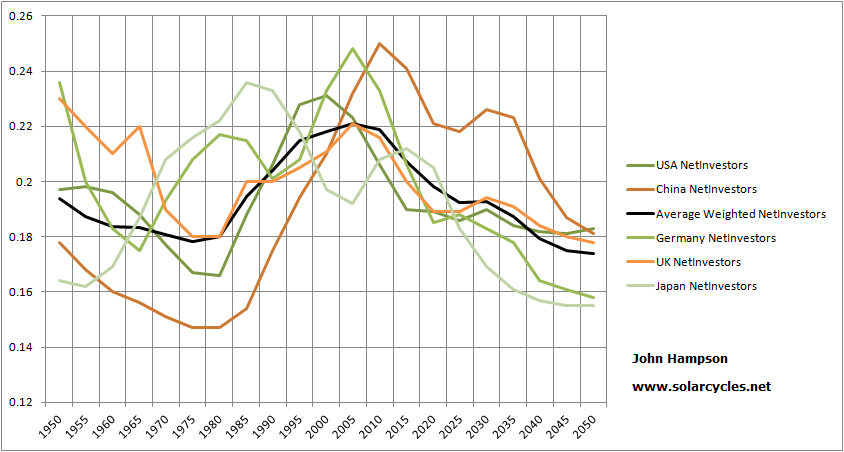
We know that stocks markets around the world largely move together, so I believe we need to pay particular attention to the demographic trends of the ‘giants’ as it is unlikely we can muster a global stocks bull if the collective trends in the giants are negative. To this end I have amalgamated USA, China, Japan, Germany and the UK into composites of middle-to-young, middle-to-old and net investor ratios, and projected them forward. I selected these five countries based on their GDP and stock market capitalisation dominance since 1950 to now. I then applied GDP/marketcap-appropriate weightings in creating demographic averages, with Germany and UK weighted 1 each, China and Japan 2 and USA 4. This is the result:

We see a clear collective downtrend in the demographic trio of measures from around 1965 to 1980. I believe that is the reason why we saw a broad global equities bear market for that period. We saw a clear collective uptrend in the trio of measures from around 1980 to 2005. I believe therefore there was a long equities bull in this period across most of the world. Within that long global bull market Japanese stocks topped in 1989 (solar peak) and US stocks topped in 2000 (solar peak), but the collective weighted demographic trend did not really change until around 2005, hence the MSCI world index registering a peak in 2007 rather than in 2000:

Source: MSCI
Because collective demographic trends then turned down from circa 2005 and are not projected to bottom for a few years yet, I suggest the current global rally in stocks is likely on borrowed time, and that there is the possibility of a global bear market in play from 2007 through to either around 2020 or 2025. There is a window of demographic respite from around 2025 to 2030, but then the three measures are united negative again from around 2030 to 2035.
I have broken down the three demographic measures below.
Net Investors is collectively in a downtrend from here onwards. However, Japan is good right now, and several of the countries enjoy an up move from around 2025 to 2030.
 The collective Middle To Young ratio is more healthy going forward, but rather flat overall. Japan again shines now.
 The Middle To Old ratio is overall rather dire for the next decade, but there is a collective improvement from around 2030.
 In summary, the current global stocks rally ought to come to an end as it is counter demographic trends, i.e. it is unlikely to be a new ‘secular’ bull market in progress. However, within that Japan has the demographic trends to justify such as bull market for itself, and its take-off in November 2012 was belated by demographics. Therefore I expect Japan can carve out more gains, but that the other major nations are more likely to tip over into a fresh equities bear in due course. As global markets tend to move together I don’t expect Japan can go its own separate way, but rather that it will outperform the others as markets move up and correct less than the others as markets move down.
Returning to the first chart above, there is the possibility of an overall global bear market in stocks lasting until circa 2025, which is likely to be the next solar peak (or thereabouts). If that were to occur then commodities could potentially only be at an intermittent peak currently, heading for a ‘secular’ peak around 2025’s solar peak. Food for thought.

Dent and a few others predicted 2008 based on demographics. Demographics, credit cycle, and solar cycle are the background on which all the other technicals are based. To me, they are all gathering for a top here.
The soy complex is looking parabolic. .
Thanks Kent
John,
You state that there is the possibility of a global bear market in play from 2007 through to either around 2020 or 2025. Yet, in your Ultra Long Term Models you state that US secular stocks bulls last around 24 years, or 2 solar cycles. The accompanying chart has the 2008 to 2032 DOW going up to 260,000 by 2032.
You also state that If that were to occur then commodities could potentially only be at an intermittent peak currently, heading for a ‘secular’ peak around 2025′s solar peak. However, in the Ultra Long Term Models you state that Secular commodities peaks occur around every 33 years. The chart in the Ultra Long Term Models indicates that the last secular commodities bull market peak was 1980 so the next would be expected in 2013 as the chart indicates. The next commodities peak would be 33 years later in 2046 and not in 2025 as you state.
Has demographics changed the 33 year cycle?
Hi Jack, my thinking has evolved as my research has evolved. I need to go through the site and weed out the redundant. 2- and 3- solar cycles are still revelant, but I now think too simplistic to give the whole picture.
Hi John. I have studied old DOW and FTSE data, and found a ~40 year cycle. And every two cycle lows seem deeper, suggesting a ~80 year cycle. But with only ~200 years of data this is quite uncertain.
Analysing DOW with moving averages, fourier, wavelets… and looking for planetary/solar explainations… I have so far ended up with a 43 year cycle. But the picture is a bit more complex, and am still not quite sure whats driving this market cycle.
Here is the average 43 year cycle in yearly data DOW. It has a low stretching to year 2027, but when looking at previous lows, the actual market low may be a couple years off 🙂
http://www.mcoscillator.com/learning_center/weekly_chart/40-year_cycle_in_djia/
1973 1974 and FTSE. Very interesting.
.http://en.wikipedia.org/wiki/1973%E2%80%9374_stock_market_crash
It was especially painfull to Commonwealth.
Anyway I’m still wondering 40 years cycle, or 3×13=39 years cycle…
(You know, 1974-1987-2000-2013?)
Thanks both
Jan. I am impressed by your calls =). I rest my case.
Hi Jan and John. Both really impressive work on cycles. Jan you mentioned old FTSE data. I’ve been trying to find FTSE and LSE data from 1900-1984. Where did you find yours? I feel the US may be headed into the same economic cycle as the UK after WWI. Thanks.
Click to access Barclays-Equity-Gilt-Study-2011.pdf
See towards the end of this doc
You would be interested in Dent’s work John.
Read “The Great Crash Ahead” – good ideas for what to Invest in, until the next bull – circa 2023.
Thanks for all the work you do – always interesting and thoughtful.
Thanks
John first picture on this post up arrow in column 2025-2030 – see this

What is that – a long term Bradley model?
Sorry – now seen on your other comment that it is indeed a long term Bradley model.
Capitulative breadth hit 8 yesterday and Nymo reached below -100. A bounce should follow in US stocks, and there is the new moon ahead at the weekend to help the uplift. I have taken profits on two thirds of my Dow short and added again to Nikkei long position. Ideally looking for a bounce to take us to a marginally higher high or a double top in June on US indices with negative divergence to the May peak.
John, you are onto something. Feel free to email me.