More selling yesterday, but then intraday reversals that produced hammer candles (stocks, oil). Hammer candles often mark bottoms, but capitulative breadth still didn’t trigger. Ryan Puplava compiles some oversold indicators and divergences that are suggestive of an imminent rally, but he also notes that market breadth has weakened.
This is how the SP500 stands. There is a trio of supports coming together around 1341, if we head lower, and that would potentially put us sub RSI 30.
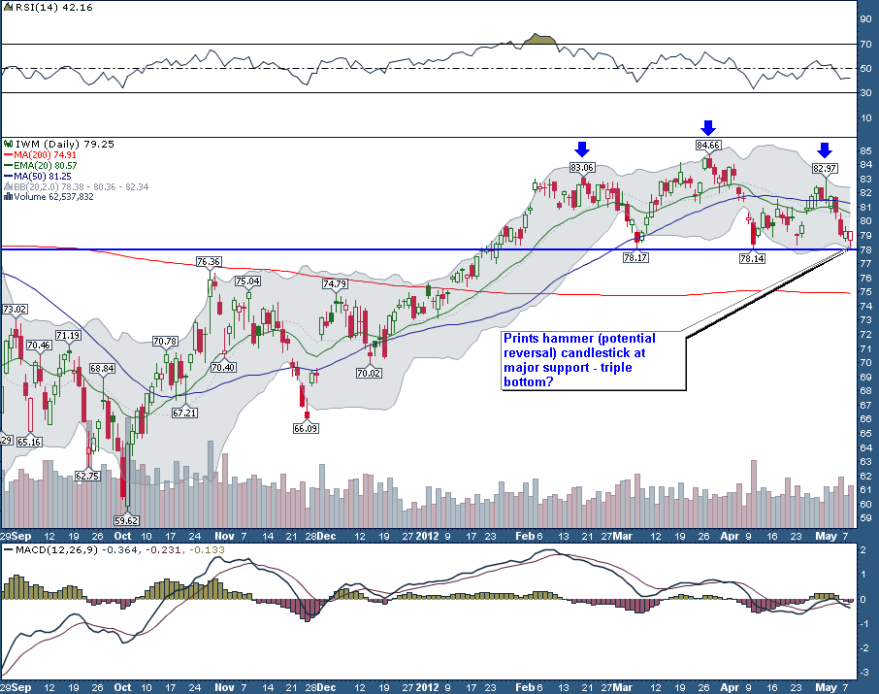
The Russell 2000 has either made a triple bottom or is playing out a large head and shoulders to a considerably lower target.
Source: StockSage
Stocks are reaching towards overbearish but sentiment could drop lower yet before a reversal.
Source: Stockcharts
Stocks are heading towards oversold, but could also drop further yet to reach extreme.
Source: Indexindicators
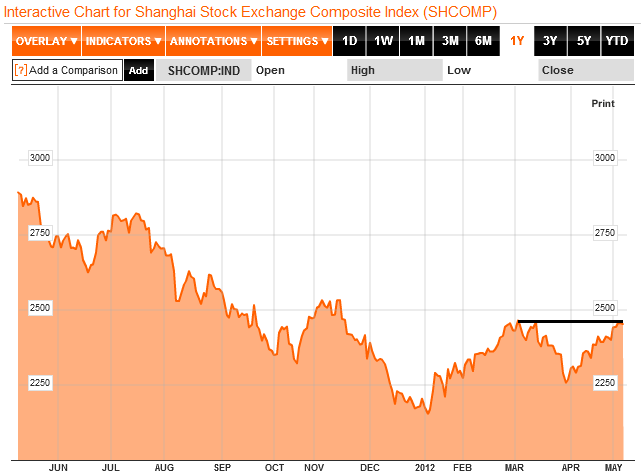
The Chinese stock index needed to make a higher high to confirm a new bull trend since the start of 2012 but has pulled back at a double top, shown. If it can break out, it will be suggestive of China growth and associations with commodities.
Source: Bloomberg
10 year treasury yields are back to all time lows.
Source: Stockcharts
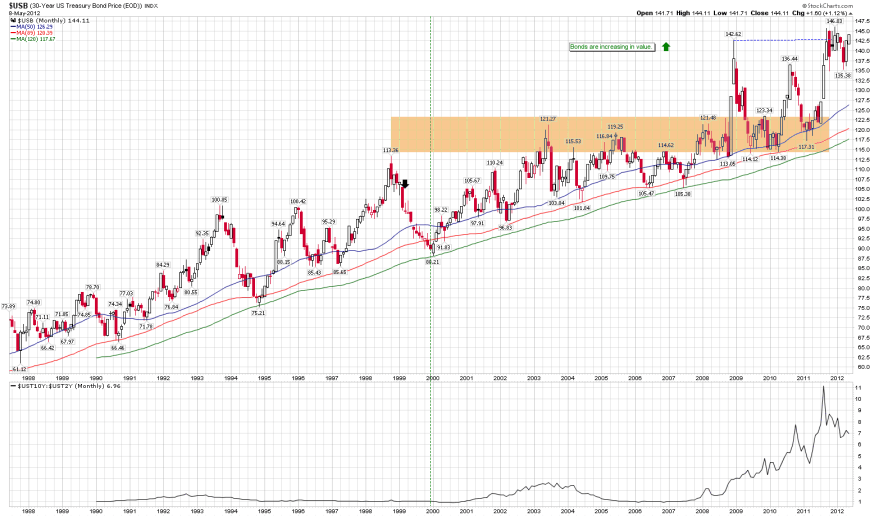
30 year treasuries back to all time highs.
Source: Stockcharts
I have added to short treasury positions. Doug Kass is bearish on treasuries here (hat tip Juan), calling it the trade of the decade.
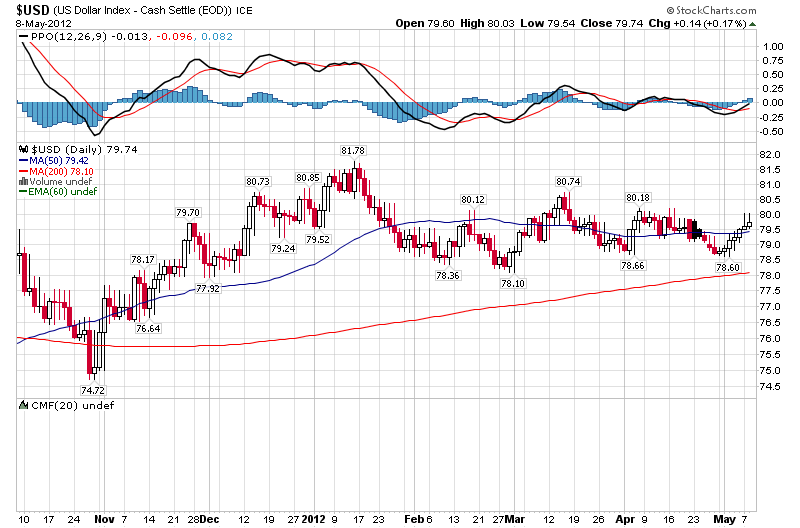
The US dollar remains in a range, despite the Euroland troubles. As yet this is not resolved.
Source: Stockcharts
Spanish CDSs have nudged back up, but other than Greece CDSs, Euro debt hasn’t catapulted up again in this fresh round of fear.
Source: Bloomberg
Right now, it looks like 2010 and 2011 again – mid year pro-risk retreat with Euro debt back to the fore and slowing growth. I find it hard to believe we will see the same again, as the market always likes to surprise. So what if not that? Well, the run up into the solar peak is typically one of growthflation. The mid year should be lower geomagnetism, by seasonality, which is supportive. Sunspots should continue upwards, which is supportive. And stocks generally fair well mid year in US election years. I suggest therefore that we need either a natural pick up in growth here (economic surprises ticked up for all regions yesterday but we need to break the downward trend; China and emerging markets could take over as the driver) or we need central bank assistance, such as ECB action to deflate Euroland issues again, and the Fed to replace Twist in June. But either way, I rather expect we will see a more pro-risk friendly mid-year.
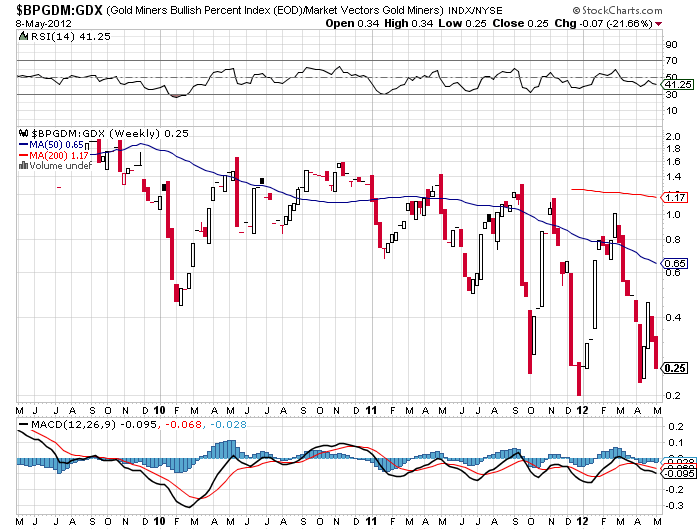
Gold miners’ cheapness relative to the gold price, overbearish sentiment and oversold RSI sub 30 make them still a great opportunity here, I believe. I added to long gold miners.
Source: Stockcharts
Source: Andrew Nyquist
Silver is sub RSI 30 and overbearish sentiment. I added to silver longs.
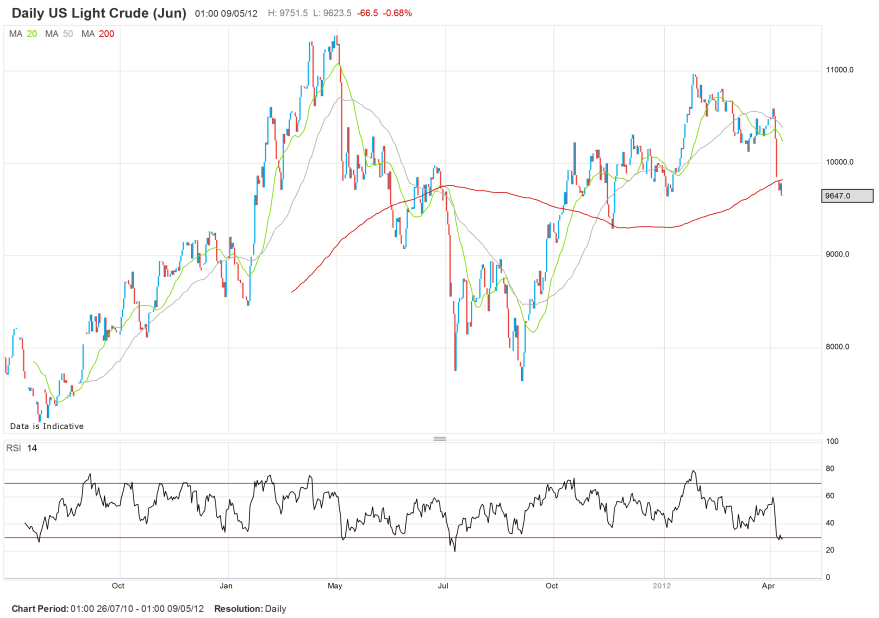
Crude oil is also oversold. I added to oil longs.
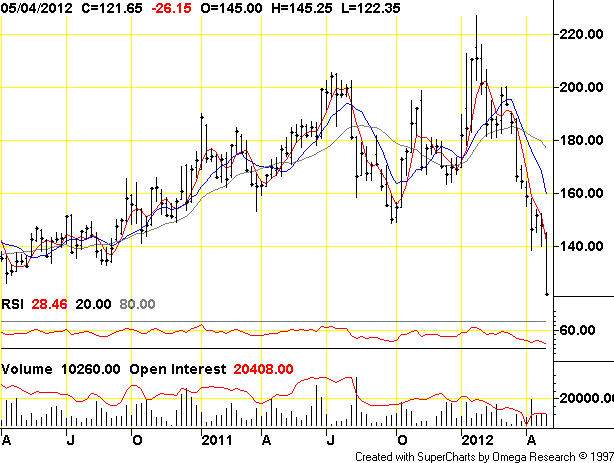
Orange juice has halved in price since the turn of the year due to ample supplies, but is now oversold and extreme overbearish. I opened a long OJ position.
Source: TradingCharts
Nothing (so far) has shifted me from my view of how things will play out into 2013, namely a commodities surge, and even if I were wrong, oversold AND overbearish assets eventually mean-revert. If we move further to extremes in commodities, treasuries pricing and sentiment in the sessions ahead I will add again. These are great opportunities, in my view. The picture for equities is more in the balance, with some indicators of a bottom but some reasons to expect further selling. Developments in the macro picture need close monitoring, as evidence of a pick up in data or government intervention could cause a surge, or equally, continued deterioration could cause a big sell-off.








take care with long positions, John, you know my prediction for this year. 2013, after a medium drop, first, until end of spring and second , a big drop in the Industrials to the end of 2012, begining13.
You can see what is doing emerging markets from past months, basic materials, Europe, etc
2013, a big bounce, yes.
Regards
Hat tip to Gary for this link: http://www.marketwatch.com/story/major-correction-unlikely-2012-05-09?dist=beforebell
Also makes it look less likely we see a repeat of 2010, 2011 midyears.
The reason the US market is selling off is that European money managers are getting margin calls and having to raise cash by selling off their US holdings. Once the European trading day ends, stocks in the US rally back because the sellers are gone for the day. This happens day after day. So, don’t watch the US market, it’s strong. Watch the European markets, once they bottom, the US will soar. BTW, this is also why the euro has been stronger than most think it should be. When those money managers raise cash in the US, they sell dollars and buy euros to repatriate home to Europe to cover their margin calls.
—Bob
Thanks
Thursday mini update:
Another daily hammer candle yesterday, plus the last 2 days have been higher volume, both suggestive of a rally ahead.
On the flipside, Spain CDSs rose to a record, China import/export data disappointed (though could be spun as more easing/stimulation ahead) and there is geomagnetic disturbance.
No position changes. See what today brings.
There is a definate feel about the markets that they are at a major turning point – after a long period of PM selling by investors, prices have held relatively well, and the charts still mirror the previous rhymes from 2006 and 1979.
I see those recent CME’s are partially earthbound, and likely to cause some degree of geomagnetic disturbance through Monday 14th – so we could be in for a messy few days before direction becomes clearer.
Looking at WSO’s most recent measurements for the sun’s polar field strengths, the northern field is still fast approaching its reversal/peak, but the southern field (which has been persistently backing away from reversal, resulting in no overall progress towards a solar peak since March 2011) has suddenly shown a decrease in field strength over the past few days. These short-term (unfiltered) measurements are historically volatile, but this decrease could very well signal a renewed move towards an overall dipole reversal/ solar peak.
The more reliable filtered measurements will confirm or disprove it over the next few weeks…
Thanks Mark
Do you know what to make of this prediction from Japanese scientists:
“Magnetic field polarity at the solar poles will reverse and become quadrupolar in May, meaning positive fields will emerge in the North and South poles and negative fields will emerge on the equator, according to the National Astronomical Observatory of Japan and other institutes. ”
http://www.yomiuri.co.jp/dy/features/science/T120420005829.htm
Here is a previous press release from them.
http://hinode.nao.ac.jp/news/120419PressRelease/index_e.shtml
This quadrupolar idea is confusing, but apparently it happened 300 years ago….any interpretative help would be much appreciated.
Thanks for those links – at least it is reassuring to see that the Hinode observations generally agree with the WSO’s. What is not so reassuring is that experts do not seem to know what a quadrupolar sun would mean for sunspot numbers or geomagnetism, but there are suggestions of a long timeframe/ low sunspot cycle leading to cooler global temperatures (and correspondingly higher agriculture prices).
The last 10 northern pole measurements (unfiltered) from WSO are all +ve (tending to indicate a reversal), but there was also a series of 8 similar readings in early 2011 – in other words, that apparent northern reversal did not complete (that “false” reversal coincided with a commodities high). So I would not take it for granted that it will definately reverse this time…?!
The most convincing model I’ve seen so far is M A Vukcevic’s, which has been extremely accurate so far, and projects stop-start reversals which does not resolve until 2015. http://daedalearth.files.wordpress.com/2011/03/hcs-vs-barycentre-a.png
Recent solar cycles have been straightforward front-loaded/ high sunspot cycles with distinct peaks, but this is SC16 which peaked during the 1920s. http://www.solen.info/solar/cycl16.html
It appeared to peak during April 1926, then October 1926, then August 1928 with a smaller eventual peak during July 1929. Selling out of the stocks bull market at the earlier peaks would have been a huge mistake as you can see in this chart http://www.sharelynx.com/chartsfixed/USDJIND1920.gif
So that must be a concern – that SC24 is shaping up to be like SC16, showing us the exit several times before gold and silver and agriculture really go manic…
Some analysis from the ‘shortsideofthelong’ blog that supports your theory:
“Basically, I think risk assets are oversold and I think safe haven assets like Treasuries are overbought. That is not to say that a bottoming process is not volatile without few wore days of up and down swings, but I think majority of the selling has finished. My main focus remains Silver for the longer term trade. I think the metal will go totally ballistic in coming years as we end up in a huge bubble that reassembles late 1970s. People always email me and ask me why… why do you think Gold and Silver will go that high? They warn me that it is already a massive bubble and that deflation will bring Gold back to $400.
I disagree. Governments will always take a path of least resistance. Inflating out of the Debt Crisis is the easiest path, as opposed to austerity, bond haircuts or outright default. All others will most likely create total social disorder (think Europe right now) and turmoil… possibly even a war of some kind! How do you think eight trillion dollars worth of debt will be rolled over this year in the Developed Economies?
And what about 2013 and 2014? At the same time as dumb money keeps talking about how Gold is in a bubble, Global Emerging Market central banks continued their gold buying spree and their selling out of US Dollars. Mexico bought 16.8 tons of Gold, Russia bought 15.6 tons of Gold and Turkey bought 11.5 tons of Gold over the last 30 days. At the same time, China’s gold shipments grew to 62.9 tons in March alone, which is the third largest volume of Gold in a decade from Hong Kong to the mainland, according to UBS research I read earlier. China is about to overtake India this year as the world’s largest gold buyer.”
Thanks guys.
X-class, that’s new to me, thanks for sharing. Caused a slight drop in the Earth’s temperature previously.