
I have updated all the short, medium and long term model pages.
A quick recap. By solar cycles, commodities should make their secular peak close to the next solar maximum, expected Spring 2013 (within the following 6 months fits with history). In the run up to that point, we should see commodities outperform stocks by some margin, and we should see commodities pull away from the geomagnetism/lunar model. I am positioned for that, with a ‘full’ set of commodities longs.
Yet, so far in 2012, it is stocks outperforming commodities, and US stocks pulling away from the geomagnetism/lunar model, whilst commodities are closely following the model, which has recently been trending down.
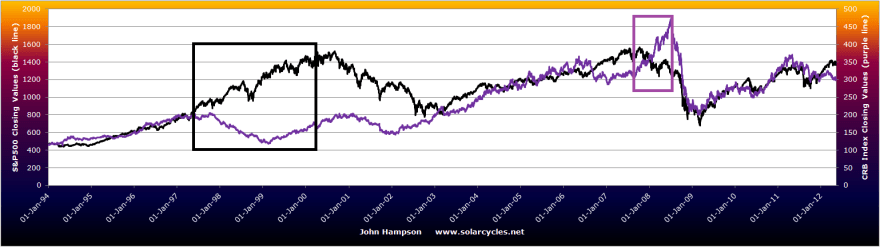
Below I have boxed in black the outperformance of stocks into the last solar peak of March 2000. On the far right of the chart we see developments right up to date and observe that commodities have not pulled away in the same way yet, with just 12 months or so to go, in fact, stocks have pulled away in the last couple of months.

The purple box above shows the last episode of full commodities mania whilst stocks pulled back. This is what I expect into the solar peak. By history, stocks should track overall sideways from here into the solar peak, falling away towards the end, whilst commodities should accelerate into a final mania. That purple box lasted just 6 months, and drawing on history again, we might indeed expect commodities to accelerate as of 6 months before their peak, and go truly manic as of 6 weeks before their peak.
Right now, certain commodities display contrarian oversold and overbearish readings. That makes for a fairly compelling buy if I am correct about outperformance and mania ahead in 2012/2013. Gold should be the leading commodity in this Kondratieff Winter, and it is one commodity showing excess pessimism, with gold miners likewise.

Source: ActingMan / Sentimentrader / Hulbert
The reasoning behind secular asset peaks merging with solar peaks is that sunspots drive human exciteability which translates as speculation, buying and inflation in the markets and economy. Sunspots have been a little underwhelming in Q1 2012, but just lately picked up. If sunspots start to make new highs, then I expect commodities to begin their outperformance. But putting sunspots aside, let’s recall what happened in late 2007 and early 2008 when commodities went the opposite way to stocks.
Oil was the driving commodity. A decline in reserves, peak oil worries, Middle East tension, monetary inflation all played their part, and eventually a feedback looping of speculative greed dominated, until the global slowdown became more accute and commodities popped along with everything else.
Food prices rose to records, as oil is dominant in the process. Plus increasing demand from emerging markets and global wierding affecting harvests both shrunk stocks. Gold rose as an inflationary hedge, as a safe haven and as a hard currency.
In 2012, we still have low reserves in oil and agricultural commodities. Global wierding has been less extreme in recent months, depressing food prices as record harvests are expected from record plantings. Nature has the ability to deliver that, or to sabotage it and put low inventories back into focus. Oil inventories have been rising as global growth has gone through a slow patch, but emergency reserves remain low. Geopolitical concerns remain, but right now are more muted than, say, during the Arab Spring of 2011. Rising sunspots into the solar peak have historically correlated with protest, revolution and war, so again, nature has the ability to cause trouble here and affect oil prices.
There is a close relationship between food prices and the gold price (a chart I recently published), there is a correlation between oil and food, as oil is everywhere in the process, and there is a correlation between oil and gold, as oil drives inflation and gold hedges inflation. Farmers also switch plantings (foodstuffs, biofuel) depending on prices, adding to the interrelations. So, if we get a trigger in either energy, precious metals or agriculture, we may see the feedback looping begin in all three.
In summary, I reiterate my expectations for commodities to surge into the solar peak of 2013, and I maintain my trading positions to match, but patience is required as we could potentially not see true acceleration and outperformance until Q3 or Q4 of 2012. However, we see contrarian overbearish or oversold extremes in certain commodities now, providing a base from which to begin an uptrend, and a recent pick up in sunspots that has the potential to inspire speculation and potentially geopolitical disturbance which could drive up oil or gold.

As I posted the other day I believe that the 1613 level in Gold is an important level. Trading back down to that level increases the likelihood that the super performance period will take place from next summer into 2015. Trading at that level also increases the chance of price reaching 1500 odd at some point though not necessarily in this current move.
For these reasons I have clipped back my positions that I made at 1630 recently and sit with my long term holdings from lower levels.
Re Equities. I’m sorry for that long URL yesterday. I hope it didn’t take up too much space.
Tomorrow, 9th, is the last day of the downward pressure of this wave of The WP Model, making the low of tomorrow the start of upward pressure.
Hi Will, I’m expecting the downward pressure to end from mid-this-week into start of next week. But I want to see bottoming indicators before buying.
Hi John, quite right too. Below 1348 is below my model.
This could well be the final clear-out of weak hands in the gold market – I’ve bought a spreadbet at $1596, but will get rid of it on any significant weakness below $1594. $1577, if it is reached, will be another great speculative opportunity to buy in…
Dominic Picarda of the IC was recently commenting that we were seeing the overbearishness in gold and silver but not the oversold extremes. RSIs are sub 30 now, so now we’re there, but we need to see some technical evidence of a bottom, such a hammer candle.
I have some concerns regarding the fact that comming sun-spot maximum would be so small and totaly not like the ones from 70-80’ties (http://www.vukcevic.talktalk.net/NFC7.htm).
If they are so different maybe commodities will also behave differently.
Yes it’s going to be a smaller peak, so potentially speculation and inflation could be less dramatic, but when I’ve looked at it before, the size of the solar maximum hasn’t really correlated with the size of the asset mania, e.g. 1958 was the biggest solar cycle of the last 100 years but wasn’t one of the bigger asset manias.
Your theory is that commodities will peak with the solar cycle. Great but you are going by NASA’s prediction. As best I can tell they were completely wrong about the beginning and magnitude of this cycle. And when I first started reading solarcycles a few months ago you said they had changed their prediction to spring 2013. That is at least 2 wrong predictions which gives me little confidence in this latest one. This cycle seems very different. Ref 30 RSI. Gold not there yet. The HUI is in extremely oversold levels generally not seen except at the beginning year or 2 of a major bear mkt.
Of course it’s impossible to accurately predict chaotic chains of events ahead of time, but perhaps we should all be wishing for a modest solar maximum at this particular time,
It is not hard to envision a scenario where increased solar activity leads to increased earthquake activity — a long established link — leading to, say, this:
http://www.washingtonsblog.com/2012/04/the-largest-short-term-threat-to-humanity-the-fuel-pools-of-fukushima.html
Not easy to predict how financial markets would react to such an event. But the threat of ongoing catastrophes in Japan is real, and very serious. It’s a pity few are even aware.
I can confirm Prestons outlook providing that we do not breach the previous Natural Cycle low we should head up.
http://change-in-trend.blogspot.com/