
US earnings: blended earnings growth stands at -2.2%, compared to an expected -5.2% before reporting began. So that’s quite a beat, and may account for some market fuel, but still negative. Blended revenue stands at -3.7%. With meagre sales revenues, companies have turned to buybacks and M&A. Take out the effects of oil and the dollar and earnings look better. The question remains whether oil and dollar are signs of creeping disease or whether they are more isolated issues.
Weak oil, weak commodities, strong dollar and global manufacturing flirting with recession. These are the main problems in 2015. As a result, emerging markets with more reliance on manufacturing or commodity exports are in trouble. Some refer to this as the 3rd phase of the financial crisis (P1 US financial system circa 2008, P2 Eurozone circa 2011, P3 Emerging markets 2014-5). The question is whether the world economy can recover here again and ease us away from those issues.
Disinflation remains the dominant theme. Deflation is a threat, but if we take out energy again then prices have held up better. So for now, CBs are not reaching their inflation targets but nor are we slipping into deflation. Somewhere in between.
The strength in 2015 remains in services, particularly US services. As we approach the end of 2015, leading indicators for the US have weakened whilst they have improved in China and Europe. Maybe then we are going to see another rotation in outperformance, keeping the global economy and equities supported. Or maybe the negative feedback looping is now too entrenched. If the US dollar is now kicking off a new leg higher then we are likely in for more trouble, so something to watch.
The stock market leads the economy, not the other way round. We can summarise the above by saying that the global economy is fragile and therefore that how equities perform from here is likely to dictate whether we tip over the edge into a deflationary recession or stay in disinflationary weak growth. The situation remains unclear for equities. Neither bulls nor bears can declare victory at this point. Evidence in indicators suggests a topping process has been in progress for 2 years. Torturous for both sides. Plus, we can’t rule out the prospect of an even longer sideways range trade.
By demographic trends, the age of the investor is over, at least for the foreseeable future. This is echoed in a bunch of charts that extrapolate future returns based on current valuations, market cap and more. They suggest the market is going to flirt with zero returns over the next decade.
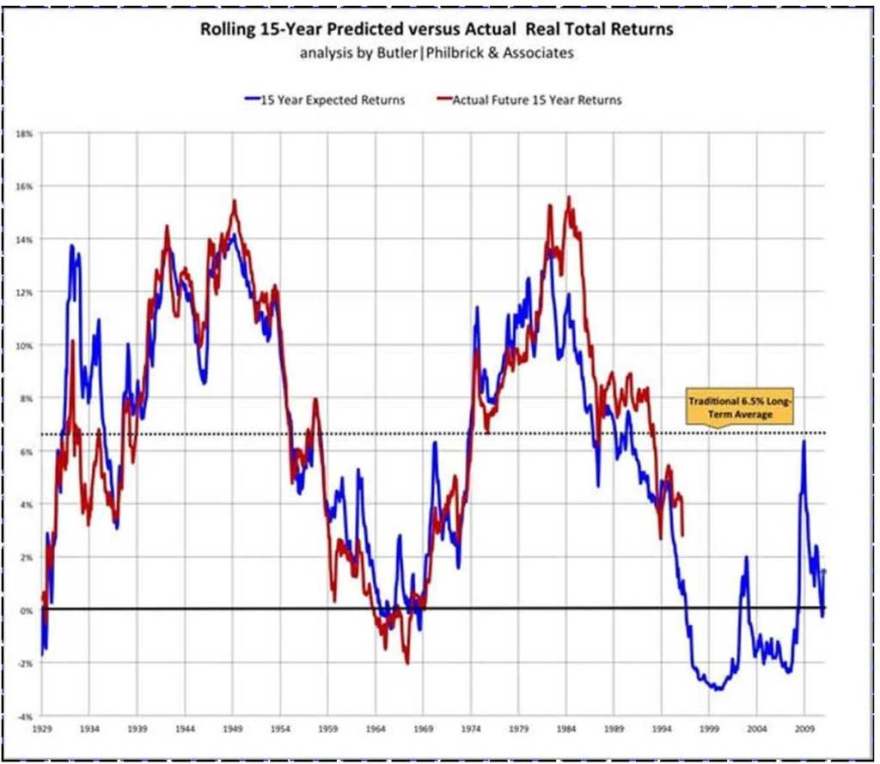
Source: AmericanAnnuityAdvocates
Equities struggled to make any more headway in H1 2015 with valuations in the 97th percentile historically, sentiment and leverage at all time record extremes, allocations to equities similar to previous major peaks. With a shrinking pool of buyers under demographic trends, there is a question mark over how stocks could now resume a bull market higher from here given the market appeared so saturated earlier in the year.
Here we see Rydex traders were at extreme allocations earlier this year equivalent to the 2000 mega peak, and how the recent rally has brought them back to fairly extreme levels.

Source: Stockcharts
They appear to have been playing the Biotech mania ($IBB). Biotechs are valued at 7x price to book, which is the same as the Nasdaq was valued at, at the 2000 peak. Can Biotechs and Rydex traders resume upwards and make even greater highs here, to beat the biggest mania of all time?
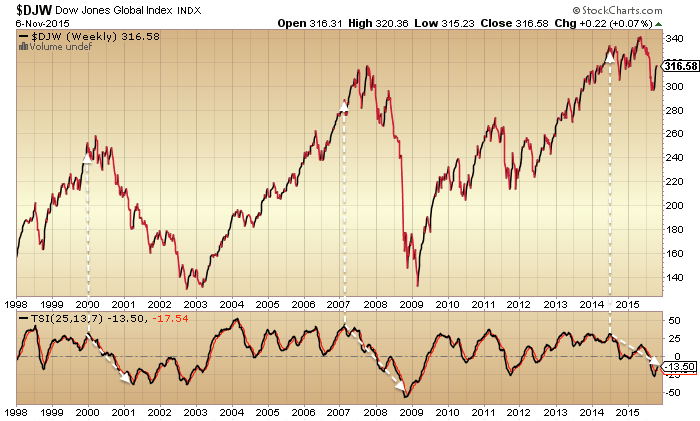
The Dow Jones World index appears to show a topping process that ended in May 2015. If that is so then we ought to be on the cusp of a new leg down.

Stocks to bonds and stocks to dollar continue to show a peak in mid-2014, equivalent to Jan 2000 or June 2007 as a lead for a bear market.

In both that chart and the Dow World above, new highs are required by the bulls to negate the bearish patterns. New highs are some way higher, meaning that more US large cap indices could go make intermittent new highs here, without invalidating these bearish charts.
However, levels of insider selling and puts-calls suggest the rally in equities is unlikely to get much further.
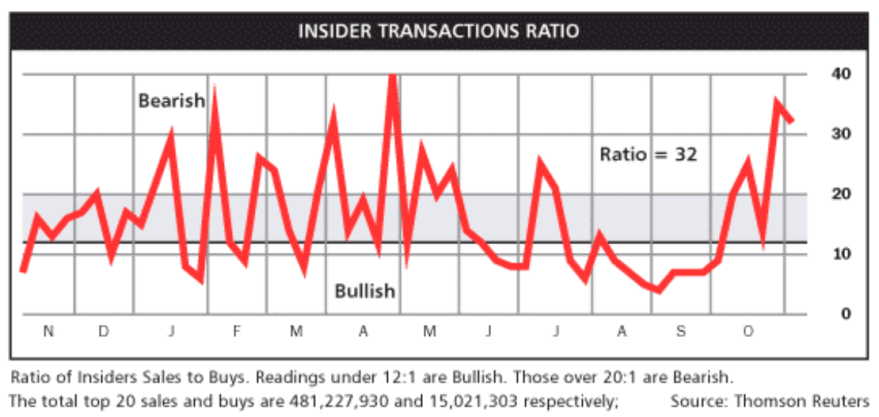

Source: Barrons
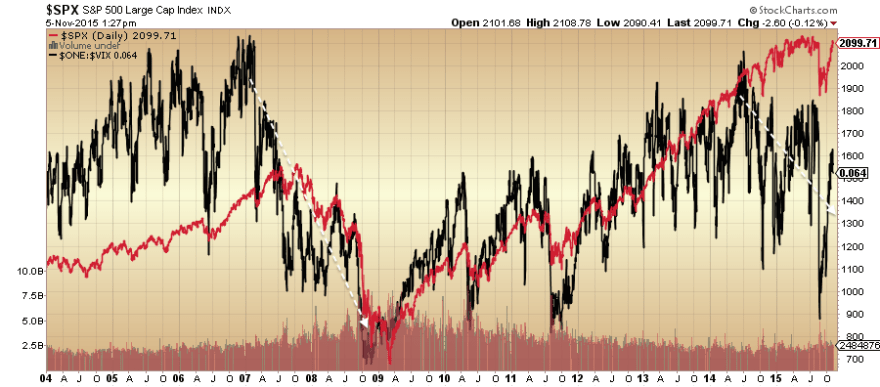
Divergences in both volatility and credit spreads also cast doubt on equities breaking out of their overall topping arc.

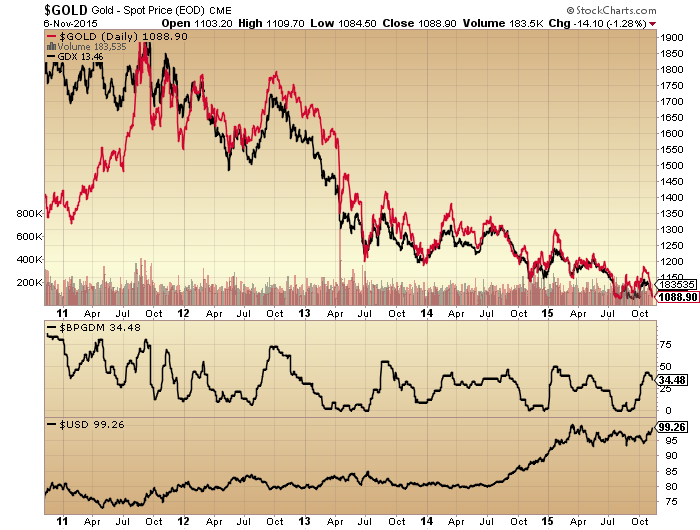
Cutting across to gold, it suffered a fresh collapse this week, with commercial positioning having moved to short. As the second chart below shows, it may need to fall further yet, to new lows, before a bottom is found.

Source: The Daily Gold
This would fit with the new up leg in the US dollar which appears (tentatively) to have kicked off.
Regarding the sun, October was a period of low geomagnetism and increasing sunspots, both supportive of the rally in equities. Geomagnetism is back in progress the last several days and should this persist then it should act as a headwind to stocks.

Source: Solen
All those indicators that I previously pointed out as peaking mid 2014 with the solar max remain just so. Stocks:bonds, stocks:dollar, vix (inverted) and credit spreads can all be found further up the page showing a June-July 2014 peak which is still honoured. So, for now, the idea that the mania peaked out with the solar max still has a multi-indicator case.
In summary, the big picture suggests equities are going to struggle to break out bullishly, both in the near and longer term. Equally, however, stocks have been bid back up strongly off the October lows. Therefore, we remain in limbo. Near term indicators suggest stocks should be ripe to tip over again. Meanwhile gold may need to washout further to new lows before finding a bottom. Those two don’t seem obviously compatible, unless the US dollar rallies strongly, which could well be initiating.
Lastly, global liquidity has turned negative as central banks have spent to defend their currencies and propped up their economies. The last time this occurred was 1980 to 1985.

Source: Nowandfutures
But what saved our fortunes back then was the upturn in collective demographic trends, shown here:

Now note the collective demographic downdraft that is in progress from here until mid-century. This suggests central banks are going to have to keep defending their currencies and propping up their economies despite massively ballooning debt and shrinking reserves already. It is very hard to see how the world can get out of this trap.

Thanks for another great post, John. I don’t comment much but yours is always the first commentary I check out each weekend. Truly appreciate the high quality research you share here.
One observation which makes sense based on relative performance over the last year or two. Looking at your demographic chart, the US is near the end of the dramatic part of its net investor decline and really, it is the first to stabilize though it obviously doesn’t turn back up any time soon. Perhaps more remarkable is how long that demographic downtrend persists. 2045-2050 before an aggregate stabilization/improvement?!? It might be interesting to see some more youthful economies added to that chart such as India, Brazil or Indonesia. At any rate,despite better valuations in other parts of the world, the US equity markets have been the best place to be for some time and that may continue to be the case based on the demographic chart.
I also found that insider sales ratio chart noteworthy. Make sure to republish that when it dips into bear territory or let us know where we can check it for ourselves.
Thanks again, John
Thanks. Countries like the ones you mention need to and should become more dominant economically globally with their positive demos to offset the declining developed. But it takes time. The insider selling/buying is updated weekly here
http://www.barrons.com/public/page/9_0210-instrans.html
JH, I also think that productive life might evolve over time. People are living older now but also working older. Specifically on how it affects the market indicator, in the past, people stop working at 65 and sell their stocks quickly expecting to last to 75. Now people might work to 70, gradually go to part-time, and when they sell their stock, it has to be gradual as they might live to 100.
Does the graph start from 1945 or 1950? If it is from 1945, it seems that the demographics flat bottom (red line) was around 1975, which is near the 12/1974 bottom.
But I think I am reading it wrong. The graph starts from 1950. Therefore, the market anticipated the demographics bottom of 1980 and bottomed 5 years early. If the US has that kink in 2022, the bottom for stocks might then be 2017.
My eye balls are not very accurate this morning.
Not identical to John’s Net Investors chart, but similar: https://solarcycles.files.wordpress.com/2013/06/23jun13.png
Reblogged this on Rajveer on Markets and commented:
A must read
Thanks
Excellent analysis as usual, thanks John.
I’m going to do some research over the weekend on how things looked just before the August drops. Looking back at a few blogs, looking at the levels of various asset classes also.
I suspect I will find that sentiment has been reset to totally bullish, whilst certain divergences will have arisen in various asset classes.
I will report my findings.
Re gold and the USD, at some point we will see gold rising whilst the USD index is rising, that will be THE sign that gold has turned the corner (subject to a possible final re-test of the lows, although this could be it now). Gold has held up well in the past 16 month against a strong(!) dollar, so the signs are there already.
Thanks GM
GM; for your consideration, note the strong relative strength of the dollar vs gold since March of this year. Looks like the dollar is currently in wave 4 of an incomplete EW triangle, with the final wave 5 to come. A softball setup for the dollar bulls for the whole world to see. Higher highs/lows in the dollar. Technical patterns seem to work brilliantly in all approved investment vechicles while the nightmare continues for the ‘gold is money’ crowd.
For the record, I’m not in the ‘gold is money’ camp, never have been. Money is debt, always has been.
To examine the relative strength of the dollar v gold one just needs to look at the dollar price of gold, it’s the easiest measure.
Although my comment was related to gold and the dollar, I’m more interested of late to see gold showing an upswing against the industrial commodity group.
Currencies, their relative values, are of little consequence in the medium to long term given the inevitable devaluations and worse that lie ahead.
GM in your opinion is there a price which gold will not go below; as a floor? c.20 years time wise?
No. On a short term basis any price is possible. An intra-day plunge to $700 or lower would not surprise me in a severe liquidity crunch.
The mining cost is the longer term floor, at around $1,000, which makes the risk/reward now very attractive, given that in past, cycles where sovereigns have lost the market’s confidence have seen c. 20 fold increases in the price of gold.
I’m looking for more this time, as the bubble will burst this time, not be reflated.
I hope the chart from AmericanAnnuityAdvocates is wrong. In order for the red line to follow the blue, the market has to go up over the next year and half in order for expected future returns to turn negative…
Fear not! The chart is a couple of years old.
LOL! Thanks.
Also thank you for the Rydex update which I was looking for…
Good summary, John. Earnings, demo, sun seem like they may be headwinds for any upside to US stock market. Only factor that could nullify this would be a mania (Sat in Sag), that is why I am agnostic about mid to long term prospects and prefer to swing trade using Lunar Edge among other tools, :).
Some significant comparisons with October 1998 from an old favourite: http://time-price-research-astrofin.blogspot.ca/2015/11/2015-vs-1998.html
If the markets continue with this historical rhyme, that indicates an SP500 euphoric stage from now until March 2017.
Another similarity: 1998=2016 in the lunar declination cycle (Gann’s Timetable is shown on the same page).
8 November 1998 – same time of year for geomagnetic disturbance and same year in the lunar declination cycle as now – SP500 formed an obvious second chance to go short (you’ll need a more detailed chart than this one to see it clearly): http://www.chartsrus.com/charts.php?image=http://www.sharelynx.com/chartsfixed/USSP5001980.gif
Stocks were in obvious bubble territory, having increased by nearly 250% over the previous 8 years, and many indicators were already at or beyond historic extremes. They then continued to rise by another 36% over the next 16 months, which would correspond to SP500 = 3000 by March 2017 should it repeat again.
What drove so many people to take the incredible risk of piling into such obviously overvalued stocks? The truth is that they did not decide to take a risk with their money – they did exactly the opposite, following everybody else into what they perceived as the safest sure-thing. The riskiest thing to do, so they thought, was to be the odd one out and miss out on these easy gains.
We’re at a similar time and place now, with retail outflows from stock-related investments having been near 30-year highs over the last 6 months.
Mark.. i don’t post very often, but i am perplexed about your comments, so seeking clarification.
wow that’s quite the target for SPX ==> 3000 by mar-2017, that’s the highest target i have seen yet, 3 EW guys i follow have targets of 2200-2550.
Are you saying RETAIL investors have left the market during last 6 months? but then at some time in the near future reenter the market (fearing that they may miss out on incredible profits) and buy-buy-buy to create the blow-off top,
Others i follow, believe RETAIL & US COMPANIES (historic high levels of stock-buybacks similar to other periods just before major stock market declines).are the only net buyers of this crazy market. Institutional (smart money) & hedge funds have been selling and shorting this market as it climbs higher.
High yield credit is not supporting this latest ramp, and as credit usually leads the market, much higher stock prices seem unlikely, look at what happened in 2007-2009 with high yield credit & SPX.
market breadth is horrible, especially in NDX – this rally has been led by a few momo stocks(FB, AAPL, GOOG, AMAZN, NFLX and some bio-techs), and when smart decides “he who sells first sells best” than the entire house of cards will collapse very quickly.
Times are quite different today than the late 90’s – there was lots of growth back then, INTERNET was a new thing that had lots of growth potential, young & middle aged people had great jobs. economy was growing. Today– unemployment is at a low level, but anyone i talk with doesn’t believe it, and almost every week i hear of some corp laying of thousands of people.
It seems bad economic news makes stock market go up, most of the time, other days well bad news is bad news. It seems to me stock is very heavy manipulated and the trick is to figure out which direction the TPTB will take the market.
SPX may make a slightly higher high, but a major sell-off could occur at any time,
Fundamentals will mean something one of these days.
Cheap energy, getting cheaper. Energy accounts for much or most of most consumer items especially food.
New materials lighter and cheaper, labor savings thru robots and AI.
Much exciting tech changes mature yet haven’t been introduced into the market.
This is to say, a possibility exists of multiyear bull market supported by structural changes and corporate buy backs. At the end of which, most of the shares will be removed from the market and the remaining shares will be more valuable.
crazyworld2013 – To be precise I think 3225 is the natural price SP500 should reach, based on the proportions of its moves since 1995. That seems incredible now, even to me, but even bigger moves have happened before – a repeat of the 1920s market would see SP500 at 4000 by April 2017. I’m not saying that this MUST repeat again; I’m saying that it has happened before and that so far it is in fact repeating again.
As you say yourself, times are quite different. That’s always the case I think – every time has its own particular circumstances, and they keep evolving. Several years ago I stated my view here that there was an 80% chance of a SC16/1929-style US stocks bubble developing and then crashing during August/September/October 2015. But after July 2014 it became increasingly clear that 1) US stocks were not going euphoric as they did during 1928/9, and 2) too many people were coming up with the September 2015 timeframe (Shemitah, Armstrong, 1929 rhyme became obvious etc).
So for the past year or so I’ve been looking towards the next solar timeframes: Q2 2016 and Q1 2017. I know think there’s a 90% chance of a bubble starting soon and eventual crash at Q1 2017 (historical rhymes favour that later date).
Retail investors – I agree that this is very important, especially now. But some are saying that retail is fully invested, others the extreme opposite that they are at historic lows. Since 10 November 2014:
– $9BN (net) has been withdrawn from SP500 ETFs
– $10BN from emerging market ETFs
– $7.5BN from NASDAQ and Tech ETFs
And on the other hand,
– $37BN has been pumped into Euro and other Developed Market (Ex US) ETFs (mainly during Q1 2015)
http://www.etf.com/etfanalytics/etf-fund-flows-tool
Market breadth in NDX – speaking from memory, I think that something like 85% of stocks lost 50% or more of their value while the index doubled during the final year of its previous bubble! (I’d like to be corrected on that one though if anyone has more specific figures…). Also, I would respecfully suggest that all these standard measurements and indicators are nowadays so widely published that they must already be priced-in before we have time to react to them.
Yes I definately agree that there’s a lot of bad news around, but I disagree that stocks are being manipulated by TPTB (we all think that when a market does not do what we think it should do). We are at a typical time now when solar/ geomag/ lunar influence should turn positive (against all expectations) – the stock markets will not wait for unexpected good news, they will anticipate it…
valley, those things you mention are all valid, and will produce a multi-year bull market cycle, but first…we must clear out the mess of the current cycle.
There have to be some huge adjustments in debt levels to move on, and we will see that in the period from now until the bottom in 2020.
I cannot recommend this audio interview highly enough, especially the latter sections on cycles. No mention of solar, but guess where they are forecasting the eventual secular bear bottom will be?
[audio src="https://cyclesman.com/wp-content/uploads/2015/08/Peter090915.mp3" /]
[audio src="https://cyclesman.com/wp-content/uploads/2015/08/Peter090915.mp3" /]
Thx GM, that was a very nice interview to listen to.
Well, just to be clear I was thinking in terms of currencies not being money. Really seems to be academic at this point; if we’re going to 700 gold from these levels. It often seems like the gold promoters are actually working for the cartel ; continually putting news out there that appears uber bullish, while prices continue to decline. (:-)
I won’t get into the currencies/money thing with you.
But I don’t expect to see gold hit $700 or lower, although it wouldn’t surprise me.
I will share a chart later, I expect the bottom in January at around $950, and it won’t be there for long.
I had also noted that momentum indicators look very similar to May 2008 which was the lower top after 2007.
May 2008 was also my expected cyclical high back then.
It may be significant that we are now a Gann 90 months from May 2008. That’s always a time to watch for a turn.
I know John dismisses it but the “5” year factor and pres cycle suggest a positive year and it “never” fails.
Wave structure still suggests another higher high to complete a major 5th wave.
This could well be the single most important determinant of market action over the next couple of years. But it is almost certain to be past its peak: http://users.telenet.be/j.janssens/SC24web/SC24.html#Ap
We are now at month 72 in that Ap graph.
Also, see how much lower geomagnetic disturbance has been duriing SC24 than the other solar cycles since 1933
aa index since 1868 tells much the same story, but with two instances where geomagnetism peaked about a year later – those two instances are why I say “almost certain”.
But there must be at least a 90% probability that geomagnetic disturbance will fade away from October 2015.
Thanks for the link Mark
This chart (EW) fits with many cycles, including the solar cycle.
http://elliottwavepredictions.com/http:/elliottwavepredictions.com/nasdaq-100/elliott-wave-analysis-nasdaq-100-index-etf-qqq-sid-elliottwavepredictionscom/
Many of the bulls out there (and here) are pinning their hopes on the 1998 chart similarities.
I’ll ignore the huge number of fundamental differences, John has mentioned most of them anyway.
Here are the two charts. One looks energetic, compulsive, moving up in fairly clear waves. The other looks tired, gradually running out of steam and then experiencing a prolonged sideways period. To my eye, they don’t look at all similar (apart from a bounce from the decline to where we are now).
1998 had already exceeded lateral resistance at this point in time BTW, not that there was much of it. 2015 is now at that lateral resistance, and has just recently run out of steam. Uh oh.
We will see shortly whether the bulls are correct, or whether they have rose-coloured spectacles.
http://screencast.com/t/RWwTz3Bgpx4
http://screencast.com/t/2EyIfvDufCX
Rain & mist prevented a round of golf today, so had time to do some research instead.
That research included a most interesting review of posts & comments here just before the August decline, as well as some cycles research, and some sentiment research.
Conclusion: the rally is over, we may head straight down from Monday, or we may hang around for up to a week or so at these levels. When the next decline happens, it will either be very deep (c.30%) or it will bounce at the trendline connecting the two recent lows (so forming a triangle pattern, especially for one of our regulars).
I’m stuck on which of those two, a coin toss in my mind, so I will leave some of my shorts alone for the potential big plunge, maybe all of them, we will see.
Oil and copper and the USD all stand out as highlighting that the rally has run its course, and also the sell of in gold recently coincided with sentiment being totally reset to ‘complacent’.
Good luck (only to bears of course).
🙂 🙂 I LURVE TRIANGLES!! They on the other hand don’t much care about me.
Ce la vie!! Their loss I say. Lol.
It’s not that the triangles don’t like you. You just picked up a wrong bias. Be careful what you read 🙂
Choosing the direction before the breakout is something I woudn’t recommend. Also you don’t trade 5m charts, so why you jump from one timeframe to another? Trading is about consistency, not brilliance.
The last bit is very true despe
Credit where credit is due , M Armstrong has been nearly alone in picking the gold direction. He has been vindicated in his advice to stay away while most have called it a moon-shot.
Apollo 13? 🙂
(I agree, for the past few years he has been correct).
LMAO, another one that forgets that MA was calling for new highs in gold into 2013 and highs of $5 k in 2015.
I have finally workedout that the reason the guy hates gold now and in particular hates gold bugs, is because he drove many investors into gold on that forecaast alone, many only to lose their shirts.
Many of those investors turned on him sending him emails so that now he hates them and now has paint the picture that all along he was warning of lows under $1……..AND THAT IS JUST NOT THE CASE!……the man is a liar and very very deceptive and manipulative.
Look at his past history.
As fir being the only one that was warning of a high in 2011 and new lows…….ABSOLUTE RUBBISH.
I know of at least three advisors that were warning back then that gold was way ahead of itself and that gold would decline quite dramatically, however those commentators are now advising that gold has bottomed or near bottomed and CORRECTLY SO, that it is a buy.
Unlike MA who is now so bitter about gold bugs because of their anger toward him and rightly so in many cases, that he continues his almost daily rants of abuse directed toward gold and gold bugs.
BTW I am NOT a gold bug. Never have been, never will be. There is however a time when one has to either buy or sell due to overvaluation or undervaluation, whatever the case may be.
Gold is historically the most undervalued it has been in centuries relative to every other asset and good quality gold stocks even more so.
MA will once again be shown for the abyssmal trader that he is. How else did he lose 100’s millions back in 90’s?
……..oh that’s right, it was somebody else. He was just the head of the firm. He’s always innocent and never wrong!
Gold lows under $1, wow, I’ll be selling my house & cats to buy that dip Allan. 😉
Just want to be clear here, you’re telling me you don’t like Armstrong, right?
😉
Very negative action on the ASX All Ords today. Currently down over 100 pts inside the final hour despite strong performances across most of asia. It has broken its 50 dma again and is likely setting up to break its double bottom. The chart below does not yet show todays move.
I have been saying for months that the ASX is the leading indicator of the global economy and that all major global indices will soon follow.
They can’t colour the truth too well with the ASX.
http://stockcharts.com/h-sc/ui?s=%24AORD&p=D&b=5&g=0&id=p44496338154
Martin Armstrong just lost ALL credibilty
“Every single manipulation they have every done in the metals has been to the upside”
Never ever once to the downside. The guy just proved once and for all that he is an egotistical JERK!
Mildest November in the UK I can remember,
I’m in Surrey, lovely for walking atm.
US futures off at the time of this post.
Steve St Angelo knows more about the fundamentals of the PM’s market and energy markets than anyone I have ever read
http://www.silverdoctors.com/critical-factor-the-real-reason-behind-precious-metal-manipulation/#more-60153
Peak Oil is a myth, a scare, one of my favorite End of The World campaigns in my saying, “The end of the world is always a few years away, until it is tomorrow” It follows as a good scare though, not an irrational scare. It served to get people to look at the problem and respond. And respond we have.
Despite this use of the term in the article, I do not disagree with much he said about Fracked Oil. It is dropping like a rock and will continue. What he fails to mention is the dynamic of why it is dropping fast. The drilled wells are making money, but not enough to drill more and with fracked wells, they have a shorter life than traditional wells. The USA has the reserves and they will always be there to be produced when prices make sense to do so. Therefore, the USA can keep prices at or below the cost to produce fracked oil. Same goes for Tar sands in Canada.
The world is drowning in oil and more is found all the time. The more we look, the more we find. And if we can ever get Global Warming to ACTUALLY melt the poles, we would be drenching in even more.
None of this even matters in the slightest, because it is not oil that drive the economy, it is energy as a more general term. With all the Nat Gas reserves, we once again are drowning in Energy.
If you really want to blow your mind on carbon fuels, start investigating Frozen Methane on the Ocean floors. We know about enough reserves to DRAWF the amount of oil that we have ever used and know about in reserves.
Not that any of this really matters, because Nuclear Energy both Fission and Fusion can provide more than enough to run the entire world. I have no issue with wind or solar, but they are really just a feel good energy source. I do have a problem with those energy sources being subsidized heavily as they have been.
Sorry, starting to ramble…..
There are ZERO energy shortages and OIL is not running short in the least. It is merely a scare, but a good one as we learn to deal with a resource that must be found and produced.
JaFree, I’m curious what your thoughts are on solar longer-term, i.e. over the next 5-10 years.
Gary, I think that what happens to Solar has absolutely everything to do with what happens to subsidy. It really is that simple. Solar would not exist without subsidy. The largest and most efficient solar installations are Solar Heat projects (ie Towers and Parabolic concentrators) in CA and NV and if you look at those projects, they are still too expensive and they do NOT produce to the advertised amount of Energy (Shocker right???). This technology left to Market forces would not exist. Your answer can only be known if you know how the Government is going to support this idea. I will say this, if the subsidies stop, so do the new construction of Solar. I could go on for a very long time on this subject, but no time today.
China (I believe) are going all-in on solar Gary, read a few pieces a while back.
The Saudis know their days are numbered with oil, hence they are getting into solar too, and selling every barrel they can now (still at a healthy profit).
JaFree, I couldn’t disagree with you more, although I understand why you say what you say below. Surely, you’re aware how rapidly solar panel costs are dropping and that within a matter of a few years they will be equivalent to fossil fuel costs (which enjoy enormous subsidies, not that we’re on the subject). While not exactly equivalent, what’s occurring in the solar industry is akin to Moore’s Law in semiconductor fabrication.
So before you know it, the issue of government subsidies will be a non-issue. The more important “problems” will be what the utilities will do with their stranded power plants, who will pay for access to and upkeep of the national grid, etc.
I will believe it when I see it. Solar is nothing compared to Nuclear solutions, but I do agree the best place for Solar is desert. By the way, as I mentioned. Solar HEAT is how you get efficient Solar and the panels just are not there yet, and will not be for decades (with an S), The Saudi solution, which has been put on hold is similar to Solar One in the NV desert. It is an Heated Oil with parabolic mirrors. These are the efficient solutions and they still are not parity with Electric grid, as a matter of fact they are about 2-3 times parity. Keep in mind that other Energy Sources can go down too. Fusion could bring Energy to lows not beleived just yet. So Solar has a very tough road ahead and the solar panels will not drop with Moore’s law, that is for processing power. In Fact, Solar Cell development has been extremely slow.
BTW, I am for reducing all subsidy for any industry with the exception of Farming. There are good reasons for farming incentives.
GM, China is going all in on Nuclear Fission. They have about 35 plants in construction and a bunch more planned. They are even becoming experts on it and creating their own improvements to Western Technology. If I remember correctly, they are about to build a Nuke Plant in the UK so the lights can stay on when the wind stops blowing and the Sun Stops shining.
Believe me that Solar and Wind will never be anything more than supplemental power.
Markets dropping at the open. Start of the long awaited drop or another carefully planned scenario by banks and hedge funds to allow a better buy in price to deliver their HNW clients much improved returns?
I would say, typically for NFP in 2015 : if the news impulse was down, Friday was up, then Monday was down. Only sometimes this year the direction was sustained.
The Giant corporate money hose to NOWHERE!!!:
http://theweek.com/articles/587462/giant-corporate-money-hose-nowhere
Resources in general are finite, peak oil, peak hydrocarbons and whatever else will come at some point. It is impossible to say with any certainty though of course. This is why we need to change the way we manage them longer term. I of course include fresh water and other “resources” that are not mentioned in most debates, because they currently have not been monetised…..
The drop in US production will probably only be 900k to 1 mill barrrels peak to trough (lets say trough will be Q2 2016 or so), sure – rig counts are very much down from peak but they are mostly older rigs in marginal areas – an 80% drop in rig count has resulted in a 25% or so decline in production only.
The reason why wind and solar are viewed by many as a “feel good” source only is because we tend to think of these things in terms of money and the limitations this puts on us. Longer term I hope that we see the need to get rid of “money” and start thinking differently in terms of resources and how we live as a species.
J
Jeger, Finite is a funny term. Often misused when it comes to Energy. I agree we need to think differently too. Like Fusion for example. IF we can truly get this to work, it is a game changer. Solar and Wind will never provide a game change, just a small insignificant token energy source for people to hang their hat on as doing good for the environment, and that is a VERY debatable belief.
Having said that, investigate frozen methane on the ocean floor and then ask yourself, Why is it there and where did it come from??? Because, nobody has a clue. We as a people are sooooooo full of ourselves to think we have a clue how this earth works, we don’t, in fact we are very clueless. Carbon Energy is nearly infinite in terms of human use, and without going into a very long discussion, anyone that dares to research will find out the same.
I have a beautiful saying for those that love solar:
Oil is nothing more than the most effective way to use Earth’s Stored Solar Energy.
don’t you love how the market makers took spy all the way back to 210 to pin on friday in preparation for todays breakdown. that is why i don’t like same week spreads for expiration. the dark pools, hfts, mms can take over at any point and keep the premium. Peggy’s predictions looking good so far
At the start of the previous few days of waterfall in August, no one at all here was talking about it as it happened.Not until 24th.
Interesting when reviewed in hindsight.
“At the start of the previous few days of waterfall in August, no one at all here was talking about it as it happened.Not until 24th.”
Oh really?!!! You obviously gloss over pertinent information too quickly …
I gloss over nothing.
As it happened, no one was talking about until the 24th.
If you want to blow your own trumpet, feel free, I spotted your prediction.I’ll look out for future predictions of yours with interest.
Is English your main language?
wow there are some angry posters here…must be fun at a barby
re Armstrong ,I had investments managed by him in the late nineties which increased by 60% PA with very few DD. Then he went to jail
He is no idiot , not every post or suggestion is correct but I would not trade agin him
“I’m mad as hell and I’m not going to take it anymore!!”
The Industrial Metals, copper and silver, look to be breaking to new lows. This is not a good sign for the world economy. Specifically, copper is trying to make a “triple bottom” but triple bottoms do not hold but usually break to new lows.
It looks like another broad based sell-off in Commodities is underway. That includes the Energies, Metals, and the Ags. I doubt that the selling is attributed to only the dollar going higher but is also because of a continuing world wide economic decline.
Richard, not sure ‘underway’ is the correct word, as copper has already fallen by a fair bit in the past 4 weeks, along with other commodities. Establishing a new low for this cycle today is significant though.
As well as all of the research that makes me think a seriously large decline is at hand, I can just smell it too. The bull blogs are buying all sorts of crap on this tiny dip, totally bought into the ’98 BS and new highs. Complacency is at peak.
I don’t think anybody can talk about “peak oil” without reading and understanding what the people at Automatic Earth and Our Finite World have to say.
It’s not about the supply of oil. That will last forever. It is all about the economics of extracting and using oil. BTW, I think we’ve already seen it.
http://www.theautomaticearth.com/
http://ourfiniteworld.com/tag/peak-oil/
Specie, I promise you I can talk about it without referring to those sites. Everyone loves to get wrapped up into the emotional death spiral of the day. But it really does not take much more than simplistic Energy understanding and some basic math to point out realities. Too many people read too much into the sensationalism, but the Energy Supply just keeps marching along. Nobody is willing to give up their heat, ac, lights, cars, planes, etc etc. Or better, how are we going to find God Particles if we give up our Energy. The Hadron Collider is gearing up for DOUBLE the power for more experiments in the coming years. Just how are we going to power this device????
“Oops Sorry Folks, we have to wait for the wind to blow. Our weather forecasters think it might happen in a few days, but you know how reliable they are. Just hang tight brightest people on the planet, we will get you the power soon”
My view is it is not about oil at all. It is about Energy. If the US wanted to go to Nat Gas for Automobiles, it would be a pretty seamless change, but why??? Oil is cheap. Then move to Methane, then, Hydrogen made from Nuclear power. The list goes on and on. The Human Specie(s) (Sorry for the pun) is much less influential than they believe on this world. It is a really big place and we are rather small. That is the hardest part for Humans to believe, we really are a small part of this world and have little overall affect on the world. Despite what the media would have you believe.
Peak Oil in terms of cost, ok maybe, but doubtful, because we have sooooo much to discover. Who cares if it cost a little more. Technology keeps improving and we adjust to cost increases. but truth is it does not cost that much more and we continue to find more. Even Saudi has not looked for more yet, they don’t have to, they have ENORMOUS amounts.
Now if you wanted to discuss Peak Oil in terms of amount of a commodity demand, we may have something to discuss, because Nuclear Fusion could nearly obsolete Oil if it pans out.
In short, it is all much to do about nothing. Technology will solve the Energy problem in many many ways.
“Energy Supply just keeps marching along”
It takes a lot of work and money. Everyday it takes more of both than yesterday.
“Nobody is willing to give up their heat, ac, lights, cars, planes, etc etc”
When people have to choose between food/water/shelter and ac/lights/cars/planes they will choose to eat
“Nuclear power” – really? talk about subsidies
“Technology will solve” EVERYTHING.
I’m so glad
Specie, I think you lack the understanding that Food, Water, Shelter is a result of our Energy Boom, not the detriment to it.
Who has subsidized the Chinese to build Nuclear? Or, have they decided to do it because it is their best option? (Rhetorical of course)
cool chart from here http://ponziworld.blogspot.com/
I’ve read this website twice through – it’s really good doom porn!! I always come away thinking its the end. It certainly paints a convincing picture.
Mark, your analogy of today’s market to the 1998-2000 period is quite intriguing and it is also one that I follow, along with the 1928-1929 period too. I have also previously mentioned that analogy myself as being remarkably similar to what is/has been occurring lately.
Specifically, price trend accelerated sharply upwards starting from late 1994 that more than doubled the price, and then a very sharp correction occurred in late summer 1998 to early Oct of nearly -20%. I believe at that time almost everyone thought the manic bull market had ended and it was the start of a new bear market.
Looking at today’s cycle, the price trend accelerated sharply upwards starting from autumn 2011 and so far peaked in summer 2015 that about doubled its price from the low. The Aug/Sep 2015 correction amounts to nearly -15%. Again, at this time many people believe the bull market has ended and a new bear market has started.
Besides some other similarities utilizing other obscure techniques, if we focus primarily on price action, you will find that both markets formed a “W” bottom after the correction along with a rapid recovery back to or near its previous highs again.
Specifically, the relative highs and lows back in 1998 for SPX was July 20: 1190, Aug 31, 957.3, Sep 23 1066, Oct 5/8: 964.7/923.3, Oct 20/21: -26 dip to 1058, Nov 6 to 12: -26 dip to 1115.6, Nov 27: 1193, Dec 3: 1150, Dec 8: 1193.5, Dec 14: 1137, and Jan8-1999: 1278.
Contrast to today’s market action for relative highs and lows for 2015: July 20: 2133, Aug 24: 1867, Sep 17: 2021, Sep29/Oct2: 1872/1894, Oct13/14 -31 dip to 1991, Nov 3 to 9: -48 dip to 2068.
The action is lagging by about one week and the other difference is that in 2015 the retest of the crash low resulted in a higher low, where as in 1998 it hit a lower low on Oct 8 (although the first Oct 5 retest was a higher low).
If action were to continue tracking accordingly then there should be a bottom either today or tomorrow and price should rally until about the third week of Nov and make a marginal higher high than the July 20 peak before failing. It would then chop around sideways for about three weeks in a tight range of 40 to 50 points (but no significant correction), before a massive year end rally during the last two to three weeks of Dec into early New Year pushes markets to significantly higher ATH’s (i.e. minimum 2200’s).
You know the rest of history when an euphoric surge occurred during the next 14 months climaxing in March 2000 and the equivalent time frame today would be a March 2017 peak and a minimum price target above 3000.
“If action were to continue tracking accordingly………”
Lot of work there,Steve, so thank you for that….
But just wanted to mention that back in Oct 1998, HY bonds had bottomed and turned back up…. The stock market went back up with them, as you detailed quite well….
And that’s been happening during this past October too, so what you’re outlining might very well happen, ~but~………as of 11/03, HY peaked out again,and is rolling over right now… If we continue lower here, I can’t help but think it’s going to take the stock market back down with them…
Clearly, if we turn back up again, then I’m sure your scenario has legs….
But if not, just wanted to throw out an alternate scenario….
Certainly something to watch this week….
Thanks,
Barry
Steve T, is this cognitive dissonance?
‘I believe at that time almost everyone thought the manic bull market had ended and it was the start of a new bear market’ (98)
‘Again, at this time many people believe the bull market has ended and a new bear market has started.’ (now).
One statement of *belief*, one of factual error (the vast majority *believe* we just saw a correction within an ongoing bull).
Fuck belief (excuse my language), give me JH’s rational analysis any day.
Steve T – thanks for those timing details etc, as I’ve been less confident about the start time of a bubble phase than the end of it. I use two cycles for short and medium term timing, both based on the difference between lunar and solar time – they accord with your period of sideways price action (for SP500) but indicate that that could persist into mid January before really strong positivity sets in.
The longer cycle renews every four solar years, so I am also interested in October/ November 2011. Price action was very similar then, but with the lower low W you described above, and many other things were different then of course, but this combination of lunar and solar timing was the same.
Sentiment – increasingly belligerent bearishness – must be nearing boiling point now (the widespread disbelief that the market could naturally do what it has done, never mind go even higher) so there is tremendous fuel there for an unexpected stocks rally.
‘increasingly belligerent bearishness’
In your imagination only.
Just the facts…..
https://solarcycles.files.wordpress.com/2015/11/1nov6.png?w=547&h=357
I think the point Mark and I are making about overall bearish sentiment of a possible start of a new bear market by the masses, at that applicable time, is the fact that market trend accelerated upwards at a steeper angle for about 4 years and prices more than doubled. And that is already on top of an initial gradual rise occurring 2 to 3 years prior to that trend acceleration.
So when you hit an all-time peak and then the market swiftly corrects -15% or -20% after a seven or eight year bull run, it is only logical that most people would think that the bull market is over. That was what occurred in late 1998 for sure, as no one in their wildest imagination could have fathomed what occurred instead. The biggest net price gains (not percentages) in any bubble generally occur during the final six months of its cycle.
I don’t really give a sh&t about 98.
Here’s now:
https://solarcycles.files.wordpress.com/2015/11/1nov6.png?w=547&h=357
‘it is only logical that most people would think that the bull market is over.’
Hmm, I would question your logic, given the figures show the opposite.
Please keep posting here, Mark. Always good to read and understand a contrary POV based on deep research.
Do you not wonder at what deep research produced the conclusion ‘belligerent bearishness’?
I know what it was, he read a couple of comments here, put 2 and 2 together and came up with 3500.
It is not that we are running out of oil per se. Steve St Angelo isthe only one I now that ties everything together in regards to economic activity, global debt
.
EROI is a very unique way of looking at global energy markets. You need to take the time read over all his previous essays.
Again it is about the ability of the global economy to sustain expensive oil not whether it has the oil. The oil is there, but as we have witnessed recently mere supply is not enough.
“The world is sitting on a mountain of debt and paper assets. Both need a rising energy supply to be paid back or liquidated. The coming collapse of world economic activity will destroy the ability for the public and private oil industry to produce expensive oil… thus production will fall considerably”
How we twist and turn our economics around the facts of Energy do matter in Financial Markets and our economy. The confusion trap that people fall into is not understanding factual realities and falling into dreamy ideals. The Energy demand waxes and wanes with these twists and turns, but the fact surrounding technological capability are fairly certian.
Well, as long as people speak with some sort of absolute certainty – there is no point discussing. Been there, done that – better to speak to open-minded people who can at least consider other information.
Good luck all.
J
Jeger,
There is no certianty in life, only percentages. However, when the percentages are overwhelming, I agree, there is not much to talk about other than to open people’s eyes to the reason behind the high percentages. So the discussion becomes about hard realities. Some people have trouble discussing in that environment because they cannot get over their bias. Hence, we agree, people have to be open minded to discuss.
The one thing you cannot do is change the facts. In Energy there are many facts that have nothing to do with economic impacts, but merely a science/math problem/solution.
Today I presented quite a bit, but in all honesty, not enough. I am sorry if that was mis-understood as rigid. I know my Energy facts quite well, but one thing I will promise you is that does not have much to do with predicting Financial Markets, that is pure Alchemy.
The Market Humbles All
Just as in August, no one is talking about the market today, fascinating.
I think it’s notable that last week’s intraday ES low has already been taken out today, and we’ve had a lower daily closing than any day last week.
I noticed earlier today that HYG has had 4 down days in a row and peaked back in late October.
I predict a big down week, hope some of you are appropriately positioned.
The ’98 analaogue (utter tosh in my opinion) will soon be consigned to the dustbin.
GM, very pertinent comment. The banksters have conditioned everyone to believe that they have everything under control and won’t let the markets fall. Those that think otherwise are mostly afraid to voice their opinions due to fear of ridicule or worried they’ll jinx their positions. Or their just too tired of it all to care. Pass me another Prozac, will you?
It really is amazing to watch. Future generations will never, ever understand what this current society was doing. (I really can’t say, thinking)
If you visit some bull blogs specie, they don’t need anyone to condition them, they are knee deep in self-reinforcing speculative mania.
As for future generations, well, we look back on the fools caught at the top in 29, 2000, 2007, we learn and we should prosper, but those of lesser intellect(?) or unable to control their urges will pay a high price for getting caught.
John Hussman mentions often that someone somewhere has to be holding every issued equity at any point in time, so dip buyers are also likely to be scalded by hot potatoes.
Tough game, but those that choose not to play (the savers) will be burned too eventually. The next 30+ years are going to be tough, really tough.
Hi GM;
Just saw this note, and was typing out something to Steve T just now, along a similar line of thought…
But yes, i have noticed the HY rollover occurring as well, and can assure you, i am positioned very, very well for further declines…. 😉
Good to hear Barry, let’s hope it works out.
Do let us know when you switch, or take profits please.
Looking back at historical tops, that appears to be what we are experiencing now. The market will hit an important high. A sharp declines happens. Then a sharp rally back. The rally back can be a slight new high, an Elliott 5, or a double top, or a lower high, an ellliott 2 up, etc. It frequently looks like a head and shoulders. They take about 6 months to a year. We could be at the 2 or a double top or are going to a slight new high (elliot 5). Whichever, we are in a topping pattern.
Valid point, Kent. The only thing I would caution is that IF we are in EW 5 then that could go further by another 10-15% at least. So money management has to remain a primary focus.
JH, why not split your capital up and just buy puts in a measured way?
“The one thing you cannot do is change the facts. In Energy there are many facts that have nothing to do with economic impacts, but merely a science/math problem/solution.”
At the risk of needing another prolonged break from this site, I will try to explain what I mean.
“Facts” are just pieces of information that we may or may not have understood correctly when we ingested them and need to be regularly challenged and reevaluated to avoid the thousands of lasting misconceptions that humans are prone to. The earth was flat, immovable continents, geocentric universe, expanding planet earth and so on. I think we can all agree that these are things we thought we knew, but didn’t?
Many people seem to think that it is enough to repeat the mantra that it is important to keep an open mind when debating, when seemingly at the same time be unaware that they are doing the exact opposite.
Rather than write a post that will be several pages long, I would ask a couple of questions instead: why do you you say that “solar energy will just be a feelgood and insignificant source”?
Additionally, you make the following statement:
“Oil is nothing more than the most effective way to use Earth’s Stored Solar Energy.”
What do you mean by this? In which way most efficient?
This will probably be a quicker way to see if we can actually debate this at all.
J
J
You definitely need a break from this site. How about coming to Australia (that’s if your not already here) and going bush for a while to get a reality check. You are worrying about nothing.
The only thing I worry about is people’s lack of consciousness. I just had a 3 year career break and trekked 8000kms, but that doesn’t stop me seeing this over and over again all over the world – but for very different reasons depending on how much money one has. The problem I am trying to highlight is that the ideas and values we have stem from our current society. If you don’t see that it doesn’t work for most people then that is your choice:) It doesn’t alter the “fact” no matter how much you don’t see it…:D
Last time I was there, Australia also used money with the same futile patterns that people follow as a result. Perhaps that has changed quite recently?
Sorry for hijack, looking back it was sparked by the discussion around whether resources are finite. Talking about futile patterns, we all follow them in some way:D
Good luck all
J
Jeger,
I did not see a hijack from you at all and I appreciate the debate. The facts I am referring to is the fact that China is building 35 nuclear plants and has like 30-40 more in the plans. Germany is building 10-15 coal plants. The USA has increased fuel efficiency. etc, etc, Those are the facts I am referring to. The rest as you allude is completely open to interpretation. Like currently, the accepted idea on oil is that it comes from ancient plant and animal life, meaning it is made by the sun, ie stored solar energy. However, as you pointed out, what many see today as true is changed tomorrow. There is a theory created by a Russion that oil is made through natural earth processes and therefore is renewable. Adding some support to this idea is the fact that the earth has created tremendous amounts of methane on the ocean floor, for which is entirely un-explained. So we most definitely agree in this area that science often gets it wrong. So my opinion, that I can understand may have been mis-read as a statement of fact is formulated by looking at the realities of the facts and making a call on the future. Yes, in my opinion the Solar and Wind will only be supplemental and it is a feel good energy, because people so desperately want to believe they are saving the planet. The facts of Nuclear Fission and Natural Gas generation being deployed, make Solar and Wind supplemental, at least for another 50 years. That is simply because the other solutions are just that much better at producing power. The very power that everyone expects when they flip the switch. That opinion becomes even more evident when you add in the possibility of Nuclear Fusion, which in my opinion has a real chance of becoming a reality in the next 10 years. If that happens, it is a game changer, for instance, airplanes will no longer need carbon fuel and will be non-stop from anyplace in the world to any other place with 2-3 years in between fueling.
I too will apologize to the forum for over-discussing this topic. If anyone hijacked the forum yesterday it was me.
I left out why oil is the most effective way to use solar energy. It has everything to do with the energy content per unit mass, commonly called specific heat. Oil has a very high specific heat, showing us once again the power that Mother Nature has in beating our synthethic chemistry. We are still dependent on Mother Nature’s incredible feats as humans are part of her creations.
We are stardust, we are golden, we are billion year old carbon, And we got to get ourselves back to the garden.
Gary, 🙂 🙂 you are right, we really ought to leave it all to the ‘non-scientists’ to figure all this ‘stuff’ out.
Oh to be a lyricist or poet and see the world as it ‘really’ is!
We have seen a near vertiginous rise over the past 6
weeks, so some pause and slight retrace is not
something I would read to much in to, particularly
with a Dec rate increase more likely.
If we were still falling sharply towards the end of the week
then it may be something more significant.
too much even!
All eyes should be on Copper as its Triple Bottom fails and Copper breaks to new lows.
Global “growth” is worse than it looks:
http://www.businessinsider.com/moeller-maersk-ceo-says-global-growth-worse-than-expected-2015-11
No argument from me Richard, the transportation industry has been taking it on the chin for quite a while now. And in that article I noticed they are laying off 4000 workers. So just more of the higher paying wage jobs disappearing. Nothing new really.
It looks more and more like this commodity bear mkt will last at least until 2017, before a good rally occurs in the overall bear mkt due to last until 2030. Some commodities are due to rally early 2016, but I am getting skeptical.
Folks, I know some of you guys will be very aware
of historical market stats, just wondering are there
many precedents for a major sell off around November
time?, my memory may be playing tricks on me but
I cannot recall many ..
Which ones can you recall please Phil?
Whilst you’re thinking Phil, I’ll start you off with 2007 and 2000.
Sigh.
Ref gold “commercial positioning having moved to short”. Commercials have been net short for 14 years. Afterall, their job is to produce and sell (hedge futures) gold. The recent history is that commercials started being net long in the mid 90’s. This is extremely bullish, but it can take a while. In 1999, they started heavy net long possitioning. Finally, in 2001 they started selling and have continued to do so. The rule in COT is to buy when they stop buying, 2001worked great. That is right, they sell scale up. In other words, the higher the price goes, the more they sell. As a side note, in the entire history of COT for silver (1982), silver commercials have never been net long. If they ever do, that great and fabulous precious metals bull mkt will probably be in the offing.
You’re right about commercials positioning. However, the gold market is a little bit different because commercials not only includes mining companies, but it also includes the bullion banks.
GM, I found some data on the FTSE All Share,
which appears to show only 3 November monthly declines
(over 4%) since 1990 – 4% is around a level I would
consider significant as a monthly % fall.
If that data is accurate.
Worth considering that the 2000 and 2007 November falls were larger at a cyclical turn.
Are we at a cyclical turn?
Place your bets.
What are trailing P/E ratios for the major US stock indices at the moment? Just above 20? A typical bubble would see them triple over the next 14-16 months: http://www.macrobusiness.com.au/wp-content/uploads/2015/09/trailingperatios.png
What good is a trailing P/E in a falling earnings and revenue environment. This is not a 2000 like bubble, where everything is booming. This is a failure by the FED bubble for twisting the markets into unsustainable situations. The current preceived value does not truly exist. That is the argument many, for which I find myself in that logic as well. Time will tell.
Correction:
The current perceived value does not truly exist. That is the argument of many, for which I find myself in that logic as well.
Earnings and value are of little importance during a bubble – otherwise the NASDAQ bubble could never have happened.
Confused why you brought it up then.
Because it clearly shows that US stocks at P/E around 20 are not yet in a bubble. And it clearly shows what will happen to the price of those stocks if they do go into a bubble phase. And it clearly shows the typical length of that bubble.
If you are confused, its not because you can’t understand it, its because you can’t bring yourself to accept that it could happen…again.
Mark, what do you expect the “narrative” to be that’s causing the bubble? Because that’s what one needs to get the herding impulse in high gear. In the late 1990’s, it was the internet of course.
Sorry for the late response, been very busy. No, my confusion is you say value does matter in the first statement or why bring up P/E, then you say value does not matter in a bubble. So which is it?
I say the value you see today is twisted and truly much worse than the P/E is telling you. Revenue drops, profits drop, P/E gets destroyed. I see no fundemental REAL value in this market, although I am starting to see it in individual stocks. Market will probably follow. IMHO
Definitely cause for the bears to be concerned, but since the chart includes Tech and Japan indices, to be fair, we should put Shenzhen and Biotech today. The former is at 51, and the quality of that number is poor.
John,
I think you are right via many recent posts, but having tried to wait out this sideways market given I am not a day trader, I think without giving “advice” specific to day trading, some longer term trends would be a great write up for purely further R&D purposes. Gold is dead, in its seasonal low right now, it seems. To me, even though Bradley turns are not indicative of market loss, but directional changes, I see the change from the big drops we had weeks ago, have switched direction to the euphoria seen up until the new year.
Think desperation and HOPE aside from immediate “geomagetic-irrationalization” requires further navigation, a subsection perhaps. Any fan of ghost hunting or pursuit of psuedo-science about pursuing spirtual-hauntings utilize EMF tools; I can only contemplate what mobile phones and similar electronics are doing to us.
My sideways wait has also been slightly on the fact that inflation targets are not being met and demographics indicate further deflation and US dollar strengthening. By that factor, any assets retained, without market growth, should be stronger by just being parked. This slows down the market itself and velocity of money, but I don’t see negative rates being endowed upon investment accounts like potentially traditional banking savings accounts.
The status quo is kind of making the blog go surreally sideways and in the past I have indicated Bradley velocity indicates no major drop like we experienced in velocity for 70+ years from 2008 period. Crashes yes, but of much, much, lower magnitude.
Granted I have absolutely no time to work on helpful software as we discussed, but I am convinced that during this sideways phase, gold is gonna die off further, and thru technical automation/improvements, green movements in energy, demographics drops combined with “on-shoring” are going to impact trade deficits, currency strengths, and BRIC-like countries. Factor in Africa for growth in global markets and we REALLY need to focus on solar cycles reduction equating to deflation and demographics, but think further ahead how we’re of setting until at least 2040 when the Landscheidt minimum will be over.
Revising your long term chart about future decades, black swans, etc. would be welcomed also.
No one saw Google becoming a subsidiary if you know what I am saying. I think analysis not only of solar cycles is and needs to continue to be discussed, but they have been deviated from a lot here I guess due to sideways status quo of wait and watch, but futurist discussion in conjunction with mom/pop ( non day trader ) thoughts would be a good temporary distraction; in conjunction with thought raised here.
Perhaps also, more brief updates, with further dives into updating your “Trading the Sun” paper as much useful information in the posts is getting lost, some organization would be welcomed. I do not have time to write my own blog setup to expand into related data, but would love to help expand upon your here in a subsection, like we discussed demographics a couple years back.
I can ping you offline to discuss further just in case you miss this posting.
Have a good holiday season and hope the family is doing well and everyone is in good health. Cheers, mate.
I think the time has come to consider the rally in the USD as over and for Commodities; such as the Grains, Tropicals (Softs), and PMs; starting another historical rally.
The WASDA report just came out and major stops in Corn and Soybean futures are being hit. I think those Ags are over sold and the time has come to go long. Delta wise I think that their low I-10s is bringing in their low M-2s and they are turning back up to their high I-11s, M-3s, and L-6s. (Note that I correctly predicted high Medium Inbetween points which is not an easy thing to do).
The lower price goes, the more stops are hit, the better a “turn around Tuesday” it could be (daily Hangman candlesticks).
Hey I just was told that Japan is starting a new bull market and therefore Mr Abe will be around for a VERY LONG time and be hailed as one of Japan’s great Prime Ministers.
I would love to know what others here think of that statement. Thx in advance.
I didn’t know you and Mr Kuroda were so close?
No! No! You’ve misunderstood me GM. This is from some bloke who follows ‘an analyst’ who told him about Japan and Abe.
My relationship with Mr Kuroda is on a completely different level. Some call it the 6th dimension……but I don’t know about these things. 😉
Sorry purvez, I just assumed that such a bullish outlook must come from on high.
I would not agree with this bloke on his prediction for the Japanese economy.
As for PM Abe, his grandfather was like him, a warmonger, so perhaps he will be loved by his people, and will take emergency powers to rule through crisis. You heard it here first.
It is starting to look like a “turn around Tuesday” (Chicago term) for the USD and many commodities including the Grains, PMs, and Energies. Should stocks keep falling and Treasuries reverse and rally then the odds of the Dollar topping out and declining will be increasing.
my favourite graph of the day: https://northmantrader.files.wordpress.com/2014/04/spx-m21.png
http://rightsideofthechart.com/spx-intermediate-term-trend-update/
should have taken have my shorts off the table this morning we failed to take yesterdays lows on crappy volume. slow volume days always seem to grind higher. draghi going to attempt to get the markets to drink the kool aid again tomorrow. his track record of lies and tap dancing bs has been solid. had i known he was speaking earlier, i would have lighted up.
futures still below 2077 which puts 2020 on the table according the peggy and the spiral.
if you look at the 5 minute es futures chart, really struggling with the 2075 level today
Scott, my reading of the DJIA is that we are just completing a flat correction so we should see another down wave soon.
As John H would say…’Never investment advice’ though.
thx purvez… just disappointed in my trade location. should have had some powder available to set positions. hopefully draghi doesn’t cause another bs meltup from his lies and posturing.
Ha!! I should just keep saying we’re going higher. Every time I say that we get a mini (micro?) waterfall event.
Oops the above comment is in the wrong place. I’ve managed to put it in the right place below. Please ignore it here.
flat correction in an ongoing move down? Or flat correction and when it’s done, stocks will head higher?
What do you think of Caldaro’s count?
http://screencast.com/t/CvJMoBZ2F5
Megaphone expanding pattern, heading lower.
pimaC, I was expecting the DJIA to turn down from around 17780 for the flat, but as usual it continues to surprise to the upside. Although overnight it has gone above 17800 slightly it hasn’t broken any EW rules or guidelines so it can still move down and just be an expanded flat rather than a flat.
I’m not on the same page with Caldaro regarding us having started the 5th wave up. I believe the drop to 24 Aug lows was at a minimum an A wave and we are currently working the B wave. So I’m still expecting a C wave back towards the 24 Aug lows.
Until very recently I was of the opinion that the May top represented a ‘b’ wave at Super Cycle degree and therefore we were going down to some ridiculous level. However the waves since the May high don’t count as impulsively down in 5 sub waves. More like 3 sub waves. Hence my change of ‘heart’ on that count.
Hope this helps.
pimaC, the DJIA, out of hours has just invalidated the ‘expanded flat’ by creeping into the territory of wave – i. However the rise from yesterday’s lows still looks overlapping and corrective. So it may well be what GM was suggesting. i.e. An expanding leading diagonal. But be aware that it is an EXTREMELY rare pattern and therefore more likely to morph into something else.
My current ‘guess’ would be that we are heading higher but on what basis / count is something I haven’t worked on.
This got posted earlier but it is more relevant where I hope it arrives!!
========================
Ha!! I should just keep saying we’re going higher. Every time I say that we get a mini (micro?) waterfall event.
further evidence of John’s selective rally. Fang and Nosh y’all. the game of musical chairs has shrunk to 8.
http://www.zerohedge.com/news/2015-11-10/if-it-wasnt-these-8-companies-market-would-be-down-2015
and no the A isn’t for apple. it’s for Amazon. almost looked like some algo was selling apple today to buy spy to keep the market propped up and green on super low volume. an algo spike causing a .40 cent rise in the last 2 minutes in spy
many of you have may have seen this from last weekend, but northman trader posts some great material (i’ve seen john use it as well) the link above does a great job showing the divergences john has showcased, but really shows the extremes between spy and hyg through last friday
As Wednesday starts in Asia the USD is falling against almost all currencies (“turn around Tuesday” in Chicago). It looks to me like the US Dollar index futures and the DOW are making “second chance” tops and will decline, together, from here….
And for all the GOLd bulls (you must all have a private income), heres a different take on GOLD demand……..El Nino
http://www.biznews.com/global-investing/2015/11/10/weather-to-blame-for-poor-gold-price-better-believe-it-ask-the-indians/
Strange isn’t it; this contradicts the American federal government’s NFP report:
http://finance.yahoo.com/news/main-street-job-growth-stagnant-171622748.html#
Hope that question’s rhetorical, Richard I.
purvez, your earlier RE Japan.
Did you know that the BoJ are now by a country mile the largest holger of Japanese ETF’s?
WTF is going on? Since when did it become accepatable for CB’s to directly buy stocks?
I know it has been going on for some time but it is only recently that CB’s now openly divulge their holdings.
I am stunned that this just goes on unchalleged by ANYONE!
There is no hope of these markets cratering under CB support. Just look at what occurred from the September lows.
Allan, after I spoke to my friend I went and looked at the Japanese Nikkei chart and it does look like it’s completed a ‘double zig zag’ bottom over a near 3 decade time span with a HUGE drop from the top.
IF the Japanese market has turned up then it’s because of positive mood in that region. With ‘that’ tail wind any ‘fool’ can be made to look good.
All this nonsense of mega QQE will be hailed as the saviour….sadly.
There is a reason they call it:
‘At the right place at the right time’.
Re: your ‘unchallenged by ANYONE’ will come home to roost for most of the western economies and looking at the Aussie markets there too.
Mood at this end of the woods is turning decisively negative and some ‘heads’ WILL ROLL. Now till 2020 looks ‘interesting’…..in the Chinese sense of the word.
When I said “unchallenged” I mean from an ethical and legal stance. I have no doubt that at some point a number of large hedge funds will challenge them again because the downside rewards are huge, even if it does lead to dire ramifications, but the majority of hedge fund managers care only about potential rewards for themselves and have little conscience about consequences for others.
I thinks this time around we may get the ‘ethical’ challenge AND RETRIBUTION.
Fire and brimstone are being readied as we speak, by the gods.
Gosh I can understand how the true Prophets must have felt when they were uttering words of dire consequences on the ‘unbelievers’! I’m feeling all ‘goose pimply’ and I’m definitely no prophet. Lol.
So as I expected the recent drop was a bear trap for the DAX and maybe for the Dow and S&P depending on today’s action. Need to see a more meaningful drop to start shorting this market. I see little evidence for further rally but this market has tended to rally in the most unlikely scenarios for some time so can’t rule it out.
Sure feels like it Krish….and if it feels like it then…it probably isn’t. Confused?
You will be …. after the next session or 2.
Long the Brazilian Real might be a wise trade. For the past eight months-in-a-row Brazil has run a positive trade balance. The unrest hasn’t resulted in the overthrow of the government. Should things settle down and tourism revive then the rally in the Real will likely continue. Delta wise I think that a Long Term 1 point was the high four years ago and is the low this year meaning that the Real is rallying up to a high Long Term 2 point (crash point upwards).
A rallying Real will pressure many commodities to rally. This year, World Sugar futures (Sugar #11) is said to have an 80% correlation to the Real.
A major “rotation” might be underway of out of US dollar/stocks and back into Emerging Markets such as Brazilian real/stocks etc.
Note that Brazil is the second largest exporter of Iron Ore and international trade in Iron Ore did not decline with the “Great Recession” but continued to expand. Australia is the largest Iron Ore exporter. Iron Ore producers have been doing the same as Crude Oil producers: Fighting for market share and driving the high cost producers out of business.
Note that India has the same population as China and now wants to replace China as the center of world growth like China did for decades with annual growth greater than 7.5%.
Not much happening for the past few days on the SPX etc, certainly not much from a price point of view imho. Oil is working out as expected but am probably far from taking profits on that anytime soon. So sit on hands and just wait……..
J
Investors are pessimistic:
http://finance.yahoo.com/news/investors-really-pessimistic-schwab-121716447.html#
For a contrarian this could mean that stocks will soon explode higher.
Valley, the ramp earlier was in line with New Moon effect. I can’t remember you giving us a road map for this week, although that’s probably just my 2 brain cells limitation rather than your oversight.
Please can you tell us whether this micro down draft today is in line with PALS?
Thx again and apologies if you are having to repeat yourself. (Use ‘copy paste’ please if applicable).
I changed my Delta Intermediate Rotation such that I-4 was the low that started this spectacular rally and not I-3 (a high Replacement Inbetween Point for I-2 and I-2 and I-3 were back-to-back). This means that I-7 was the recent high. “If” the S+P 500 and DOW “drift” lower to I-8 then the odds will be high that I-9 will be a new ATH. And if a new ATH occurs then the Solar Cycle’s crash effects will be in the past regardless whether it effected the Energies and not Stocks or also, slightly, effected Stocks too.
High I-9 as a new ATH could also occur with a rare counter Lunar rally up to a Full Moon instead of down to a Full Moon. This might also mean that the I-9 could be late with the next New Moon as buying accelerates with the new ATH as widespread Pessimism turns to wild Optimism.
In a nutshell, are you long again? I am still short as I expect this to be past second chance.
I was long treasury futures and got stopped out with the NFP report that I think is bogus (first loss in a while)(I am not a “perfect” trader just a profitable one). I am not positioned on stocks. Yesterday, I went long the Grains for many reasons and one is that I think that the WASDA report was also bogus and self-serving to those in USA political power. However, that report helped to run many stops at life-of-contract lows for some Ag futures on a Tuesday and I know what that potentially can be.
I am “listening” to the Copper market meaning that if Copper futures don’t break lower then a major/historical bottom may be coming in. Today, December, 2015, Copper futures made slight new lows but with no “follow thru” which is a warning that a major and historical bottom has been found.
Even though India is experiencing a rare second year of Drought I think that India and Brazil may be economically recovering and start to rally along with a possible continued rally in the USA. For instance, in Brazil: “it is always darkest before the dawn” and “buy when there is blood in the streets”. But I don’t expect to see blood in the streets of Brazil before the decline is over and their next rally begins.
Big old nutshell there. (You asked for it John Li).
You’ll need to ask him again tomorrow morning of course, as he’s likely to have done a swift switcheroo, from doom to ecstasy and back again in 12 hours with Richard.
They are pricing in a 70% chance of a hike in December, but I think markets will follow, and Yellen will follow her “rule based SP500 model” to skip any rate changes again. As much as she mocks the Taylor rule as too mechanical, she is just depended on a different indicator.
I mean “markets will fall”.
Fed rate moves John? You think they will have anything other than a 2-3 day impact on the markets?
When toast is done, it matters not whether you’re hungry, it is still toast.
It’s a toasty-looking market to me.
HYG now down 6 (yes, 6) trading days in a row, copper/oil plunging, there appear to be red flags galore.
Yellen, poor dear, she’s shi&&ing herself as I type, bemused at what the real world (and the margin clerks) are throwing at her. I do hope she is spared in the aftermath, she doesn’t deserve to be the patsy.
For months I have been consistent in calling for a major bottom in the Brazilian Real. The bottom occurred in September. As the rally looks to make a “higher high” then I must ask what type of rally (not bottom) it is. This begs the question as to what it means in the “grand scheme of things” and that includes the US stock market and, of course, the Solar Cycle’s “crash” (as in only the energies and not stocks).
PALS and SPX:
Phase: bullish until Friday, bearish next week
Declination: bearish this week, bullish next week
Distance: bullish next 10 days
Seasonals: bullish after today, next 10 days
Summary: given sell off, I went long this morning on weakness. PALS is changing to a day trading system so intramonth swing trades are not that interesting to me now. Instead I use PALS as background for making day trades using options. Most of the money is nimble daily trades based upon news sell offs or fading overbought or oversold situations.
Valley, thanks very much for your PALS summary.
However more importantly I am pleased (but apprehensive) to note your ‘day trading’. There is much to be gained here BUT if you DON’T have a VERY VERY STRONG aversion to losses (i.e. VERY STRICT STOP LOSSES) then I would recommend that you abandon this path.
I’ve said this before…I change my mind 10 times a minute. If you are willing to do that then you WILL catch big waves provided you allow yourself LOTS of very small losses as you progress.
I DO WISH YOU ALL THE BEST WITH THIS ENDEAVOUR.
Thanks again for all your input here.
I would be very interested to hear how you progress with your day trading.
Thanks, Purvez. Have you considered futures trading? There are several futures trading web services ($100 to $250 per month) that offer statistically based set ups on SPX, Gold, Oil, Bonds. They post their track records some of the better ones “never have a losing day”. This seems boastful, however, after watching their disciplined approach and technical based setups, they actually do make successful trades most of the time or have quick stop outs. That is the direction that I foresee having the most success. The one I use is open 24 hours per day in the US during the week and trades the SPX continuously. Is run by former member of the futures exchange advisory group for the Chicago Merc Exchange. and is a lot of fun.
Valley, in the UK we are lucky enough to be able to trade tax free via Spread Betting. That too is open 24 hours a day (a mixed blessing for sole traders).
The discipline has to come from the ‘trader’. I’ve subscribed to many of these services but in the beginning regardless of what they advised, once I was on a losing position I ‘just held on’….in hope.
It took me a LOOONG TIME and quite a bit of my wealth to learn differently.
Once you learn to ‘cut losses quickly’ you are well on our way. The next thing to learn is to ‘sit on your hands’ when the trade is going your way. Believe me if cutting losses is difficult ‘NOT’ taking profits early is nigh on IMPOSSIBLE!! To this day I am guilty of the latter.
I hope to perfect it by the day I die. LOL.
Valley, could you elaborate on why the PALS trading system is migrating to a day trading system? What’s happened to shorten its timeframe?
Thanks, Purvez. Words from the experienced appreciated.
Gary, I like futures trading because of the 24 hr action and leverage. Have found most days I can make more trading overbought oversold conditions within the context of PALS and some intraday data points such as high and low tides than with swing trading multi day moves. For example, market tends to rise from low to high tide in NYC, and sell off from the high tide to low tide.
For Ellioticians here is a new thought: Copper is completing a “five of five of five of C” lower after four years and is basing to soar higher, again, in a major Elliot Impulse wave. After four years Copper is completing a corrective Diagonal Triangle or Falling Wedge which by Elliot’s absolute Rules means the correction is completely over and a new Impulse wave higher will begin. Of course what does that mean for the World Economy and USA stocks? Onward and upward?
Could it be that Brazil and India, economically, together, will replace China as the world’s growth engine for years to come (such as up to 2025 which would complete the usual Delta 19 year, five hour, Cycle that it’s many waves are made of) and this will be the source of the next Impulse wave higher in Copper? Are the S+P 500 companies aware of, and preparing for, this eventuality and that is why stocks are done with their crash and are rallying onwards?
Richard I, as a ‘die hard’ EWer I am still expecting (at least on the DJIA) another visit down towards the August lows before ANY major move higher. I’m not discounting a small mover higher to ATHs if this ‘up’ wave wants to morph into an expanded flat. But any sustained move higher IMO can’t start until we’ve re-visited the August lows.
Now would that scenario fit in with Copper and Brazil / India? (None of which I follow in enough detail) If so then we have some common ground here.
Here is another question for Ellioticians: Is the Brazilian Real making an upward corrective A-B-C to be followed by new lows or is it already in a 3rd wave higher after a major low (four year decline) has occurred and is complete?
“If” the Brazilian Real is in an Elliot upward impulsive 3rd wave then what does that say about Copper’s Elliot wave count? What does it say about the world economy and the US stock market rally?
Richard, can you please stop posting so many often contradictory opinions. It’s getting out of hand. Please.
Robert Prechter won a trading contest in options because he kept his mind fluid and did not commit or get “the big head” on any position.
There is more under heaven (celestial bodies) than in anyone’s philosophies (narrow minded trading theories such as exclusively the Solar Cycle and nothing but the Solar Cycle).
Richard I, I would like to request that you CAUTION your statements. Your flip flopping is mildly inconvenient…..BUT if you decide to CRITICIZE our HOST then you are in ONE HELL OF A DEEP HOLE.
Although I’m sure I speak for many at this blog….but even if it turns out that I don’t (unlikely), I will tell you now….YOU OVER STEPPED THE MARK THERE.
Don’t chase him away. The evolution of bears to come and expect new highs on every dip is a pre-requisite for a proper crash. We need to monitor this further.
🙂 🙂 John Li, ever the moderate. Thanks very much for your common sense approach to this blog.
However I do feel quite ‘passionate’ about anyone NOT respecting our host. He provides us with a UNIQUE forum and whilst we are free to disagree with him it HAS to be done without being flagrantly disrespectful.
I do hope most here understand my position.
Agree with John, and I don’t think Richard was being critical of JH, as we all know that JH uses so much more than merely the solar cycle.
Not really sure why Richard made that comment.
I do skip over Richard’s comments these days, I find it bizarre to see someone switch big picture views so often, daily sometimes.
But I’m sure people skip my comments, so live and let live.
Point well made and taken GM. Thanks.
Glad to see you didn’t skip over my comment. 😉
I respect John Hampson and I assume he respects me. If John Hampson is truly “educated” in the UK then he knows about the “Dogma of Human Perfectibility”. If he is truly educated in the UK then he also knows that “religious enthusiasm” will defeat “democratic ambition” which is as unpopular in this day and age in the USA as it was in Revolutionary France.
John Hampson has said that he pays no regard to Wave Counts. As it concerns Elliot and Celestial Bodies that is no problem but as it concerns Delta it is a mistake because Delta is based on the alleged total interaction of the Earth, Sun, and Moon.
I have challenged anyone to look at the four pages (200 years) of the Super Long Term points for Stocks in the Delta book and see if they can identify the patterns of the points. If anyone has they haven’t posted about it. From multiply point patterns I can make the claim that there won’t be any serious percentage “crashes” from now until 2025. If the Solar Cycle effected stocks and is going to “crash” stocks then it goes –most strongly– against Delta Super Long Term point patterns that say otherwise.
Dax…..stuck….?
http://screencast.com/t/Q6TLkV3zQpnp
RUT, close, but no cigar. (If this goes, could easily fall to the 865 support shelf, angle of descent allows for this.
http://screencast.com/t/DemdzfNdE
Weekly view:
http://screencast.com/t/mR85VDganITl
Nikkei, gap to close a gap, always a dodgy sign, exhausted now?
http://screencast.com/t/0qJANDhR
Ftse, will weekly closing support hold next time?
http://screencast.com/t/l2qb716A
Richard Isaacson, I am happy to take up your challenge if you can post the 200 year chart. Most of us don’t know what Delta is.
Some of us would say that one could draw seemingly valuable conclusions from almost any past history or pattern if one looked hard enough. All processes, systems or whatever you like to call them that I have ever seen do not work all the time.
J
Draghi opened his mouth this morning and the DAX rocketed as usual. But it has fallen back to the lows since. Are we starting to see signs of the market losing confidence in Draghi’s nonsensical words? I guess the next few trading days will answer that.
Or proof that markets react as they feel, given levels of risk tolerance.
When markets are ‘risk off’, no one on the planet can stop the move down.
When markets are risk on, uber-hawkish/tight CBs will not stop the party.
Interesting times.
Copper a-plunging again today, I feel an equity waterfall in imminent.
Given Draghi’s history of (mostly) all talk and no action, it’s a wonder that the market reacts to him at all.
Our own Fed may soon have the same problem though if they don’t raise in December. Just this morning the Fed’s Evans says he wants to see inflation at 2 percent or at least turning upwards in order to raise. He’s only one vote, but if that thinking wins out and they don’t raise in December, will they lose all credibility?
Like I keep saying. Steve StAngelo is without doubt the most versed and well researched analyst bar none when it comes to global Ag demand, roduction amd supply.
You won’t pull the wool over this guys eyes:
https://srsroccoreport.com/biggest-silver-supply-losers-for-2015/
http://charts.stocktwits.com/production/original_45324161.png?1447328117
Mark Twain said it best .. history doesn’t repeat but it
does rhyme – one of his best.
UKX looking ill, again.
Oil selling off hard, looking a little better if you are short folks.
Richard, are we long, short or sideways today ))
only joking.
GM posted this further up:
http://screencast.com/t/CvJMoBZ2F5
Today’s drop has IMO put in the final 5th down wave. The MOST IMPORTANT thing about these ‘Diagonal Expanding’ patterns is that the reversal is both swift and deep.
Trade accordingly and safely.
GLTA.
Just a corollary to the above. GM’s chart is for the S&P and that has a LOT further to drop to get to the bottom of that trend channel.
However on the DJIA that lower trend channel was hit. It would appear that either the S&P is much ‘stronger’ or the DJIA is much weaker.
Sooo…you puts your money and takes your choices!
For the record I’m currently long the DJIA with a small position.
Sorry I don’t know why I wrote that last sentence. Since then I’ve been ‘all over the place’. Suffice to say I’m not saying what (if any) positions I have. If I do make the mistake of posting anything remotely related to my trade positions then please feel free to ‘slap me down’ metaphorically. Thx.
Richard issacson says: If John Hampson is truly “educated” in the UK then he knows about the “Dogma of Human Perfectibility”. If he is truly educated in the UK then he also knows that “religious enthusiasm” will defeat “democratic ambition” which is as unpopular in this day and age in the USA as it was in Revolutionary France.
_____________
Sorry, I don’t get the connection but I am not educated in the UK. Which french revolution anyway? 1789 which is at the solar max, or the one they sing on Broadway of 1832, which is past the 1830 solar max.
John Li, if the place of your education is what you are judged by then I’m in one hell of a ‘hybrid soup’. Is ti any wonder my 2 brain cells are in complete revolt (or is that confusion?). Does it matter anyway?
I hope one brain cell is the left brain and the other is the right brain. The revolt is probably the right brain being bearish and wrong for so long that it too turns bullish, in a true Issac Newton fashion.
🙂 🙂 Is that the bloke who had an apple fall on his head? Poor bloke was never the same again ever.
Nic, does the sell off in European stocks following Draghi’s speech surprise you? Or is it merely a case of “delayed gratification”? 🙂
Don’t disturb his vacation please. We have a good thing going.
maybe the European markets have finally realized that when he speaks, it’s a real Draghi, man.
I am 97.5% cash and to be frank have felt rather foolish
recently as had expected an approx. mid October move lower,
when the reverse happened.
To answer you, lots of Novembers are down when the US president is approaching the 8th year…
Phil, hope the ‘other 2.5%’ is invested in ‘liquid assets’ that you are enjoying in the mean time. After all what is all this for otherwise eh?
purvez, I had about given up on any expectation
of a November fall, so read your comments with
interest.
I would just add that this could be a very short lived
market tantrum on the acknowledgement of a Dec FED move,
rather than something more significant.
Phil, sorry to burst your bubble here. IF this is a ‘Leading Expanding Diagonal’ down then it is just the FIRST of a 3 or 5 wave move down.
My reference to a ‘swift and deep’ retracement is just that. A retracement. I’m NOT EXPECTING it to go higher than where we left off on the 4th Nov. Probably about 61% or 72% retracement.
Hope I’ve not given you the hope that we are going to new ATHs here.
I am sooooo over the verbal diarrhea. Does anyone actually understand much of what comes out of her mouth??
I’d rather have a root canal than listen to her!
‘OOOh you rude rude man’!! Go wash your mouth out with ‘carbolic soap’ immediately. 🙂
No mention of dentists please.
The reality is we’re range-bound for the moment and trying to call daily moves is best left to the experts like Valley. 🙂
It’s interesting to hear you say that.
We were up by 250 ES points in October (13%).
We’re down by 3% in the past week.
I look on that as the opposite of range-bound.
Perspectives I guess.
You’re not short equities I guess?
Let me crib from someone smarter than myself:
Our view remains that the powerful October gains are likely to give way to a period of range‐bound trading for the index and between roughly 2050 and 2150 we would not get too excited about the meaning of moves but instead concentrate on what it taking place under the surface.
All that said, I think I indicated I was a seller last week 🙂
Copper, Crude, and Gold are pointing towards another “financial crisis”:
http://www.businessinsider.com/copper-drops-to-six-year-low-2015-11
SP500 back to argue with 2065 yet again; must be magnetic.
Some commenters identified it was a natural target a year ago: https://solarcycles.net/2014/10/29/explosive-rally-again/#comments
Above 2065 is bubble territory; a convincing break below means severe declines. So far this month geomagnetic disturbance has been moderately high, but more importantly sustained. It will have to remain like that for at least the next two weeks (preferably the next few months) to cause those declines – but the chances of that are very slim (less than 10%, based on the very consistent geomagnetic cycles in both Ap and aa series).
Gary – the narrative could be something like “NASDAQ 2000 was the potential, now is the reality”, or that “Central Banks saved the day”.
Mark –
Ok. I think the CB narrative is a bit long in the tooth but never say never. Regardless, it has to be big and has to get investors’ neurons excited. The promise of new and important medical cures from biotech companies, that sort of thing.
Perhaps the realization that corporate profit margins have reached a permanently higher level due to technological advances. Or energy prices will remain lower longer than anyone expects.
Understand, I don’t hold to this outlook and I don’t subscribe that we’re currently in a bubble – I lived through the internet bubble and can assure you today doesn’t begin to compare to that level of speculation by the public, except perhaps in the biotechs – but it’s interesting to speculate how a bubble might occur.
There’s a fetish these days with folks looking for generational extremes after already having lived through one. It just doesn’t happen like that. People have memories and therefore markets have memories. If I see a tech bubble equivalent euphoria id have to live until 90. At that point no one give a fook about what a 90yr old thinks about the market. Just picture a 20 yr old in 1929 trying to warn the young “sophiscated” crowd to watch out in 1999. Theyd tell the geezer to go F himself. Therefore, i strongly believe we will not see sentiment equivalent to the tech bubble in the near future.
peggy nailed the spiral low last week dated today 11/12/15. just sayin
What if it goes lower tomorrow or the day after?
i won’t mind if lower:) singularity low futures target from spiral was 2020 if 2075 broke. the call was made with spy at 2110 and futures around 2100. i’m up 50% this week. i’ve rolled positions forward by selling out of the money call spreads.
spiral calls for up starting tomorrow through next week with another downdraft for thanksgiving targeting sub 2000. also, i saw a fake print yesterday on yahoo finance for spy 190.86
Hope you managed to take advantage of the ‘prediction’ scott. The main thing with this ‘game’ is to use whatever works for you.
I tried tea leaves but the damn ‘bags’ are hard to break open these days. B!@@dy technology.
i use peggy’s spiral along with lots of help from you kinds folks and several other sources. when i get a confluence of alignment combined with a gut check, i make a move. i left alot of money on the table w/ spreads and insurance calls, but i”m still up a nice chunk of change and chips in the game. much better than when i got fried by the jobs report last may. i was out of commission til sept
purvez, lower prices are more than welcome (for me)
so you are most definitely not bursting my bubble )
Having been wrong footed by October, just attempting
to stay circumspect.
Aaaah, so good to know that I’m not being a disappointment to others. Thx for letting me know.
Just to keep everyone reminded. I believe this 5th wave down is nearly done. The next one UP is going to be SWIFT AND DEEP. On the DJIA I’m expecting a retracement to 17790 but REALLY more likely to 17870 given the market’s propensity to rise once it ‘gets going’.
That’s like nearly 400 points from where we currently are.
Can anyone see me ‘drooling’ here?
Well, all working out quite nicely so far – it would be really good to see a gap down in the QQQ soon, as Nicolas’ frenzied buying is keeping this one aloft reasonably well…….vacation my a**e 😀
J
is there any point FANG (facebook amazon, netflix, google) stops getting bought? unbelievable. amazon w/ a 1000 PE. those 4 holding up the qqqs from a gap fill. how about when europe is completely broke and they decide to claw back $$ from the inversion tax escape artists? maybe then
A couple of weeks ago I mentioned to Nicolas that he should be packing his bags, because he’s about to go on another vacation….
Strange that ~I~ can tell ~him~ when he’s about to go on vacation, and yet ~he~ can’t tell ~us~…. Piss poor planning on his part, i’d say…. 😉
Regardless, “He gone……” hahaha
Oh, darling Nikki will be back 🙂
Dollar overbought:
http://www.marketwatch.com/story/the-dollar-hasnt-been-this-overbought-for-30-years-2015-11-11?siteid=yhoof2
I think ES gets down to 2034, today or tomorrow, before bouncing from the descending trendline and lateral support. I will probably take all of my profits then, with a view to re-loading as the upper descending ES trendline is approached (all on the FTSE however). Or I might just hold through the bounce, or a bit of both. I am undecided. 🙂
7% up so far, not bad for a cr&p trader eh!
GM, very good to know you are doing well at this ‘trading game’. Congrats.
Taking profits never hurt anyone. If you believe it’s going to go against you (even for a while) then why submit yourself to pain? Unless of course you a masochist.
That reminds of an old joke:
Sadist and Masochist are walking along when the Masochist turns to the Sadist and says : ‘HIT ME’.
The Sadist goes : ‘Noooh! 🙂 !!!’
Coincidentally, this from my DeMark guy (https://tradetrekker.wordpress.com/):
In the days ahead, trading below the weekly bearish price flip level at 2033.11 will indicate the rally has exhausted and a turn to the bearish side can be considered.
2033-4 is an important level –
peggy’s spiral bounce target is 2028 and is still in play. after the bounce target is 1553 in the next 6 months. spiral absolutely nailed 11.12.15
How did she nail it (the low) when prices are lower today?
How can it ‘bounce’ to 2028, which is lower?
I am confused.
I took about 25% just recently, the rest of the trades are freenow with stops in place. Jan puts trading around breakeven but am going to hold on to those.
J
Jeger,
Oil definitely breaking through the downside trading range. Good Call on the short I definitely think the price action is for more downside. Let’s see if it can breach the Aug. lows in the coming weeks. My hope is that it visits but holds the Aug. lows.
Enjoy the profits!!!
here’s a thought…fund managers have to buy something, poor performance they get fired or redemptions or both. afraid to buy bonds because of rising rates, afraid to buy commodities because they are out of favor and they can’t wait 1-2 years. so they get funneled into a smaller and smaller group of momo stocks. facebook, google, amazon, netflix, home depot, starbucks, costco, etc… when the music stops and europe claws back their tax money, the rug gets pulled and we drop like its 2009 and 2000
nice catch up with the qqqs today:):)!
qqqs are losing their 200 day average….time for gap fill to 110
Friday 13th, not unlucky at all in my experience.
Meanwhile Draghi beating the Fed hands down in the currency war. Geriatric Fed taking extended nap and wondering where they are when prodded awake. Its easy folks, just buy your opponent CB bonds more than yours are bought. Reduce your rates whilst dumbo opponents increase theirs.
Wow!!!! Strong down finish.
A contrary view on copper:
http://www.mcoscillator.com/learning_center/weekly_chart/copper_priced_in_japanese_yen/?utm_source=McClellan+Chart+In+Focus+-&utm_campaign=b00a4250c1-CIF_Copper_Priced_in_Japanese_Yen11_12_2015&utm_medium=email&utm_term=0_9e79f8200f-b00a4250c1-151427494
After looking at charts tonight…..
For the shorts:
I’ve got nothing that looks like we’re about to put in a bottom here, so still VERY short, and holding for lower prices ahead…..
HY bonds still declining daily, so no support to offer from them either…
Also, noticed that the three major bond insurers (MBI / AGO / AMBC) were all down 6-8% today, after rolling over a few days ago… Probably nothing… 😉
For the longs:
I got nuthin’ for you…
GL
UKX now looking very ill, giving up further ground
this morning so far.
I think everyone here can see prices Phil….
J
Need to see follow through selling to confirm the start of a bigger leg down. Dax only down 2% and Dow around 3% from recent levels. I expect an August style drop if we are going to make a significant down leg this year. Last chance for the Bears this year me thinks. Gone with a dax short at 10800 stop at 11025.
krish, we could bounce now, the low could be in.
ES 2034 is/was/could be support,
This is the test today.
Despite the risks of a bounce, I am going to hold all of my shorts.
I still see us testing the ES triangle bottom (c.1870) in a matter of weeks, and if it plunges today, I want to be on board. If it bounces, I will be patient.
Moved stop to break even. I expect further breakdown starting on Monday. I’m not expecting a retrace until the August lows are hit. If we can’t hit them by end of November I will close all shorts. Let’s hope central banks don’t come the rescue and delay the drop by another couple weeks.
Barry, looks like you timed your short entry nicely.
Thanks, Phil…
Not sure I timed it all that well, but the important point is to be on the right side of the market, and using the “blind squirrel” theory, I did that well, and it’s been a good week for me, to be sure…
Thanks..
I just took another 15% now on SPX/SPY/Nasdaq shorts, have some shorts on individual stocks that I will take a look at on open.
J
More evidence of the oil destruction in US markets. Anadarko and Apache attempting a merger that failed and the markets punished both of them. Why? It’s a merger based on weakness. This is not over however, it is quite common for initial offerings to get declined. They may rethink the terms. What struck me is the fact that Apache being purchased rose initially, but if Apache truly had additional value, they would go up and stay up no matter the rejected deal. This tells me the market views both companies as weak and in need of a merger.
Buest guess and admitted pure speculation at this time is that oil price holds at Aug. lows in the coming weeks. If it breaks through, look out below. 2009 lows perhaps. Time will tell.
Holding on to view that weak oil producers get crushed and price recovers to $60-70 WTI by end of 2016. My stance on that view will weaken if we cannot hold Aug. lows.
I suspect we will retest the 2009 lows tbh, unless a great deal of demand is going to materialise from somewhere……
spiral 6 month target 1553 and longer dated 1 year plus 551. which would surpass 2009. that would be some carnage
Trader Moe speaks for so many… http://trader-moe.com/
1st hand
And he always has a 2nd hand option too.
Retail sales collapsing
Commodities collapsing
Eurozone GDP all but non-existent
Chinese economy collapsing
Anyone that thinks the Fed will hike next month still believes in the tooth fairy.
Allan, I read an article last night that stated that physical gold in the USA has seen a spike not seen since before 2009. Seems like another BIG RED FLAG to me. Curious on your thoughts on Gold vs. US$
A purchasing spike of Golden Eagles to be more specific.
Little guys buying is not bullish, and it has not been fo the last 2 years. The most bullish thing I see is the quants have a buy on gold stocks because previous instances of such negative market action has seen 25% rallies over the next month or 2. Oh yes, reading gold bug letter writers, they are down and out and even going short! That means a rally is likely.
Kent, I agree with you, but indicators like HUGE spikes in physical gold by retailers are like canaries in the coal mine. Especially when the spike is considerably similar to the 2009 financial crisis. Thanks for the feedback.
Get off that fence now Allan )
What a savage sentiment shift.
I feel a little less ridiculous with my cash now,
bought some GSK.
Have taken profits on SPX/SPY/Nasdaq now, suspect we may see a bounce. Maintaining shorts on some individual stocks with trailing stops. Taken 20% on USO shorts for same reason.
J
Up until yesterday’s drop I was of the opinion that we were experiencing a ‘Leading Expanding Diagonal’. That would (should) have ended at yesterdays lows and then we would have a Deep and Swift retracement.
However today’s drop has IMO transformed that. I now think that we had a series of 1/2, i/ii (i)/(ii) moves (which therefore looked like 3 wavers and hence the Leading Expanded Diagonal call) and we finally had our BIG 3rd of a 3rd of a 3rd wave from just before 17800 on the DJIA to today’s lows.
On that basis although we will get a bounce it will neither be swift nor deep and we will have further to fall to complete wave-1 to the down side.
I’m currently not in a position to post a chart but will hope to do so during Monday to visually show what I’m trying to say here.
I’m fascinated that your EW analysis seems to chime often with my ‘gut instinct’.
(I imagine your ‘position’ re not being able to post a chart is something like lounging on a sofa, glass of wine in hand, toasting your trading success).
I had a feeling 2034 ES would fail, and it has just been re-tested and failed again.
In the same way that the August decline just kept going, I have a feeling this one might do the same. However, there is further support at 2021.50, which may hold, the high from Fed day in September, it held earlier today, to the tick.
Still short here.
🙂 GM you are only half right this time. I’ve got some very dear friends over for the weekend so we are ALL lounging on the sofa etc. They are wine lovers too. That’s a really good way to end the week and enjoy my investment in ‘liquid assets’.
I got stopped out on my long and missed today’s move down….but hey can’t win them all. Besides I’d rather be doing what I am right now than make an extra 100 DJIA points.
Wishing everyone as nice a weekend as I plan to have.
I agree overall, but I think we have some (weak?) “up” for a day or two now – once that happens I don’t stay in as I can get a (somewhat) better price later and book profits that I can actually use. I try not to be too greedy – been there and done that:)
GLA
J
peggy’s spiral targets met. bottom is in or close. may see a revisit to esf 2008-2015. spiral targets move up thru next friday as high as spy 2080
i have booked all my shorts yesterday and today. up 70% for the week. :):) taken some longer dated call spreads in wynn and nav. we’ll see what monday brings. a flush down like before or a rebound as called by the spiral bounce.
i also threw on near dated bidu otm credit put spreads 192.50-190s coupled with a near dated call spread 197.50-202.50 with a 1/3rd of my gains from my e/r bidu win that started my streak about 4-6 weeks ago.
Up 70% for the week?! What does a bad week look like?
Maybe ask him next week John, 2021.50 just went, looking potentially crashy now.
That spiral thing has been all over the place in recent months, hard to believe one could switch to long based on that. Hey ho.
GM, not finding fault at his trading. I actually didn’t really read if he is long or short. Just hate to see someone down -70% after being up +70%.
I know John. I guess I am finding fault with his trading! 70% in a week is crazy.
Without simply asking, i can only assume that’s a 70% return on the options he’s trading (which seems VERY doable in weeks like these), rather than the actual return on his “entire” account this week…
If I’m wrong on this, clearly I need to seriously look at option spreads… 😉
For comparison, I am up 8.34% this week, but that is over the ENTIRE trading accounts balance… And I consider my position right now to be quite over-leveraged…. :-O
I stated on this blog 2 weeks ago I had 211 puts expiring this friday against 208.50 spreads expiring last friday. bought insurance for last friday. i had 60 contracts. i took some gains last friday and rolled out into puts preads at 209 and 207 strikes against 205.5s expiring today and next friday. i liquidated all of those yesterday morning and sold 150 113/114 calls spreads for a net credit. those were all liquidated today.
started with 5k in my spec trading account 6 weeks ago and had the baidu 172.50/182.50s for earnings. made $5k rolled that into BIIB call spreads made $5k. rolled that into the 211/208.50s put spreads.
a bad week wipes you out. which happened last may. which is why this is my spec account. i now have dialed the leverage way back to avoid the wipe out. had i just kept my 60 211s, i would have been up 400% this week. shoulda/woulda/coulda
Headline – Weak retail sales suggest moderate fourth-quarter economic growth
And the realities from negative feedbacks come marching in. In this article you will find that this includes unexpected weak auto sales. Well unexpected for those not paying attention to the horrible job market that is getting worse with less high paying jobs.
Still waiting to see how Christmas sales will be.
70% in a week….lol……I thought my results were extreme….smells like overleverage maybe……just be careful…….
J
Gap close on QQQ, will take 50% profit here and reassess next week.
Jan puts in profit, but will keep hold of those.
I think that’s it for me for this week.
J
Shoes continue to drop. CSCO, JWM just latest examples amoung others. The index will eventually give way. Too early to tell right now if it will continue down. Next week should be interesting.
Every man and their dog everywhere today looking for the ‘bounce’.
Twitter reveals some shorts have covered.
After hours action hardly conducive to get bulls buying.
Where are support levels now? Nothing much that I can see at first glance.
Enjoy the weekend.
PALS next week SPX:
Phase: negative
Distance: positive
Declination: positive
Seasonals: positive
Planets: negative (Sat conj, Mars obscuring Jupiter)
Summary: My bet is very bullish next week, especially M T W.
Last week was a miss for PALS valley, and it missed the August decline too. Any ideas why? Appreciate your sharing.
Last week:
‘PALS SPX next week:
Phase: bullish all week New Moon
Distance: bearish Mon Tue, bullish Wed Th Fri
Declination: bearish all week
Planets: neutral (VIC still good, Saturn conjunction end of month bear)
Seasonals: bearish until Wed, bullish Th Fri
Summary: fully invested into Monday open. If price rises or stays flat will sell or go short until Wednesday, and buy Wednesday mid day.’
PALS was calling for bottom on Wednesday and Wednesday was below Monday so was correct. PALS was looking for a rebound Wednesday to Friday which was incorrect. As with technical indicators PALS is not always reliable. However, if correct more than incorrect and size of trade is constant my assumption is that it will be profitable over long enough time horizon.
I appreciate it won’t be spot on all of the time, and have seen it do very well for you.
Just curious that the big down moves seem to catch it out.
Size of drawdown on what was predicted to be positive day is a concern of course, 🙂
I think they lose face if they don’t raise so they will make a monumental mistake. Then, they would lose face by flip flopping: therefore, they that will keep policy out of synchronicity for months, ie a real bear mkt in 2016
The Fed has said all along that it’s driven by data (why people express disagreement or consternation about this approach I have no idea). So some may term this flip flopping but I would characterize it otherwise.
“When the facts change, I change my mind. What do you do, sir?”
Having said that, my concern is more the constant chattering by Fed governors about a potential rate hike. The many and varied voices risk conveying the Fed, with all its resources, doesn’t have any better handle on the economy than the average citizen does. (Fed haters, here’s your chance.)
I would prefer it speak more consistently with one voice about the particular metrics it focuses on to make decisions, in an effort to cut through all the noise investors/businessmen encounter daily.
Correct in that the Fed uses the stance of being driven by data, but the conspiracy theorist in me says that it is political as well. If you step back and ask yourself “Who would the fed want in power” the clear answer would be a democratic majority in both houses along with a democratic president. That being said I think that they are are going to let the markets crash during the first half of 2016. Then with the MSM in full panic mode our teleprompter in Chief will take to the air waves along with Hillary and blame the market decline on the Republican controlled congress and at the same time Grandma Yellen unleashes QE4 (because that is what they really want to do) which they will take credit for working with the fed to make this happen. That will set the stage for the November elections and a full sweep of the Republican controlled congress, along with Hillary in the White House.
Gary, problem with the ‘facts’ argument is that the Fed happily ignores facts when they reflect a reality they don’t like (or understand, or both). Eventually the market will judge them as incompetent and dangerous.
http://www.alhambrapartners.com/2015/08/25/when-the-fomc-completely-loses-the-inflation-argument-more-economic-downside-must-be-admitted/
I’ll take a stab at another train of thought…
It’s not that the Fed is ~so~ political, but it knows full well how bad the on-going fiscal policies are, and in an effort to offset the economic contraction they’ve feared, they’ve had to keep interest rates way too low, for way too long, and they know that…
The Fed’s talked about fiscal polices being a headwind for a long time now, hoping politicians would change the fiscal policies, but obviously they haven’t…
And they’re tired of waiting on Washington to finally do something positive here…
So they’re sending a message to Washington to get their crap together, by taking a shot or two across the bow by raising interest rates….hoping that will take a little air out of the stock market and the real estate market….
Which will hopefully motivate (scare) politicians into changing fiscal policies…
The idea being that they can “control” the descent of the markets, but that remains to be seen… Regardless, I do believe they WANT the markets lower…. Otherwise, raising interest rates right now makes NO sense, if you’re looking at all the data, and the Fed is clearly clueless……
Or maybe both?? :-O
Jafree, Physical demand is exploding. Forget the sham that is called the COMEX.
The COMEX will in good time become totally defunct and irrelevant.
Physical going through HK and the SGE and also into the sub-continent are astounding.
No doubt most have heard the stories about physical leaving tne west and heading east and you better believe it!
Westerners by and large have never held much respect for physical gold other than for short term prosperity and that is no more obvious than at present.
As for the USD gold price, I am more concerned about my local currency Au price, however the longer the USD Au price stays here or lower the greater the flows will be to the east and the greater the consequences will ultimately be for those in the west that have shunned Au.
I continue to accumulate and am not ovely concerned with the short or medium term Au price in either AUD or USD because when TSHTF big time, ther won’t be any where near enough ounces to go around.
https://www.bullionstar.com/blogs/koos-jansen/uk-gold-export-to-china-hit-record-in-september-chinese-gold-import-156t/
I have never really understood why the Fed would manipulate markets when even they know that confidence is the only thing that holds a monetary system together….UNLESS the banks are so near to going under that even a 30% drop in stock prices (or similar volatility in other assets) will make the financial system go boom. There simply is no other explanation in my mind, because there certainly is no risk to individuals who would be largely unaffected by a temporary drop in prices or increased volatility. If the financial system loses the confidence of those who underpin it, the system goes boom in very short order anyway, so why risk it unless the risks are of that magnitude if they don’t?
Other than that, I can only think that they are advised by banks and institutions who are massively profiting from the situation. They would certainly be blind to any risks, because our governments bailed them out last time with our money instead of there being consequences – so nothing was learned.
Just wait until 20% of people want 50% of their cash out of the bank……then everyone will realise that it is all a scam….:)
imho
J
http://www.moneyandmarkets.com/must-see-chart-eyes-gold-now-74196#.VkedMU1ASM8
Purvez – Everything is on sell still. A simple bottoming chart is VIX with BB on a daily chart. Do not even think about buying until the daily VIX closes back inside it’s upper BB.
As for wine; I’ve become a fan of Argentina Malbec, Spanish Tempranillo and Chilean Carmenere over the last five years. I like the Carmenere the most. I suggest you check into these roots.
Best to you.
New post is out