

Testing several key theories here real time, it’s been a slow process, but patience is being rewarded.
Firstly, that demographic forces are more powerful than central bank actions. Look what’s happened since 2010 despite QE and ZIRP:

Source: Don Draper
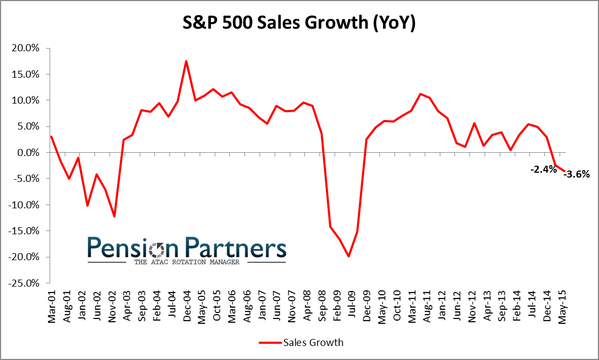
Source: Charlie Bilello
Slow degradation and now all negative. What an expensive mistake:

Source: FRED
Is it really a surprise? They actions amounted to entering numbers into a computer, corrupting the money mechanism and then trying to deceive the public with carefully chosen words that all is well with the economy. But that massively increased debt is real, and the plan to withdraw it gradually once the economy is booming again looks to be a pipe dream. So what do they do now? Having spent so much, they can’t admit failure and won’t give up. Expect more action and more unorthodox policies, but based on the evidence they won’t be able to stop demographics.
Secondly, that solar maxima bring about speculative peaks. As we hit the solar max of mid-2014, we saw a wide range of mania attributes in equities: valuations, sentiment, allocations, leverage, and more. What has been missing is the definitive puncture of the mania post solar max. But under the hood there has been a lot of evidence that speculation did indeed peak out then, such as in stocks:bonds, stocks:dollar and financial conditions.

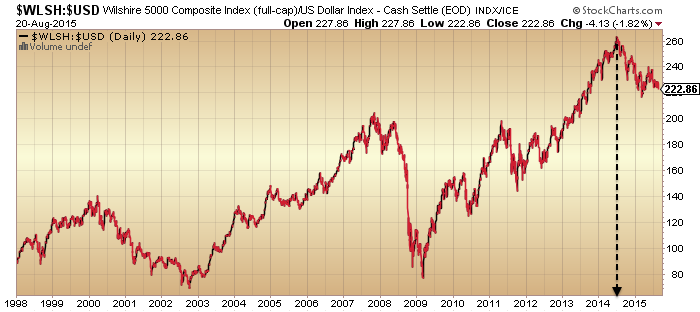
Source: Stockcharts

Source: Bloomberg
Only if those ratios/indices made new highs since, would invalidation become more compelling. But a year later, they still haven’t and remain in downtrends.
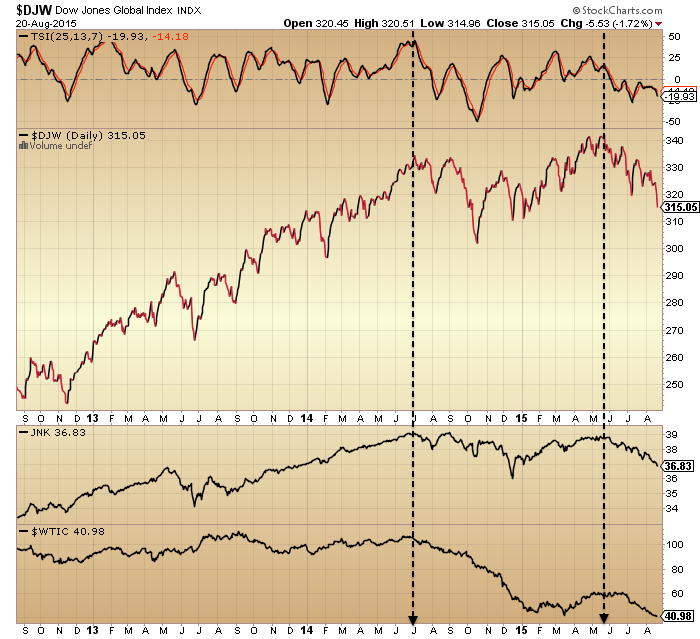
That mid-2014 peak also shows among many more charts, along with a second important peak around May this year. Here, the Dow Jones World stock index (with a strength negative divergence between the two peaks), junk bonds and crude oil.
Next, the NYSE index, with negative divergences in breadth and volatility (inverted) between the two key peaks.

And here, a bunch of major country stock indices from around the world, showing similar twin peaks.

We see mainly a higher secondary peak in nominal prices, but this is not atypical historically. In 2007 we experienced a higher high in October after the first peak in July, with multiple telltale negative divergences between the two.
What’s challenging is that every top is different. The duration between the two peaks in 2014 and 2015 has been a long 10 months, fooling many bears and bulls in the process. In 2000, it was just 5 months between March and August. Yet we see similar hallmarks: degradation in internals, environment and risk appetite between the two.
The situation remains tentative of course. We can’t say for sure that stocks won’t rally back up to new highs. But the sideways price range of 2015 is now breaking to to the downside, and either it has been the arching over of a top, or a pause to refresh the bull. There is a lot of evidence for the former, and very little for the latter.
Thirdly, drawing the first two theories together, that ‘central bank policy trumps all’ has been the mantra rather than the driver for this bull market mania. Just like at all other major tops it has been an excuse for excessively high valuations, but one much more readily embraced than that herd behaviour under the sun’s influence brought about the mania.
Well, if stocks are now in a bear market, and the evidence argues that we likely are since May, the central bank support idea is about to face a tough challenge. Interest rates are zero or negligible and quantitative easing has been shown to have little positive effect on the economy: central banks are at risk of being shown to be totally impotent. This, together with the record leverage deployed in equities, is the recipe for stocks to fall hard. Panic selling lies ahead at some point, and if we think of equities like Wile E Coyote running off a cliff since the solar max of last year, they have been levitating with no support. I maintain the geomagnetic seasonal down period since June-July into October this year remains the likely window for that swift acceleration to occur, meaning this week’s key technical breaks could be kicking it off.

John H, another wonderful, wonderful post. I particularly like the Wile E Coyote ‘mind picture’. Hehehe.
As a die hard EWer I’ve been struggling with how to count the waves since the ATH in the DJIA. The number of overlapping waves, slowly breaking to the downside ‘could’ be nested 1, 2s but there are just too many ‘Russian Dolls’ there for my liking.
I then decided to see how previous tops looked and certainly the 2007 top has very few overlapping waves before the big waterfalls to the downside. However the 2000 top looks very similar to the current one. I guess what I’m trying to clarify in my mind is that it is still possible to have a Change in Trend even though the initial waves don’t look impulsive.
Again thanks very much for such lucid explanations and conclusions.
Just wondering what is your optimum number of Russian Dolls p? 🙂
I have a golfing buddy who always asks ‘how many swallows DOES it take to make summer then’?
Somewhat frustrated here that my procrastination prevented me from getting short for this waterfall, it was so obvious it was due. But, you know, I suspect there will be other opportunities!
Good luck all, especially you bulls.
Thanks Purvez. I defer to you and others on wave counts.
The trend line connecting the early Feb’14 low and the mid Oct’14 low currently crosses 16500ish on the DJIA. It will be very interesting to see whether the index heads straight for that without a bounce and even more interesting to see what it does once it reaches there.
Looking at the waves that created those 2 lows the index should just continue down without any noticeable bounce.
If the top for this Bull is already in then it should break that 16500 level after a brief bounce.
thank you for the great post. yep they are all adding up, currently s an p 500 at 3 standard deviations above its average much like in 2008, so some mean reversion is likely soon.
Cheers
John,
Excellent post as usual – I’m struggling though with this sentence. Could you help – thanks.
Just like at all other major tops it has been an excuse for excessively high valuations, but one much more readily embraced than that herd behaviour under the sun’s influence brought about the mania.
The justification is not the cause, it is solar influence which is not accepted. That is my understanding.
Thanks. Yes, that all high valuation peaks have had a ruling new-norm justification that’s widely bought into until the market reverses and proves it invalid. And solar influence is widely unknown or misunderstood (lumped in with astrology).
Great stuff as always. Bull markets always have justification frequently called a thesis, new era, and it is different this time. As Central Banks are demonstrating their impotence, it is quite ironic that the thesis is they control it all. Peak Oil is probably the best/worst justification ever.
Market take escalators up and elevators down. Plus they have incredible counter trend rallies. Trading those is challenging.
Thanks Kent
Valley,
are you exiting longs here or waiting for a bounce. I think 205 is a big magnet and market will end there today.
Otherwise the put holders will be given a windfall. Could be, I am happy to stay invested until next Tuesday’s open. After that, will consider moving to cash. 85+% of the time Thursday opex August close (yesterday) to Tuesday open after opex is up, sometimes a lot.
Biotech sector now officially in correction mode; down 14% since July 20
Any link to the announcement?
Excellent John. i have maintianed all along that you pretty much nailed it despite new highs in some sectors/stocks driving indices to new hghs, which were mostly marginal new highs.
Demographics will most definitely have a very strong overriding influence in the years ahead.
Cheers Allan
Well done, JH!
It is time to reap what we have sowed.
Thanks John
It is interesting on the intra-day charts the last few days as any reversal attempt is met with a wave of selling. This is a very significant change of past behaviour.
At some point we have to get a decent bounce, it can’t be this easy.
I previously mentioned a while back that it was set up for a market panic/mini crash on Mon Aug 24. What was rather surprising was that I anticipated the first big down bar to occur the TD prior (Aug 21) with the market topping by Wed Aug 19, but instead the decline started a couple days earlier on Wed. Again, the day to day and intraday path the market takes to get to a destination each time is rather unpredictable and futile to pinpoint.
At this stage the best bet for the first decent bounce should occur after Tue Aug 25.
If the market indeed breaks badly early next week it will likely be an “emotional panic driven” selloff and technical levels or other indicators will likely be useless during that time frame.
The thesis again was for an initial panic sell off the early week of Aug 24-28, followed by a sizeable rally bounce into early Sep, and then an even bigger sell-off by mid-Sep. This time the market bottoms by end-Sep (or by first week of Oct at latest) and there should be no crash/correction taking place in Oct like last year.
It’ll be interesting to see if the CBI indicator’s 23-0 track record (Rob Hanna of Quantifiable Edges) finally fails. The start date was July 24th – I have the S&P 500 closing at 2079 on that Friday.
From Rob’s website:
The CBI moved up from 8 to 15 on Friday, July 24th. While 10 has been a strong indication for a short-term bounce, 11 or higher has been a reliable indication for the intermediate-term.As you can see, SPX has been a perfect 23-0 when looking out 20 days from the first CBI reading of 11+.
Drawdowns have been sizable in some cases. Still, it appears a reading of this magnitude often suggests a washout is in progress that should set the stage for at least a multi-week bounce. We may not reach the “final” bottom here, but this study indicates a good chance at least a temporary bottom forms soon.
Agree. So that’s today then? Bar a miracle, looks like a failure.
Gary if those are 20 calendar days then surely we have the first CBI failure. However if it’s trading days then I think we may have the odd day or two left still.
It’s trading days –
I was wrong in how I responded a week or so back to one of the posters’ question here (John Li?) about how to obtain more information on the CBI itself. I answered it was not easily accessed – mea culpa, that was incorrect. There is a link on Rob’s site that explains the indicator.
Why I take Martin Armstrong with a grain of salt:
SOCRATES August 10
“NY Gold Nearest Futures remains currently trading neutral within our standard deviation envelop defined as 1169.20 to 1079.00. Breaking outside this envelop on a closing basis will often signal a sharp move will follow in the direction of that closing. Combining this with our Reversal System provides a powerful tool to ascertain a change in immediate trend”
August 21
“As far as Gold is concerned, the Weekly Bullish stands at 1188. That is still well above the market with the major resistance starting at 1205–1210 followed by 1225–1230”
The man can’t even follow his own AI advice!……so which is it Martin, 1188 or 1169.20???
He admitted recently that only he codes the AI, so a bucket of salt might be appropriate.
He gets some of it to be fair, but has biases that he projects.
I would suggest Allan the numbers being weekly change each week.
In spite of your lack of regard for him you obviously are an avid reader.
Strange.
It’s not strange.
I read some of Krugman’s pieces, just to keep an eye on where the leftists might take us.
I think they’re all morons though.
Armstrong is a bit like that, a mad scientist, well worth monitoring, entertaining, but as Allan said, with a pinch of salt.
John H, please may I ask what you would be looking for in indicators to see a ‘bottom’ (short term or otherwise)?
Thx in advance.
Not easy currently. Normally it would be sentiment, put call and other indicators at contrarian extremes, capitulative breadth flagging, a voluminous intraday reversal hammer candle or a lower low forming on positive divergence. But how come the market is falling despite most of those criteria having been met when we were just off the highs? And why did they occur so near to the highs? It’s odd behaviour that’s not easy to explain.
To add to the list, I would like to see a new high for the VIX from the start of the bull market. (i.e. I do not need to beat 2008.) If VIX managed to get that high in 2011, why wouldn’t it get at least there for a solar max crash?
Thx John H, whilst we are pretty near the 10% decline on the DJIA we still have approx another 70+ points to go on the S&P.
The trend line connecting the early Feb’14 low with the mid Oct’14 low currently runs through 1925ish which is where the 10% decline would be.
Perhaps your next post can review the various indicators and their status that you mention.
Shakeout in progress
J, are you suggesting this is a correction, or something a bit bigger?
Peter_, I just visited your 1st August chart on the Barestbodkin site and today it has hit your ‘A’ target for Primary IV.
Do you have a target in mind for the ‘B’ of Primary IV at this stage please?
Sorry for being tardy. Accounting things. This delay needs to pay, at last.
Overshoot is #1 an indication of sharp reversal. My cover closes, but next Fib is ratio of 1.62 to 2.62 (SPX). Gaps have concern for equal speed closing. Target of 1820 still there. My shift is precious.
BTFDer’s are getting massacred.
If we don’t see a bounce at the 1960-70 S&P level, I think 1800 is on the cards, Monday will be fun.
Where are all of our bullish posters? Hard to type with burned fingers I suppose.
True story folks, I had a vivid dream last night where I was in some sort of log cabin in the woods, and a huge bear got in the house, chased me up on the roof, had me trapped, and then I tweaked its nose and walked away.
Weird eh?
I think I need a holiday.
Same dream +/-, great dreamers dream alike.
Spooky v.
Today’s close is very important because it results in the determination of the weekly close and many longer term strategists would base their decision on this price and act next week. And for price to currently penetrate the 50-week MA and looking poised to close near the daily/weekly low, I reiterate that you will see a mini-crash panic decline on Mon extending to Tue.
Something crazy could occur such as a 150-200 SPX point decline in a single day, and I am not saying something like that happens, but the possibility exists when you review scenarios and price levels and especially if exacerbated by some “unforseen” global event occurring over the weekend.
Don’t forget the retail margin calls also. Plus all the weak bellied retailers that sign in to their 401k and decide now (as in Mon -Tues) is a good time to sell. I could definitely see some panic early next week. If that were to occur it could cause another wave of panic. People are on edge and have been for a while. Time will tell.
I have never seen the full moon so red as this afternoon.
From Johannesburg FWIW
Purvez
I was referring to the pump rrom 1992 to 2007 on spx.
A very good end to the week so far…
Have a good one all
J
Are those S&P numbers or dates, J?
And it is not even a blood moon. We (North Carolina) had a red sun last month, turned out it was smoke in the upper atmosphere from Canadian forest fires.
Wow the DJIA has reached it’s trend line connecting the lows of early Feb’14 with the mid Oct’14. The S&P is still about 50 points away.
So what gives?!
Da Bull.
Finally!
Big Congrats to John H and the board for the fantastic calls the past few months. It is paying off nicely so far.
Also big thanks to Peter Temple. I am following you the past few months, and your EW counts have been spotted on. Great job!
I am wondering if this selling is coming close to a pause, then a powerful bounce before heading back down in October?. It looks to me that the current 3rd wave has not been concluded yet. The next support for SPX is the 1965. Imv SPX has to bounce over 1990 to indicate wave 3 has completed.
PALS next week:
Moon phase: pre full moon not as bad as post full moon, FM next Friday
Declination: uber bearish today, bullish all next week
Distance: bullish all next week
Seasonals: bullish Monday, bearish Tuesday to Friday
Planets: any day now post VIC rally could appear
PALS is mostly market supportive next week. I am in cash after a losing 36 hours. Exited shorts too early on Thursday. Se la vie!
Very frustrating week for most indeed. Keep up the good work.
Not sure if you saw this, but I circled VIC from 1937. Thought it might interest you to have data further back in history.
http://postimg.org/image/498dppdrh/
Thanks, John. Can I access this historical charting platform for free?
Sorry it is my $24k a year Bloomberg. They check my fingerprint and all. But ask and I will create some more graphs.
Would like to do a research project of planetary opposition and conjunction going back to 1900 to get a pattern line for each one that isolates if there is a particular repeated pattern corresponding to each. For example, 8/26 is Jupiter conjunction (other side of sun) and several lows over last 17 years have occurred on or near this event. However, stockcharts.com only goes back to about 1998 with candlestick charts, which I have printed and labeled with planetary positions. Seems like inner planets have the most effect.
Seems easy enough. If you create a new google docs account and share with me a spreadsheet of dates, I am happy to check it out.
Manias seem to peak towards the end of Saturn in Sagitarrius, so if one does materialize would expect it to peak in 2017. Thanks for the offer of charting selected planetary position dates, that may be possible in future.
Maybe the way mania could play out is emerging market crisis, govts. react by massive QE so China, Brazil, Russia, India join the debt party which they have not done yet (their debt levels are far below US, Germany). Then the BRIC QE results in a world mania for stocks.
I will be sticking to my knitting of swing trading and probably move to futures for intraday trading so mania or no mania I intend to profit.
What do you think of the market, is this the big sell off that has been talked about? US market the only resilient one given share buy backs and QE and ZIRP. Maybe it’s time has come to follow the rest of the markets? Or is it going to have a mania phase (Saturn in Sag) like it has 29 years ago (1985-87, 1956-58, 1927-29)?
I am a mega bear. However, I see blood on the street in oil and emerging markets. My view is still in flux and I am trying to figure things out. Part of it is reacting to what the FOMC will do next month, and what China will do this weekend.
There is still a chance for a rally due to VIC, maybe even ATH. But as I pointed out in my research, the first month after VIC is volatile and the it tapers off. So perhaps an October swing high.
Is Sat in Sag a two year event or three year event?
Your ranges are two years, but this random site says 3 years.
http://astrostyle.com/saturn-in-sagittarius/
If it means a mania phase, would you say that mania ends 2016 or 2017?
“Saturn will occupy the sign of Sagittarius from December 23, 2014 to June 14, 2015; and then finishes up its transit from September 17, 2015 to December 20, 2017.”
China market peak: June 12 2015. (Two days before the date above)
So why can’t that be the peak because Sat left Sag?
Why is everyone fixated on 2017?
I would say it is near impossible for China to get back to ATH in the next decade.
I look at this and be blowed if I see bullish.
http://stockcharts.com/h-sc/ui?s=%24USD&p=W&b=5&g=0&id=p91913737707
I mentioned a while back that Aug 18 was 6/8th’s of an Armstrong 8.6 year cycle from the 2009 bear low. In theory it should be a high and looks like it was. Its the last major turn till Oct 11 2017 which should be a low.
Thanks Voltaire,
Spot on how you predicted that move,
So what now from here back to the races again?
Thanks in advance
John.
This fall hit when alot of people are on vacation. The fall on thusday was last minute in the session. This would have made it difficult for alot of people to capitalise on it or even prepare for it.
Hi Voltaire,
Congratulations on your call. I recall you from HC days . It never paid to bet against you then either.
Based on the above are you thinking it’s all down hill until then?
Cheers.
These turns this cycle have been important but reversible. So odds are Oct 11 2017 is a major low BUT I wouldn’t rule out new highs before then.
In fact NYA as a proxy looks like it might be just doing wave 4 down to 9900ish before a final leg 5 to new highs.
Now SPX points to 1956 for bounce into B to 2025. Then C to 1820. FWIW
Yeah I would probably agree with Peter if anyone. Real price damage has been done so I personally will look at price levels now for clues. The nasdaq fell much harder so will keep those shorts, my spy short hit target last night and closed automatically. I have a long on gdx from yesterday afternoon and I closed some of my financial sector shorts late yesterday as well that to be fair have been underwater for a couple of weeks.
It would be normal now to see a rally attempt soon at least to try to retest the 2040 spx support that was broken.
Should be ab interesting week. Purvez I always refer to price unless otherwise specified – I never look at past periods in that way.
Good weekend all.
J
It has begun. May was the 4 year cycle top. Today we had a Dow Theory primary Trend change triggered. We will ultimately take out 3/2009 low. If you are a long term investor and not a trader this is my advice: https://youtu.be/meOCdyS7ORE
Lol at that, but for long-term investors, fly into gold or its miners and sit tight for at least a few years.
I am neither short nor long stocks. I sold out my initial longs on the day of the February high. I went long again and sold out the week before the May top. I have stood aside from stocks, ever since, looking to go short.
Unlike most Deltoids I hold that there was a very rare double inversion of the Super Long Term rotation so that point Six is a high and its due date is May, 2015. It certainly looks like that I am correct and even though I am not short neither am I long.
Sitting on Cash and looking to Short is not a bad thing. It isn’t all about going short but is as much, or more so, of selling out longs and going to Cash.
I had thought you were long looking for a October ATH.
Yes, so did I.
Not any more? It is certainly possible if we get a year-end rally. This is also Y3 of the presidential cycle. Just playing devil’s advocate.
China is a different matter…
I am, in order to go short. I am no longer playing the long side of the stock market. From a Delta point of view I am looking for 18 point Long Term solution point six to be a high (mid October) that brings in 6 point solution point two (also mid October) that will bring in Super Long Term point six as a high. However, I know that Super Long Term’s due date is May and every day after that is decreasing the odds therefor I am no longer long stocks but am looking to short at a new ATH –if– Super Long Term point six didn’t come in exactly on its due date or to short at JH’s “second chance top” that will be 18 point Long Term solution point six and possible 6 point Long Term solution point two (but not necessarily point two as it may be early with Super Long Term point six this past May).
Note that with Gold’s Long Term point one (its Long Term “inversion window” and one’s want to be lows) due mid October raises the odds that a new ATH in stocks is still possible meaning that Super Long Term point six may not have come in May but may still come in mid October as I have been consistently posting. Either way I really don’t care as I expect to catch a major down move in stocks from mid October on that will either be a new ATH or what Ellioticians call a Third wave down. Thus, I am not panicking nor long stocks.
Thanks for the explanation.
Please send my greetings to your fellow Deltoids.
How is the weather on Planet Delta these days?
I’m sure jeger is laughing at your calls above (only 3 months in arrears).
I predict the top in gold will be November 2011 by the way.
See, easy game.
GM exactly why I always try to refrain from picking time OR price targets 90% of the time. Certainly there are instances where I will stick my head out and look for a price target, as last week on Monday I was looking for just above 2100 on SPX but generally it is a fools game.
If anyone notices I state either BUY or SELL. I have been suggesting being a buyer og gold and gold stocks for many months whilst being a seller of broader stocks.
I notice John too rarely states price targets.
Thanks for your posts, Richard. Please keep them coming as you are dialed into a lot of angles that few understand, except maybe WD Gann.
I am seeing the Shemitah cycle date of the 23 rd September discussed quite a bit recently.
How coincidently or NOT is it that the Greek elections are going to be held on the 20 th September?
There may just be some big shocks coming again from Greece.
Well I think isaacson should be ashamed of himself tbh. He was calling with great certainty and frequency for an October top but had already sold out. Who the f**o does he think he is? Goldman Sachs?
Either he is a liar or an idiot or both. Any credibility is gone, what a waste of space.
Apologies to everyone else but if people are going to behave like this on a site where sharing ideas between indiduals who are trying to eke some value out then this guy subtracts massively from the point of this in my view.
J
J, I absolutely agree with you. I have no use for people that don’t admit forthrightly they were wrong, but try to pass a bad call off as if it never happened (or even worse, lie about it). If this is what in fact occurred, I’d ask Richard to move along.
My two cents –
Or maybe better said, admit the error, apologize and put it behind him. I don’t pretend to being perfect myself, as amazing as that may sound 🙂
On this Blog I have never –advised– you or anyone else to place an –order–. In America those two words are extremely important. (Btw, there is no such thing as “rights” regardless how much Americans, their media, and their government exposes such).
Sunday post out