
This is a complex time to trade the financial markets. We are trying to forecast against a backdrop of prolonged ultra low rates, collective quantitative easing programmes, united demographic downtrends and extreme debt levels amongst all the major nations. It would be generally inaccurate to say those factors are unprecedented, but they are rare historically.
Debt to GDP levels, only like the Great Depression.
 Source: Peter Peterson
Prolonged ultra low interest rates not seen for 50 years.
 Source: Lance Roberts
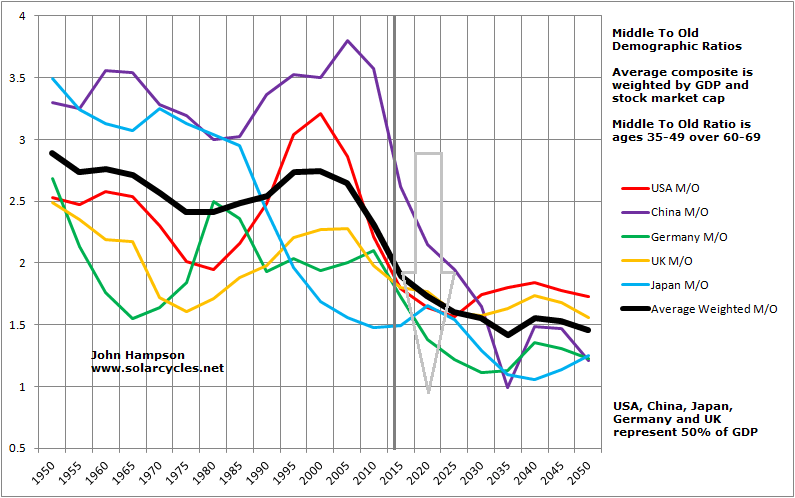
Demographics – here we are in fact making history with middle-to-old ratios, as never before has the world had such an old cohort influencing developments.

Quantitative easing: only seen in Japan the decade prior and in some form in 1930s US.
Plus, we can add that we haven’t seen such low levels of inflation for 30 years. Looking longer back in time we saw a greater spectrum of ‘flation.

Source: DShort
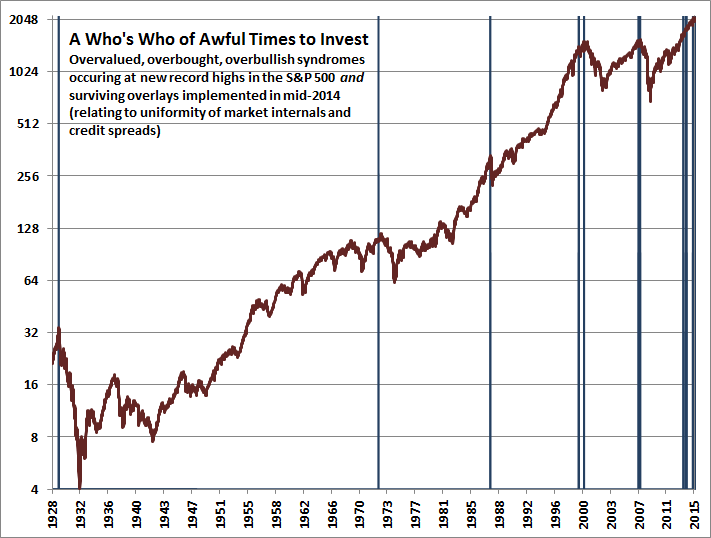
We are seeing other historic extremes too. Aggregate stock market valuations only have the run into 2000 now for company.
Source: DShort
Leverage to GDP is at the same record extreme of the 2000 and 2007 peaks.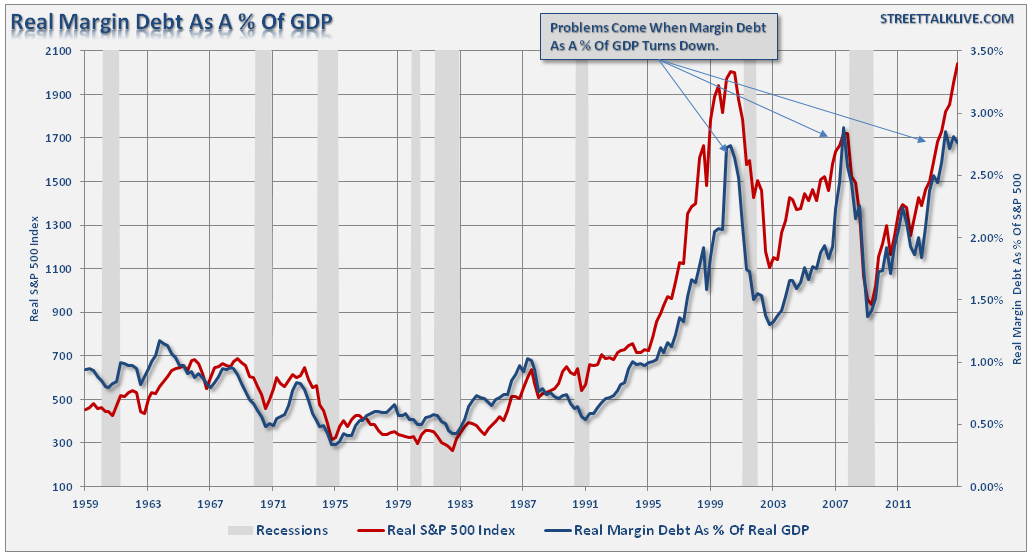
Source: Lance Roberts
US household exposure to equities was only beaten by the run into 2000 in the last 50 years.

Source: ShortSideOfLong
Fund manager allocations to global equities have been bumping up against equal record extremes.
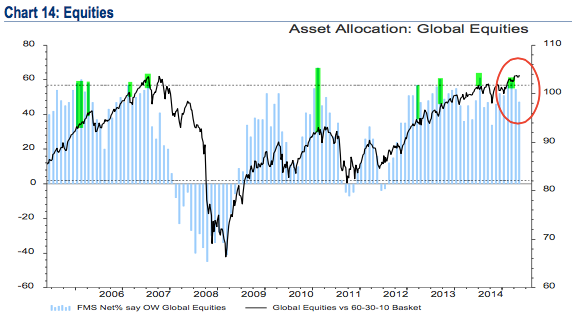
Source: Fat-Pitch
Sentiment towards equities has been record prolonged one-sided.

Source: Yardeni
Add these equity market indicators together and you get this kind of alert:
 Source: Hussman
But now we need to add back in the environment, which is closest to the 1930s-40s. Or the last 20 years in Japan, which was the first to initiate ultra low rates and QE in the recent era, as it was the first major to go over the demographic cliff. How does this change things? Well, for example, we might look at valuations in the context of low inflation and argue they ought to go higher yet:
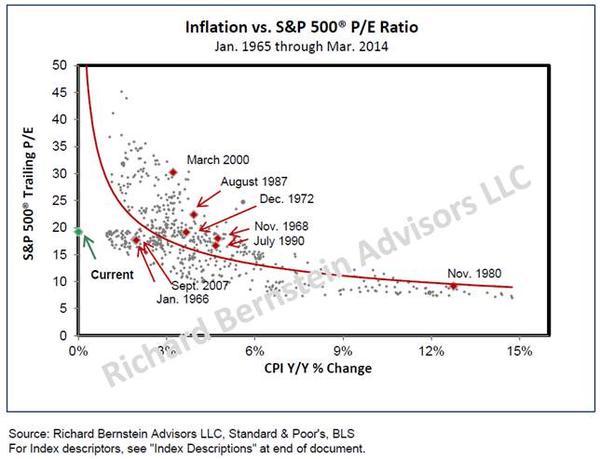
Source: Richard Bernstein
Essentially, when we combine the economic/demographic environment with the financial market indicator extremes, we start to struggle for historical reference points, and therefore some kind of reliable probability calculation of where things are headed.
But there is more to add in to the mix. High frequency alto trading has become much more dominant than it ever was. Markets are globalised – and instant – like never before. Some central banks are buying equities. Plus there are two complex areas where there is a lack of full understanding: dark pools and derivatives. Dark pools are notorious for their lack of transparency, whilst the nominal amount of world derivatives now stands at over $700 trillion (around 10 times nominal world GDP) which is clearly a major threat, but to what degree isn’t truly understood.
Now what does market price action tell us? Bonds are in a 30 year bull market. Commodities are in a bear market since 2011. Equities are in a bull market since 2011 (or we might argue 2009). If we look at US equities adjusted for inflation we get this picture:

So is the equity bull a new secular bull, as per the apparent breakout?
The problem is that various measures put that start of 2013 date as the beginning of the mania in stocks, such as money flow and divorce from fundamentals, and since then we have seen 2.5 years of multiple expansion (price not earnings). Another look at the valuations chart shows the contrast now to where previous secular bull markets in stocks began:
 The path designated by the arrow is the better fit with demographics and would also be historically normal from these extremes of valuation, leverage, allocations and sentiment.
However, given conditions are relatively unprecedented and we are already seeing various indicators move out of historical ranges, we have to allow for something overall unprecedented. Perhaps we could argue that valuations will be disregarded as central banks expand their purchases and in so doing overcome the demographic headwind. However, if we assume they have stepped in as a new class of buyer, then why are leverage levels so high and going higher yet? The record leverage rather fits with the demographic trends and the shrinking volumes in the stock market, namely less buyers but on more credit. However, in turn, we could argue we might see leverage taken to a whole new level (as occurred in the 1990s), much higher than currently, under continued easy money conditions, before we see a collapse. Or we could see something that hasn’t happened before from these valuations, namely that the ‘earnings’ part of the p/e catches up with price and we see all round economic improvement whist stocks tread water instead of being resolved by a bear market.
Let me sum up. 1. Stock market price argues we are in a new secular bull. 2. Stock market indicators argue we are at a major peak, specifically a cyclical bull peak within an ongoing secular stocks bear. These two are incompatible. 3. The economic environment is closest to 1930s-40s US or the last 2 decades Japan, but when all factors are considered has no reliable historic precedent. This is unchartered territory.
If the equities bull is to continue then history will be made, either by central bank purchase expansion, leverage ratcheted much higher under low rates, valuations/sentiment/allocations being reduced from these levels without a bear market, or some other unprecedented development. If a bear market is at hand, then this would fit with demographics and stock market indicator history, but would have limited historical precedent in occurring whilst rates and inflation are low, such as the 1937 stock market peak.
Part 2 ahead.

McHugh says that we just had another Hindenburg Omen on Thursday. There was another one the day before on Wednesday. Therefore these 2 occurrences portend a higher probability of a Market Crash in the coming 4 months.
My friend Dr. Simon Atkins, Atmospheric Scientist, who does analysis of electromagnetic energies hitting the earth (he says intergalactic in source), says that this increased frequency shift will be highest in September. He also portends volatility and a possible crash as a result of these coming energy shifts on the earth.
Do you know how many time McHugh has said that since the 2009 lows? Too many to possibly count.
He is incorrect. I track it daily. 99% of people are using all new highs and all new lows for NYA. This includes ETFs as well as stocks. Thats a no-no. I track using new highs and lows for stocks only. I had several clusters late last fall and early during the winter, but no signals of late. Nevertheless, HO clusters triggered and its only a matter of time. But people tracking them incorrectly since 2009 has given the HO a bad name. Using my method, I got no HO signals between 2009 and late 2014.
yep, ie., don’t waste your time following Hugh anyone.
Reblogged this on thedarklordblog and commented:
Top work JH
Brilliant analysis, John. Don’t assume things are different this time. No central banker can escape the natural forces. The change will come! I have one scenario that gives June 16th as a major change in trend. And this should put us on a path towards a November 2017 low.
Keep the faith!
Hi Andre, So what do you mean by saying a major trend change on June 16? Currently the trend of SPX is downward. Do you mean that trend go upward after June 16? You were right about the cap-day on June 9 although the amazing bounce of the price was on June 10. Thx.
KL,
April 29th a major cycle turned down; causing the high in most European markets. Wallstreet made an inversion early May because of this, supported by other cycles (gravity,astro, daycount) that target June 16th. So basically, Wallstreet is swimming against the stream, pulled foreward by June 16th.
So Monday/Tuesday will see one last, low volume spike up to test this date. After that I expect the start of the bear market that John H. has been expecting for some time.
Tuesday’s New Moon is not just any NM; this one is very special.
Very well written John.
http://www.mcoscillator.com/learning_center/weekly_chart/the_magic_of_150_months/
And this:
http://www.seeitmarket.com/us-dollaryen-currency-pair-could-be-a-game-changer-14455/
Thank you John, Brilliant …n
Thanks all, it’s appreciated
Would be interested to know if part 2 is already set in your mind, or still in flux? This is the first post in a while that had no references to the sun.
You caught me out. Yes it’s ready in my mind and yes it will bring the sun into the pic.
John, regarding economic growth and demographics, this certainly validates your analysis:
https://www.businesscycle.com/ecri-news-events/news-details/economic-cycle-research-ecri-simple-math-output-growth-in-hours-worked-real-gdp-growth
Thanks Gary
3% looks like the maximum margin debt to GDP, but as a reference, China is currently around 3.4% and the US in 1929 hit 12%. Some crashes occur at lower percentages, so perhaps the number is a bubble lacking a catalyst or predictive power.
12%! Useful thanks
We probably won’t go there again in the US due to Reg T.
But in China, I don’t know. There seems to be more leverage than the calculated 3.4% level, since many CEOs borrow with their shares as collateral. But let’s say China is determined to exceed 1929 analog and in central planning all is possible and awesome, then we still have 4x to go. They are doubling margin every 6 months, so it could be a year.
Not a prediction — trying to find worst case for bears.
John H. I have a question for you: lots of sentiment indicators seem to indicate an overabundance of bullishness. You frequently mention them.
But if you simply look at the price of options “on the ground” — meaning, the price to actually trade them — the cost of out-of-the-money puts is WAY WAY WAY more expensive than equivalent out-of-the-money calls. In some cases it’s ridiculous, as much as 10 times more expensive to bet on the downside than the upside. This is for the options on ES futures.
This strongly suggests that in the real world, not the world of polls and questionnaires, there is a major surplus of bearish opinion.
Please look at the options table for the ES and let me know your opinion. Thanks.
I was thinking the same yesterday. The bulls have been calling this the “most hated rally” ever. And in hindsight, they were right.
http://www.aaii.com/sentimentsurvey/sent_results
AAII was frequently below 30% bulls in 2009-2013. This changed in 2014, and so as JH mentioned, the “mania” might have started later than we thought. That is, not 2009 or 2011, but JH’s 2013 and AAII’s 2014. The best chart to see this is the Shanghai graph, which only ramped up from mid-2014.
Out of the money options is not something I’m too familiar with, maybe someone else can chip in. AAII has a very unpredictive history which is why I choose not to reference it. But what I always try to do is bring together several sources in case one is failing. If we additionally draw in NAAIM, Rydex and open interest put call ratio they confirm the lopsided bullishness. Then if we cross ref with allocations ditto.
Hindenburg graph from Bloomberg.
http://postimg.org/image/au2mv636l/
Thanks, but I stand by my statement…
—————————————————
He is incorrect. I track it daily. 99% of people are using all new highs and all new lows for NYA. This includes ETFs as well as stocks. Thats a no-no. I track using new highs and lows for stocks only. I had several clusters late last fall and early during the winter, but no signals of late. Nevertheless, HO clusters triggered and its only a matter of time. But people tracking them incorrectly since 2009 has given the HO a bad name. Using my method, I got no HO signals between 2009 and late 2014.
Bloomberg corrects for the errors you mention.
I’m looking forward to Peggy’s next spiral update:) another great call w/ targets of 2098, 2094 2091. I’m 2 for 2 on my call credit spreads. laid out 50 of the 211.50/212s for .21 cents on Wednesday. risked just under $1500 for just over $1000. expire today.
I also have another 40 of the 212 /212.50s for next Friday for another .22 cents. also placed on wednesday
Are you saying it won’t go above 212.5 or that it won’t go under 212?
My play is that by next Friday SPY will be less than 212. Breakeven is at 212.22 excluding transaction costs.
My play for today was that Spy would be less than 211.50 and breakeven was 211.71. I sold the 211.50s on Wednesday for .61 cents and bought the 212s for .40cents. they expire today. net credit of .21 cents
In essence laying out .29 cents risk for max gain of .21 cents. risking 100% for a 72% return in 3 days. I may close out the contracts today for 2-3 cents just in case of a black swan greece agreement. I didn’t like the spike up at yesterdays close
I was sick and tired of being right on trades but watching theta burn away all the premium. Yesterday was touch and go w/ the Spike to 212.09.
Make sense given this grinding market…
closed 30 of my 50 contracts that expire today for $60. will let the other 20 expire. free up margin in case of a rebound to add in later spreads for 6/26 or 7/2
i don’t see peggy’s spiral postings today, but on twitter she posted 2087 and 2081 are updated targets about 20 minutes ago
Although I respect the spiral theory and do acknowledge some uncanny accurate calls posted by Peggy, I think you have to take what is posted with a grain of salt especially when you seem to be utilizing it quite heavily on some speculative derivative trading.
A various bunch of target numbers get posted out multiple times and also revised multiple times and on several instances when market prices were near extreme levels, an even lower “possible” target price(s) was then given, and then the market reversed violently in the other direction.
The market zig-zags in the very short term (i.e. daily or shorter time frame) in somewhat unpredictable and irrational fashion. Many, many times I have projected the market say going from say 100 on Jun 1 to 105 by Jun18, but the path inbetween getting from that point A to B (even if eventually correct) is surprisingly unanticipated!
It seems that way because the market has traded in a unusually narrow range. The easy trade is from Singularity 6/6 to Expansion 6/20. The predicted target was 2107-2108 and was reached in 2 days. I doubled my money. Since then I have been predicting a target of 2087 which was reached today. Yes, the target was lowered to 2081 today. The Spiral expects a low of 2081 by early Monday. The Spiral is expanding until 6/20 and I expect another uptrend after 2081 is reached.
Yes, but also on Jun 9 (with the markets at the extreme low near 2070) you also posted this “Spiral update – more downside ahead – next downside targets 2066, 2056”
What I have observed is each time the markets approach near an upside or downside target price, you post possibilities covering every scenario, such as even lower downside targets still possible as well as upside higher targets expected in the near term. In other words, an expectation for a higher move is anticipated but it is unknown whether the market has completely bottomed out yet or not before that move occurs …
Do not get me wrong since I do appreciate your posts and there is definitely merit to the spiral theory IMHO. But expectations for highs/lows to occur at exact times along with approximate price forecasts when there is no realistic possibility of knowing whether it will be a higher-high price or a lower-low price can be quite disastrous too.
yes Pulp. will do
at the airport… there’s a low early Monday – Spiral expects 2081 by then
Steve and Peggy, thanks for engaging in this back and forth. It’s very useful and allows me to better understand Peggy’s process and the potential pitfalls. I know there’s no criticism meant in what Steve writes, just an honest explication of what he’s seeing. That’s helpful, as I had some of the same questions myself.
hi Steve – trying to respond to your post above. I think I’m not making clear what are short term price targets and what are longer term targets. I was posting at that time that a longer term low was expected and posted that the next high had a price target of 2107-2108 – that was shortly after the market turned back up (over 2070). The next lower price target was 2066 – just 4 points away. I will make a better effort in the future to separate short term forecasts from longer term ones.
Peggy, how far ahead does the Spiral system forecast? Can a chart be constructed showing expected highs and lows and, if so, how far out? Sort of like the Bradley turn dates.
Sean has 10 minute data to for the Spiral out to the year 2182 or some such distant time. And yes, the expected highs and lows for any year are calculated with that data. As you’ve see, the shorter cycles pinpoint the timing of the larger cycle. As for price, that is a different set of calculations and “Price” (as I understand it) is actually the outer edge of the Spiral. The 7442 Analytics longer term forecast for the S&P is 2325.
Peggy, would you be able to add a timestamp on your posts when you are doing shorter price targets?
Hey Scott, what is Peggy’s twitter handle?—not able to find it
It is right in her name @mjmateer
https://twitter.com/mjmateer
fantastic stuff, amazing how the mkt is holding up despite all the bearish divergences, will be interesting to see if dollar strength resumes post the fed, that would be an indicator of a sell off, the fed of course will try to talk the dollar down and get the market up, will be interesting.
Thanks
FWIW as a follow up to the fake print conspiracy .. “I just noticed another fake print just now (Jun 4) at 211.86 (when the price was below 210.35)” … this FP target got hit yet again yesterday Jun 11 after one week.
However, the path to get there would have been quite endearing because it would have required a big drawdown to about 207.7 from 210 before fulfilling that long call. There obviously must be other hidden signals or patterns when the FP gets successively printed numerous times intraday (i.e. frequency) as to how or when it arrives to such targets, but that is beyond my ability and I am obviously not part of their exclusive elite insider group.
FWIW I noticed another FP occurring multiple times today (Jun12) at 211.59 or 211.69 (I lost it when I refreshed the chart) with the price around 210 +/- 0.1
The Jun 12 FP was 211.47 (not 211.59/.69).
most interesting little discussed development that i noticed is the strength of the renminbi vs. the dollar. It looks ready to break out and will probably lead to the abandonment of the current peg. May be necessary for inclusion in the revised SDR, but i don’t think any market participants are ready for it. May be quite disruptive.
Interesting. One to watch. The inclusion of the yuan in the SDR basket has many potential effects, including am update on Chinese official gold holdings. Just as the bear is getting going too.
As I have stated in the past RE HIndenburg Omen there is a very strict criteria to giving a signal.
Many analysts that state that a HO sgnal has been triggered are in fact incorrect because they have NOT strictly adhered to the criteria.
There wss only one person that I ever gave credence to in regard to legitimate signals.
Hi Allen, so are you saying that we currently have a valid HOmen signal ? has your one person you trust issued that opinion?
Here are my Hindenburg Omen signals (see vertical lines).
http://stockcharts.com/c-sc/sc?s=%24NYA&p=D&yr=10&mn=4&dy=0&i=t32063152579&a=379612359&r=1434191292715
http://stockcharts.com/c-sc/sc?s=%24NYA&p=D&yr=1&mn=0&dy=0&i=t66363582051&a=379612359&r=1434191406455
As I stated above, the sheep forget to not include ETFs in the new highs and new lows. My track record aint bad, is it?
Try these links…
http://stockcharts.com/c-sc/sc?h=%24NYA&p=D&yr=10&mn=4&dy=0&i=t32063152579&a=379612359&r=1434191292715
http://stockcharts.com/c-sc/sc?h=%24NYA&p=D&yr=1&mn=0&dy=0&i=t66363582051&a=379612359&r=1434191406455
I hate stockcharts…
These will work…
A well thought out post John, and very useful for helping to put things in perspective.
I find the “Interest Rates Can Remain Low For A LONG Time” chart especially interesting. At a time when people left right and centre are screaming about the absurdity of negative rates, how they’re being artificially held down and causing massive unprecedented distortions etc – the chart shows that from a longer term perspective there is nothing particularly unusual about the current interest rate environment. It was only the high rates of the late 1970s that were unusual.
Thanks
http://www.mcoscillator.com/learning_center/weekly_chart/the_magic_of_150_months/
Here is a chart from Macmillan service . The Macmillan ocsillator
Magic of 150 months
Thank you John
glad you start to admit this time is different! And it really is:
1. Never before we had nearly ZERO interest rate for so long time in so many countries.
2. Never before we had computers where central bankers could print money by pressing ENTER.
3. Never before we had this globalisation which allows easier flow of money.
At the end we will have to deal with the massive global debt. There is no doubt about it. The only think is that based on 3 above this process is postponed. Because we have no historical correlate, it is impossible to predict the turninng point based on historical data.
Regarding solar peak Nr. 24: there have been a few situation in history when there was no major decline in stock prices within 2-3 years after the solar peak… As an example take the 1989/1990 solar peak. Yes we now historically say that at that time it was because of so positive domographics. Perhaps in future we will say we did not dip in equities because of ZIRP and central bank buying equities.
Further I want to make you aware on “Debt and (not much) deleveraging” from McKinsey Global Institute, showing that we indeed have not learned anything and current global debt is much higher then in 2000 or 2007… You may find this helpful for your 2nd part.
Thx for your work
Sinuhet
and the link is: http://www.mckinsey.com/insights/economic_studies/debt_and_not_much_deleveraging
Great, thanks for that
Are you suggesting another wave up?
The difficulty is matching the minimum to minimum — is it the point of maximum statistical error?
Thanks for these
I track Option-Adjusted Spread which is THE best leading indicator of risk aversion in equity market. I have found it to be better than VIX.
I made 2 charts with spread and sp500 together. These charts are must see for all having bearish view.
1. http://tinypic.com/r/fjhov7/8 (See how it suggested top in 2000 and 2007)
2. http://tinypic.com/r/mh7rr5/8 (Latest chart)
Currently, no signs of top in near future as yet. Comments welcome.
could you explain what are the components of this? thanks
http://tinyurl.com/ohwzbae
is there a ticker symbol for OAS or how do you create the chart? thanks
Wherearewe,
Unfortunately no ready chart available on the net for OAS. I take data and feed in to my NT.
Jigs – how quickly can this spread break out above the range? Could it happen within a two-month timeframe?
The reason I ask now is because US indices have formed a distinct range (1980-2120 for SP500) during the first half of 2015 which is very similar to that formed by Dow during the first half of 1929. Then during June, July and August 1929 Dow surged by 28% in its final manic phase (ie. after going nowhere all year).
That is the equivalent of SP500 surging to 2685 over the next ten weeks! (I’m not suggesting that will actually happen, by the way).
Yes Mark this definitely remains possibility that spread crosses current range in next 3-4 months assuming SP500 follows 1929 path. As we have seen both charts sc24 mirrors sc16 till date. I will continue to update on spread going up.
Also note that back in June 1929 SP500 touched its 10 months MA 24.69 and then started rally to touch 32.24 in Sep 1929. Last close of Sp500 is 2108 and its 10 months MA is 2048.
RUT weekly – no predictions, but long lower wicks speak to building bearish pressure: http://schrts.co/CnQd5S
Long silver here: http://stockcharts.com/h-sc/ui?s=%24SILVER&p=M&b=4&g=0&id=p10870445650&a=390348593&r=1434201948612&cmd=print
I know this isn’t an Elliottwave site, as I’m here sporadically. But I consider EW just another cycles indicator (one of prices). I just posted my cycles, EW, and planetary prediction for the US markets for the short term here. Comments welcome here or there.
http://worldcyclesinstitute.com/second-wave-fake-out/
I think we’re at an important market inflection point—about to confirm the longer-term downtrend over the next week.
Is your prediction for another swing up and then down? Seems a lot of that is hinging on intraday movements governed by Greece rumors.
At this point, these are relatively small moves. They simply explain the wave structure based on Elliott. Could be. On a larger time frame, I believe events follow the market, so I don’t give them that much thought.
ridiculous wave count… fit it to my forecast
it is simple the ED is not finished
Thank you Peter. You did make the May 20 th top call to the day, i know that for a fact. I have been waiting for this post. Stay strong …nicola
Mahendra is the best forecaster I have come across but I don’t understand his methods.
Says SPX turning bullish here and 3200 by March 2017.
http://talkdigitalnetwork.com/2015/06/us-equity-markets-safer-than-chinas/
Thanks for that link – I haven’t listened to the interview yet, but I definately will.
I think Mahendra Sharma looks mainly at planetary positions and movements. The charts posted by Chien-Jen above (which have also been studied by Jigs, Joseph Teofilo, Milan and myself over the past couple of years) show that the time range for the end of the current speculation is between 2015 Q3 and 2017 Q2 (but arguably as far away as 2017Q4).
Within that range, 2016 Q2 and 2017 Q1 are the most significant.
Also, now that SP500 has surpassed and backtested 2065 (Fibonacci sequence 666-996-1201-1366-1531-1736-2065), it is still subject to the bigger sequence 455-1110-1515-1840-2166-2571-3225.
3225 by 2017Q1 (“3200 by March 2017”).
The only thing I’m aware of that connects all these things – planets, sun and market movements – is Phi.
Part 2 any minute now…
For a turn down we would expect volatility to pick up;
1) Mars has been OOB for some days with the promise of volatility, but Venus and Mercury have been coming down from extreme north positions since April 10th. This kind of counteracted Mars’s impact. This weekend Mercury decides to join Mars in declinational direction by showing a declination inversion. This will likely tip the balance and unleash the impact of mars.
2) Neptune just turned retrograde with Saturn still retro until early august. So now 2 big boys retro at the same time (and Mercury still in the shadow)
3) June 27 the Sun squares the lunar nodes, triggering a moon wobble period that some people say is worse than Mercury retro. All hard aspects of the sun give moon wobbles, but squares are the worst and they happen every 173 days. Counting back 2 weeks from the 27th we arrive at this weekend.
Kind of weird they all come to life this weekend.
Many other reasons why next week is pivotal, so I agree with Peter Temple.
Thank you Andre
Andre, really interesting stuff. I don’f follow planets to that degree. I’m going to have to start educating myself very soon, I have developed over the past three years or so an understanding of the impact of planet positions on life on Earth. Thanks for posting this.
Okay, one more. Tuesday Sidereal Earth enters Sagittarius, home of the galactic center.
Andre, could you explain the importance of this (in 25 words or less)? For we uninitiated …
Peter,
The galactic center is an important orientation point in the galaxy. The main point I was trying to make is how everything synchronizes this week. Be assured this is more about astronomy than astrology. Jupiter, Venus, earth and Mercury (when at perihelion) have a tidal pull on the sun affecting solar activity and the interplanetary magnetic field.That’s why I prefer a heliocentric view.
With earth conjunct the GC I expect more volatility. Sidereal astronomy is the only stable (in time) system. So this conjunction always happen in June. Never wondered why the Bradley siderograph seems to peak in June, regardless the year?
Bit more than 25 words, but there is so much to know.
Great! Thank you for this.
To initiate you some more, let this sink in a bit. I copied it from the net.
“Electric Galaxies have Electromagnetic Hearts
The well-established study of plasma cosmology shows that galaxies are an electrical phenomenon. It has been found that filaments, arcs, and shells characterize the small-scale structure of molecular gas in the Galactic Center. They are all well-documented electrodynamic plasma configurations. A single charged particle in 10,000 neutral gas molecules is sufficient to have the gas behave as plasma, where electromagnetic forces dominate. Conventional theorists admit to “no plausible explanations either for the origin of the complex kinematics or for most of the peculiar features.” In May last year I described the plasma focus phenomenon generated at the Galactic Center by filamentary helical “Birkeland” currents flowing in along the spiral arms and out along the galactic spin axis.”
I know for sure humans are susceptible to light, temperature, magnetism, gravity and electricity. And it is not a far stretch to assume that the sun between us and the GC or not makes a difference.
I have lots of data (and stories) from studies on how we’re influenced by electromagnetic waves, and of course, any large mass emits them. Following the dots as to why social mood changes worldwide all at the same time is getting easier and easier to do.
Here’s a great article on the symbiosis of physics and astrology. It is not a material force but a meaning force that links planets and phenomena. E = mc2 and there is one more element left out of that equation: “meaning”
http://technovate.org/web/articles/astrologyandphysics.html
And June 16th will be 8 months (a solar degree trine) after the October 15th low.
http://www.zerohedge.com/news/2015-06-13/writings-wall-texas-pulls-1-billion-gold-ny-fed-makes-it-non-confiscatable.
Apparently, even Americans don´t trust the FED anymore. Bullish? My ´beep´.
http://stockcharts.com/h-sc/ui?s=%24INDU&p=W&yr=13&mn=0&dy=0&id=p77726088010&a=155728826&r=1434281652857&cmd=print
message from stocks and bonds agree with John that this is crucial juncture
http://stockcharts.com/h-sc/ui?s=TLT&p=M&yr=17&mn=3&dy=0&id=p15340193779&a=333536382&r=1434282224486&cmd=print
Great Information! It’s a real pleasure to read all your opinions. Thanks to our host John H. Andre: I find your posts very interesting, could you please provide a beginner with some material to get started on that astronomy stuff, a website or a book would be great. Thanks!
Participation reducing quite consistently during the ongoing bull. This is a muted correction. There is no crash on the horizon. Interest rates cannot rise without remaining (primarily central bank) participants losing grip on their purpose/credibility and so they (rates) can/will not. Even Elliott theory is stretched by the extended bull and flattening. But backs are not the directors game that they once were, but it keeps the salary flow running at least. Flat can be sustained indefinitely. Its that or be voted out. Everything else is castrated and useless.
Although but backs has interesting connotations buy backs maybe makes more sense
6/14 8:46 pm et Spiral update – expected a low before the open Monday of 2081. Target reached. Now looking for 2100.
Sunday, June 14 is Mars conjunction (Mars — Sun — Earth). Mars being on the exact opposite side of the solar system from earth has maximum effect. Mars has the effect of lower prices imo and based upon a quick look at previous 20 years of data.
Lunar Chord:
Phase: bullish new moon week
Distance: bearish, distance of moon is increasing
Declination: bearish, post equatorial crossing
Seasonals: weak tomorrow, strong Tuesday to Friday
Summary: am short the SP500 at this time, will exit short Monday sometime, unless Monday is so far down in price that it implies a further weakness.
Part 2 out now