
The world economy is currently in trouble, showing both recessionary and deflationary coincident data:

Source: Ned Davis Source: GaveKal
Given these, the resilience of equity markets has been pretty amazing, even more so as we are now a year post-solar maximum:
 The last six months has been particularly weak economically, and normally historically stocks would have sold off leading into this, with stocks typically leading the economy.
In fact, under such extreme levels of valuation, allocations, leverage and sentiment, together with growth, ‘flation, and earnings all rolling over negative as well as the speculation peak of the solar maximum through, the case was extremely strong for 2014’s October sell-off to launch a fully-blown bear market. The weakening economy over the subsequent 6 months and the wealth-reduction effect of the declining stock market would then have fed off each other to create fairly significant devastation.
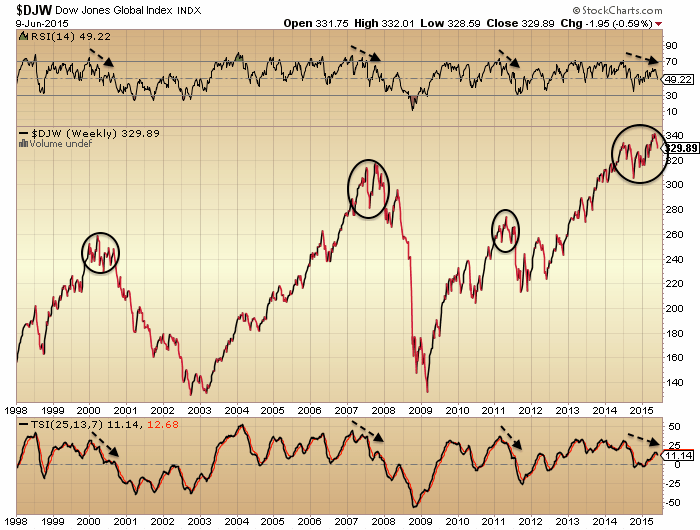
But it didn’t happen. Stocks were somehow saved. However, as pre previous posts, we see a lot of degradation in internals and cross-referenced data since mid last year, giving the potential for price action since then to be ‘last-gasps’. Below is the Dow Jones World stock index which reveals a similar higher high against weakening strength to the last 3 previous major tops.
 Source: Stockcharts
Plus, we have seen a sell-off in recent weeks, making that higher high maybe a fake-out high. We still see saturation levels in valuations, allocations, sentiment and leverage and many negative divergences that all support the bear case.

Source: Stockcharts
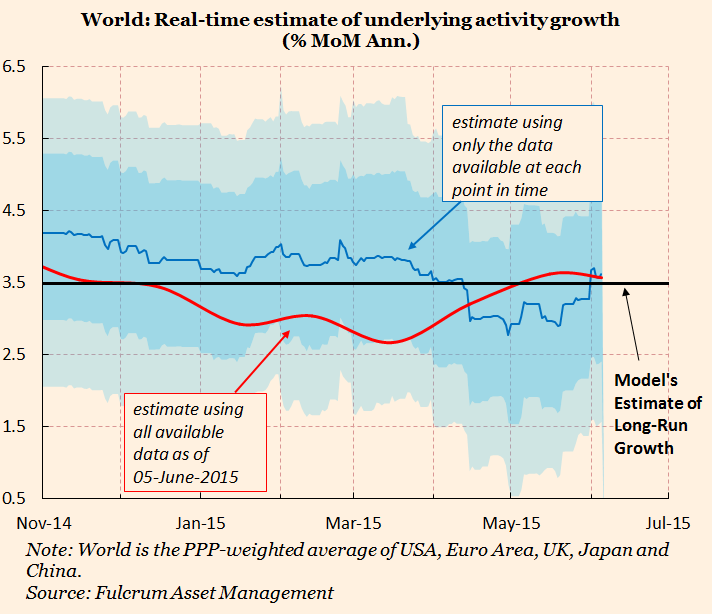
However, set against this, we have recently seen a turn up in leading indicators and what maybe a bottoming in coincident data.
Coincident:
 Source: FT
Leading:
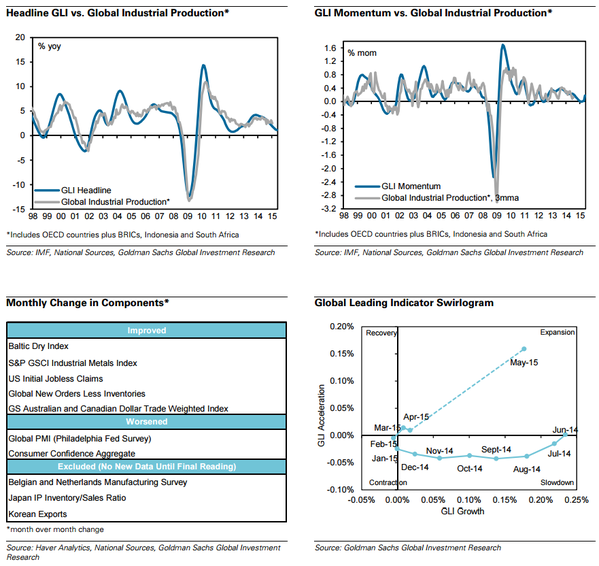 Source: Goldman Sachs
At the same time we have seen some money exiting bonds and inflation expectations recovering, suggesting some of the expected pick-up being priced in by market participants.
However, real money leading indicators predict this to be another non-sustained pick up in global growth, i.e. still not the move to sustainable strong growth that leads to central banks starting to raise rates. Rather, they predict the growth to peak by October this year and then give way to weakness again.
The key question, therefore, is whether equities can now rally again and keep the bull market going over the next few months against a backdrop of improving economic surprises. If so, then we would need to see stocks repairing this kind of bearish set-up of fake-out plus divergences:
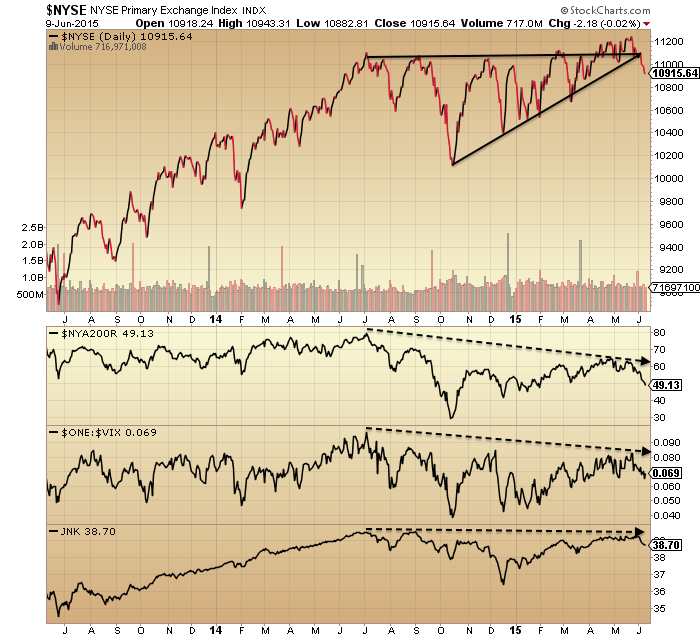
Source: Stockcharts
If stocks can do that, then an obvious reference point would then be 1929, with a potential Autumn/Fall peak, a similar length of time post-solar maximum, at similar extremes of valuation and leverage. Anything beyond that and there would be no further reference points. This really would be unchartered territory for world markets, whereby the ‘old rules’ no longer apply.
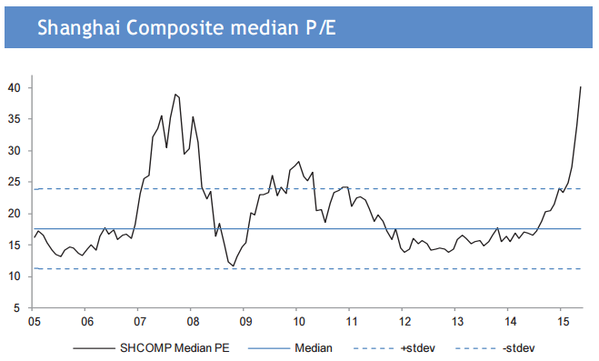
Here’s a look at China’s stock market. The divergence from GDP is extreme and as such valuations are now at a new record.

 Source: Sober Look
The rise in margin debt in China has rocketed. Leveraged-based stock rallies are ponzi-schemes, making for a risk of a major unwind at any point. The leverage situation around the world is similarly flagging that risk.

Source: DShort
In summary, I believe this is where we find out what really moves the markets. My position on that: dumb forces. Demographics, solar cycles and simply running out of buyers. By the latter I refer to saturation in valuation, leverage, sentiment and allocations: everyone on one side of the boat and borrowed up to the max. We can see additional clues to the fuel drying up in divergences in breadth and other indicators.
June/July is the seasonal geomagnetic peak, so I don’t rule out the possibility of a short rally back up here in stocks. But unless all those under-the-hood July 2014 peaks are repaired, together with the bearish technical set-ups and negative divergences, then I expect leading indicators to be disregarded here, in the same way negative leading indicators were disregarded several months back. The fact that the market has risen against both positive and negative leading and coincident economic data the past 2 years is a clue that economic indicators aren’t the driver. So is central banks? I refer you back to the top two charts. After billions spent on QE and ultra suppressed rates, we still have a world economy on its knees.

Spiral update; revised price target for today 2070
GM, your last line is the best response for “those” people.
Seems he was embarrassed enough to delete his posts. Blind or stupid I wonder?
I am corrected now by the live stream – 2091 upside target and 2074 downside. http://www.ustream.tv/channel/7442-analytics
New higher price targets 2096, 2099, 2005. Spiral expects a high midday
Lab 7442 live foreasting price high 2007-2008
typo 2107-2108
Bigger picture Spiral update. The Spiral is now expanding until 6/20. The current up wave is expected to be complete by 6/12 at 11:10. Current price target is 2108
The next low is 6/15 at 2:00 so it’s possible that low will happen on Friday or before the open on Monday. Price targets can be revised.
JH,
Regarding the margin debt chart, I drew my own chart, but normalized by market cap rather than inflation. I think that is more relevant measure of leverage. It would show the 3 peaks more or less inline with each other — so still extreme, but at this point we are always surprised aren’t we?
Which index would you choose to measure you short reentry? If we follow the DAX, it would seem that we should be fully short, but if we follow Shanghai, we should be stopped.
Regards,
I’m currently short the Dow. I still think the US indices are the juiciest shorts. I’m looking at the RUT for an entry but want to see some kind of breakdown.
Good luck! I think today might be a second chance rally for the Dow, just in time for the Bradley bounce I mentioned several days ago.
2107-2108 price target reached.
Hi Peggy – can this 2107 level be shorted? Appears to be a fake break out on a Greek deal.
can’t answer that… but will say that the Spiral is expanding to 6/20 – expecting a high in that time frame – can’t say whether it will be a higher high.
Spiral update – first price target 2091. 2065 is still possible.
GM, for some reason your comments are pushed down to the bottom.
i responded to one of them regarding the implementation of a new standard response to those with limited experience who “know” that central banks will always! make stocks go up! – Good luck, you’ll need it.
selling some more net credit call spreads over the next 2-9 days. the last batch worked so well:)
from zero hedge a few minutes ago
Germany Talks Back Latest Greek “Fix” Rumor, Futures Refuse To Drop
Germany will only accept a cash-for-reform deal between Greece and its international creditors that has the approval of all three lending instutions, a government spokesman said in response to reports that Berlin was considering easier terms.
Asked about a Bloomberg report that said Chancellor Angela Merkel’s government may be satisfied with Greece committing to at least on major economic reform sought by the creditors, the spokesman told Reuters: “Germany will only accept a proposal of the three institutions. All else is a pure invention.”
The spokesman said Merkel and French President Francois Hollande would meet Greek Prime Minister Alexis Tsipras for an update on Greece’s debt negotiations later on Wednesday after a inner at an EU-Latin America summit in Brussels.
Merkel said earlier that her message would be that Greece must negotiate with the institutions representing the creditors.
Tsipras, who has rejected several of the creditors’ key conditions for a deal to unlock frozen aid, has been pressing for a “political agreement” among leaders to break an impasse in detailed negotiations.
Quick!……do something. All three indices are below their 50 dma’s!
Easy fixed. Just release another report that a Greek deal is on the way and sit back and relax!!
Mind numbing….let’s ignore the fact that company earnings are a total farce and bond markets are non-functional.
The 100-SMA has been a very strong support indicator over the past while, and each breach just below it only lasted one or two days before a strong recovery. The only exception was last Oct 2014 correction.
Yes Steve amd it is more than coincidence that everyone watches MA’s and support levels, including CBer’s and media releases just happen to energe at crucial moments.
not to mention the bilderberg meeting 10 days ago to determine when world war III should begin!
http://www.zerohedge.com/news/2015-06-10/meet-participants-years-bilderberg-conference
So there you have it anotjer unfounded rumour in the media causes indices to jump and it would be very interesting to know who was actually responsible for it in the first place.
“A German spokesman dismissed as “pure invention” a media report that Merkel might agree to a deal”
Revising target for price low to 2091-2093
QQQ testing the wedge it fell out of…..
And NFLX jumps to a new ATH. I mean it’s not like it’s in an extremely competitive space or that its share price vs actual earnings is extreme or anything.
What a disaster that is going to be!
Don’t forget about Shake Shack’s new chicken burger which is in development. This may support their valuations.
JH, thanks for this update. I don’t really see how the divergence between China’s growth and its valuation matters. The correlation between growth and equity performance is negative over time anyhow. Also, China’s valuation in aggregate is not stretched by past standards. I daresay China’s current boom/bubble will end in tears, but that is not much of an insight. I’d be more concerned when aggregate PEs approach past peak levels, which they are a long way from doing.
Given the big up day, Nicholas is strangely missing. Has he been censored? Because he was such a good signal…
I think futures just figured out they’ve been PUNKED again. Peggy’s posts continue to be Prophectic or should I say Spiraletic?
SPX500 futures at 2096.50 as of 5:30 CST
http://finviz.com/futures_charts.ashx?t=ES&p=m5
finviz.com looks like futures have bad data. chart appears to have switched from june to septembers. all other sites only show futures down 2 1/2 -3.
Perigee today and equatorial crossing today often followed by 4 trading days of lower prices. Price looking supportive, so am in small sized short position.
Hi folks, in Madeira on holiday so just a quick
few thoughts.
Firstly in terms of stocks doing nothing YTD, well it
depends where you are invested.
The MCX where I have holdings is Up over 10% YTD.
The FTSE SmallCap (SMX) over 9% Up.
IBB which has been termed biowrecks by one poster here
is Up over 20%.
The RUT also ahead nicely and now less than 1% from
taking out it’s all time high.
I mentioned last week that it was ridiculous to ignore
stronger recent US data and this imv is largely behind the
move in yields, deflationary concerns are beginning to ease.
Of course any of this can alter over the summer.
I appreciate GM alluded to the move in US yields as a fakeout,
that view is likely to be incorrect again.
Peggy, some fantastic recent calls, you have been on the money.
Is this ttrad again, impersonating Phil.
How cruel.
Hi folks ! Everything is going smoothly in my view. IBB and Nasdaq are still near the highs. Central banks are doing a tremendous job in managing the markets.
John writes that soon they will be no more buyers, that the buying will exhaust itself. I disagree strongly because central banks have unlimited buying power, and are willing to use it.
Regards
“I disagree strongly because central banks have unlimited buying power”
Actually that is incorrect Nic.
Phew..I thought you left us! Welcome back!
This will be FB’s eventual downfall. The young people I speak to are already beginning to become more aware of the extent to which they are being tracked. This will lead to a backlash at some point as young people rebel. It is what younger generations will do at certain periods as history shows. Think the 60’s.
FB need to be very careful as they starting to cross the line!
http://finance.yahoo.com/news/now-facebook-wants-know-where-181200629.html
Spiral update – this minor upwave is expected to top at 2116
After hearing a AAII rep go over how their sentiment works, low bullishness and/or high neutrality were the only aspect that had predictive value. I remembered how the Investors Intelligence bearish % has been very low for a long time and clearly has not worked. So I thought an overall reassessment was in order, expecting to find many indicators like bearish sentiment that really do not work. Well, many if the indicators we used formally did work, so why not now or this time.
My theory relates to the credit cycle. Normally, the very dynamic US economy starts sucking up excess liquidity very rapidly during a recovery. Just the needs of the housing industry are pervasive throughout the economy. Same for autos. This recovery has been so slow it appears that we are just recently even getting close to that stage – where demand for funds cause interest rates to rise and the FED to start tightening to prevent inflation.
The credit cycle predictor I use is Strategic Market Timing by Dick Stoken. It gave a deflationary spiral sell signal in January, clearly not working either. Also in Japan, over the last 35 years, when they stopped various QE programs, the economy, stk mkt, and employment which had been helped quickly started falling again within a year. We are at 6 months now. So we have a deflationary spiral sell, stopping QE sell, and a slight further rise in interest rates will give an interest rate sell, plus seasonal weakness due. This all on top of all John’s data.
Should have just listened to Gann’s Master Time Factor (60 yr cycle) which called for a prolonged stk bull mkt and commodity bear mkt like the 1950’s.
Or, perhaps, just be a tad more patient, as this thing is toast. Cold, stale, mouldy toast at that.
Spiral price target 2089-2090
weird Hi Folks usage history in comments on this site by posters with different names
Spiral expects a low 6/12 7:00 – 7:20 ET – price targets 2098, 2094, 2091
Although I have been harping on the poor action by the Dow Transports, I also note that a bellwether of economic activity, Federal Express, has broken out to new all time highs. Albeit one data point and with the caveat there may be factors at play I’m unaware of, the price action in the stock is obviously not indicating a weakening global economy, rather just the opposite.
Hidenburg Omen flashing again.
Do you have a link?
It is on my Bloomberg, HIND function.
needs confirmation http://www.zerohedge.com/news/2015-06-11/bonds-soar-stocks-snore-after-good-news-sparks-hindenburg-omen-uncertainty
found this a few minutes ago
Thursday, June 11, 2015
Hindenberg Confirmation
Second day that all Hindenberg criteria meet.
Need two observations to confirm.
The criteria
Here are the FIVE requirements for a Hindenberg:
The daily number of NYSE New 52 Week Highs and the Daily number of New 52 Week Lows must both be so high as to have the lesser of the two be greater than 2.2 percent of total NYSE issues traded that day.
The NYSE 10 Week Moving Average is also Rising, which we consider met if it is higher than the level 10 weeks earlier. This is different than looking at the current slope of the NYSE 10 week simple moving average. The slope can show rise while the overall level is lower. This is a criteria fail despite looking like a criteria pass
The McClellan Oscillator is negative on that same day
New 52 Week NYSE Highs cannot be more than twice New 52 Week Lows, however it is okay for new 52 Week Lows to be more than double New 52 Week Highs
There must be more than one signal within a 36 day period, i.e.,there must be a cluster of Hindenburg Omens (defined as two or more) to substantially increase the probability of a coming stock market plunge.
Todays internals:
U.S. Stocks
Markets Diary
4:09 PM EDT 6/11/2015
Issues NYSE Nasdaq NYSE MKT
See 4 p.m. Closing Diaries. Volume updates until 8 p.m. Get Markets Diary by Email
Advancing 1,936 1,429 164
Declining 1,231 1,361 205
Unchanged 88 127 28
Total 3,255 2,917 397
Issues at
New 52 Week High 108 127 2
New 52 Week Low 91 30 13
New post
Spiral update – If 2104 holds 7:00 to 7:20, then up to 11:40.
leaving early today – check http://www.ustream.tv/channel/7442-analytics for updates. 11:00 ish high, then down 2087 possible
Lab 7442 now looking for 2081