
The solar maximum peaked out mid-2014:
 Source: Solen
Speculation should peak out with it, and that appears to have been the case with trend changes in stocks, commodities, dollar and treasury bonds:
 Source: Stockcharts
The speculative target into the solar maximum was primarily equities, as evidenced in allocations, sentiment and (here) valuations:

Source: DShort
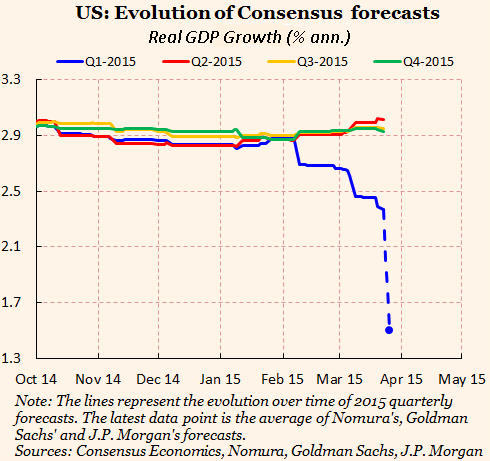
Stocks are now at risk of a sharp reversal, due to the twin supports for lofty valuations of earnings and (here) economic data having turned negative:
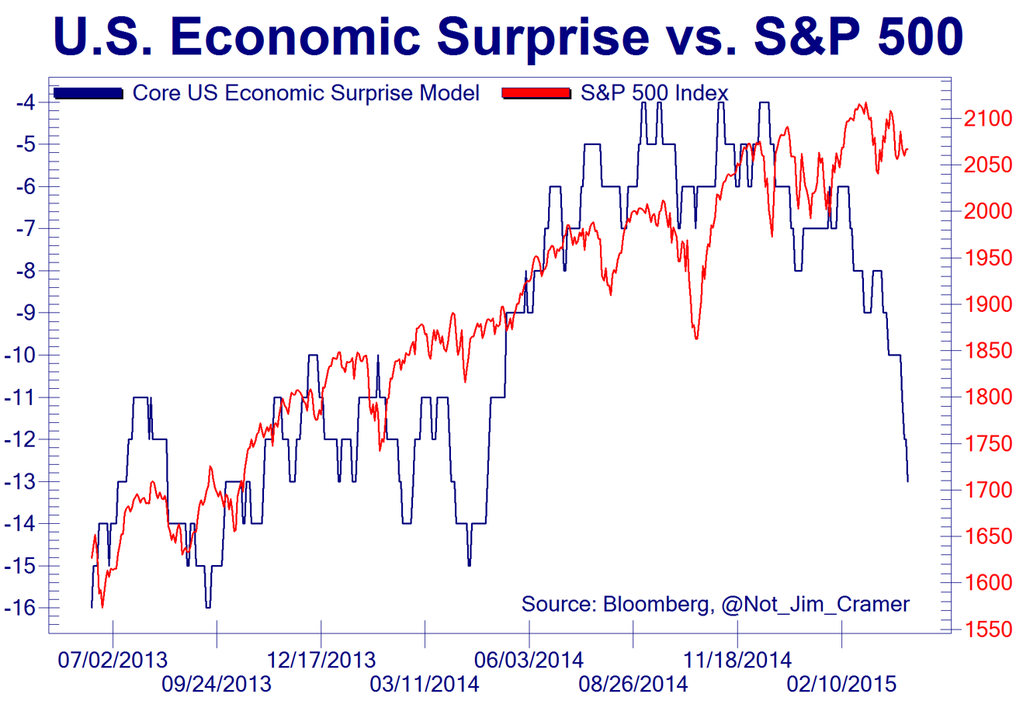
Source: Not_Jim_Cramer
However, analysts are predicting both will improve as 2015 progresses. The first chart shows they have been downgrading Q1 GDP forecasts whilst slightly upgrading the next 3 quarters. The second chart shows they expect a significant recovery in earnings in H2 2015:

Source: FT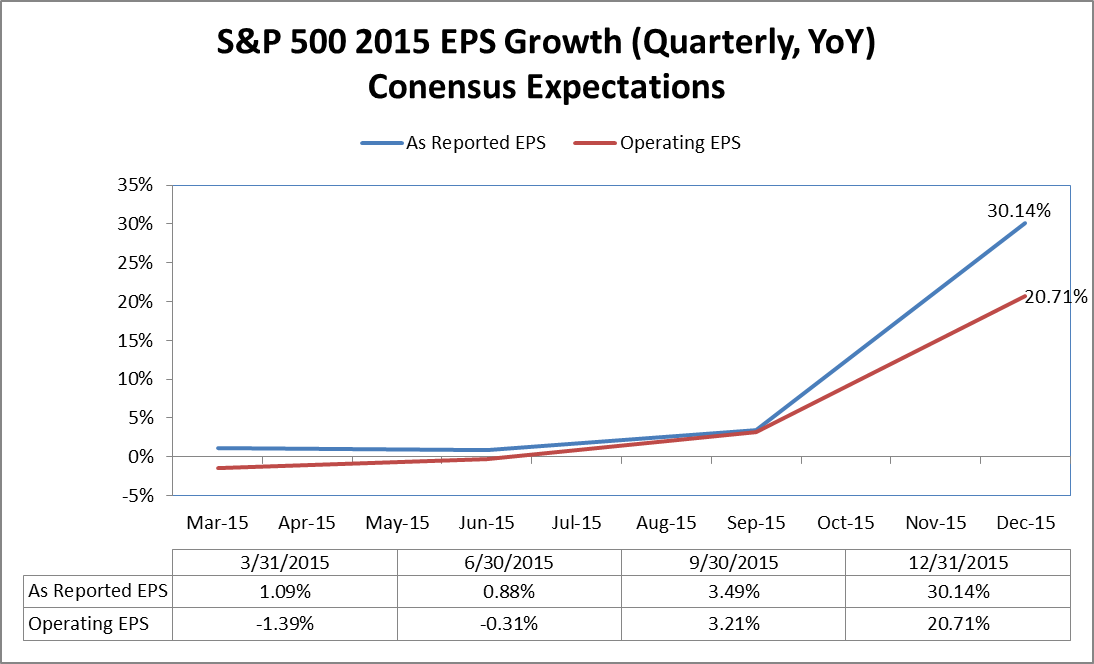 Source: Charlie Bilello
Narrow money trends are also predicting an economic recovery by H2 2015, in part due to the benefits of lower commodity prices.
Source: Moneymovesmarkets
Counter to that, a range of economic data has already dropped into recessionary levels:
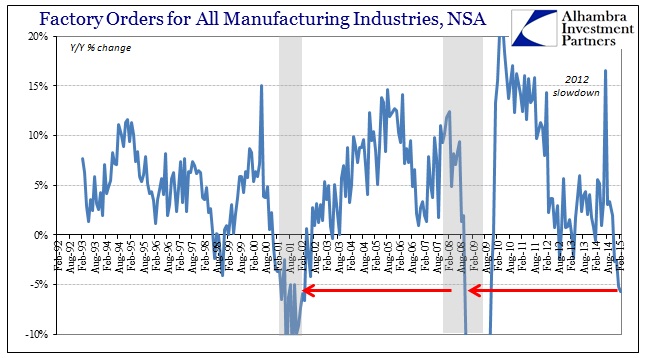

 Source: Alhambra
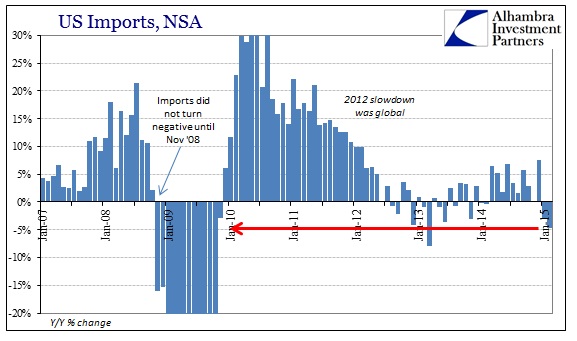
The latter two charts play into the global picture, which is one of dwindling world trade:

Source: ATimes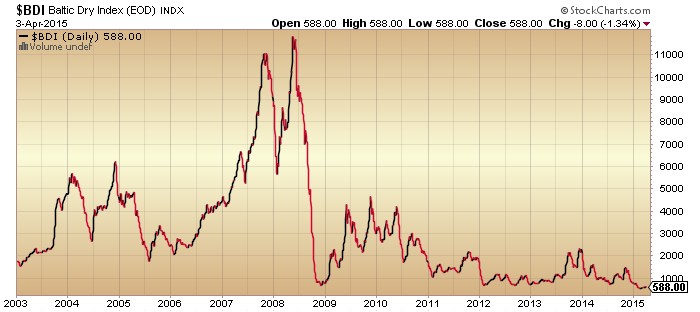 Source: Stockcharts
Financial stress in the US is not yet apparent but has crept up in a way similar to 2011 pre stock market falls:
 Source: Charlie Bilello
Supportive to the bull case still are cumulative advance-declines, outperformance of certain cyclical sectors and small caps in 2015, and a current rechallenging of 2014 highs in both leverage measures of margin debt and (here) leveraged loans:
 Source: Stockcharts
However, most other indicators show continuing degradation and divergence.
 Source: Stockcharts
So, piecing it together, I believe the key is whether earnings and the economy do recover again or whether we are in the early part of a negative spiral. Solar theory would argue the latter, whilst analyst opinion favours the former. Either the sharp falls in commodity prices are deflationary and recessionary, or they are to become a new form of easing as 2015 progresses, with positive benefits for the economy and most sector earnings.
I suggest it is unlikely stocks will advance whilst the reporting of Q1 earnings and economic data plays out. Rather, at such lofty valuations, we will need to see evidence of the anticipated improvement first. That sets the scene for either a meaningful correction here, or a sideways range trade in the weeks ahead.
My opinion remains the same: we are in the last gasps of a topping process in equities. We see ample evidence in both indicators and economic data of the shift in behaviour post-solar-max. The negative feedback looping is underway but needs a significant drop in equities to complete it. That should now come to pass, post Equinox and post-second-chance (last post). April is clearly a window for a meaningful drop, set against earnings reports beginning on Wed and anticipated further bad economic data.
If somehow stocks can hold up and range trade over the next several weeks whilst early evidence of a pick up in the US does start to trickle through then maybe this mania can continue for even longer. But I still find it extremely difficult to make a case for that.
The SP500 now needs to break down beneath the March lows. The divergences suggest this should occur.
 Source: Stockcharts
Meanwhile, the commercial positioning on gold suggests a rally, which would fit with a drop in equities:
 Source: Ispyetf

John, thanks for your consistent view and great analysis.
You know I subscribe to this view. The apo/peri cycle simply peaked dec 2014 and bottoms early 2018.
My harmonic timing set the date on feb 27th as the end of the inverted period. S&P made the high march 2nd, 1 trading day later.
So the question that needs to be answered is why we haven’t seen a meaningful decline so far.
I think I can answer that.
1) Jupiter and Saturn together form the Great Chronocrator (Richard Nolle); the mother of all timers. As of early March, both planets were stationary retrograde. In other words : they were at a standstill. When time stops, everything stops. This week Jupiter turns direct again.
2) The Uranus-Pluto square has been with us for some time, but hasn’t lived up to it’s promise yet. The full moon on April 4th formed a T-square with Pluto. In other words, the bloodmoon activated the Uranus-Pluto square. This is surely the most significant activation in the square yet.
3) april 3rd we saw the first major Bradley date this year.
So after the December-March inversion period, some random events kept the market from falling so far. This will lead some people to believe the trend is up and has consolidated in time. They are wrong.
Last week I told you about the hidden divergence between VIX and S&P. This is very bullish, so volatility is set to spike up next week. All this built-up energy will be released next week.
Usually there is no trade on good Friday. This good Friday was different; some big boys managed to open the exchange for a brief moment when the rest of the world didn’t expect it. Apparently, they needed to unload and they couldn’t wait until Monday.
I expect a w3 low around April 20, a pull back into April25th and the W5 low May 4th. This first wave down will run into the end of September/early October.
Cheers,
André
Thanks Andre
Andre,
Thank you. Maybe I am reading this wrong but are you expecting a bullish up week this week?
Bluestar,
I expect a strong decline to start Tuesday or Wednesday and run into April 20th.
maybe this was a typo, but Jupiter was not “stationary retro” in early March. It was just retro. “Stationary retro” is the term astrologers use to define the point in time when a planet is changing from direct to retro motion. “Stationary direct” is the opposite, it defines the point in time when a planet changes from retro to direct motion. Note that the slow moving planets (Jupiter and Saturn) are essentially stationary for about a week prior to the station date until about a week after that date.
Jupiter’s retro cycle lasts 4 1/2 months. The last time it was stationary retro was December 8. 2014.
Jupiter goes direct on April 8, so it was stationary from about April 1 until April 15.
Saturn went retrograde on March 14, 2015, so it was effectively stationary from about March 7 to March 21.
Thanks; appreciate your response.
Thanks John and Andre, this is how I see it also. And thanks John for the shocking charts of imports and exports and factory orders. The markets will have to catch up with this nastiness.
Thorough and insightful analysis as always John. I also always love and appreciate Andre’s unique angle of view. Thank you both! Quick question for JH: Are you fully short or plan to be fully short next week?
Thanks erick.
Out of curiosity, are you shorting the SPX? Do you have a stop and where? What triggered your short order?
I am short (SPX) but price has to roll-over for me to add more short.
Right now I’m a little short US stocks and a little long gold. I want to see more technical price breaking and more momentum to add more.
Thanks Andre., John , very good as always …n
Interesting charts and analysis John, many thanks.
Bob Hoye has noted several times in the past 6 months that he expects the economy to turn down in earnest when the credit/stock markets themselves turn down in earnest, so he sees the markets as the horse and the economy as the cart.
With all of the leverage employed in markets, I tend to agree with Hoye, when markets turn, confidence will evaporate, and credit will tighten, that’ll be game over.
Enjoyed your latest “Big Picture,” and although receiving your newsletter for 2 years, this is my first comment.
1. Although I initially subscribed due to an interest in full moon, etc., because over 10+ years, I’ve analyzed my trading around those periods, but continued because of your excellent reporting/analysis of a huge breath of fundamental and technical data.
2. I’m a perma-bear; actively trade SP e-mini futures, about 99% from the short side, although am quite profitable both this year and last. My bearish viewpoint is mostly due to monetary analysis, which of course has been distorted/delayed with all the Central Bankers drinking from the same QE Cool-Aid.
3. Monetary policy/actions, seems to be the only significant aspect missing from your analysis, although it is reflected in a batch of your indicators.
4. Minor point, but in the April 5 report, where you again think a negative breakdown is likely in stocks, and per recent letters, I assume you are still short, I think it would have been useful to point out that not only was the Friday unemployment report disappointing to The Street, but that in the 45 minutes after the release, SP futures dropped about 20 handles / 2000 points. That may change when mkts open Sunday evening, but so far, DOW would be down 150 or so points, and the SP would be just slightly above the March lows.
Regards,
Appreciate your input, thanks
Hi John
How do you explain the 2007 top in equities vs sunspot numbers?
Thanks
Daniel
Just because the wind is out of the north at 20 MPH, and the ocean currents are out of the north at 10MPH doesn’t mean the ship will move south at 30 MPH. The ship has an engine that allows it to move in any direction, just that if it goes north its max speed will be 30 MPH less and if it goes south its max speed will be 30 MPH more. A lack of sunspots may just mean that the market has to expend more energy to rally which may be why the 2007 rally was followed by the 2008 non rally.
There had been an “inversion” in the 19 year 5 hour wave count (not cycle counting as cycles seldom ever invert whereas wave counts invert all the time). The top of the Tulip Bubble and Mississippi Scheme (1720s) was the end of a 19 year 5 hour wave count just as it was in 1929 and 1987. The end of that 19 year 5 hour wave count was in 2006 –but– an Inversion occurred and the start of the wave count became a high in 2007 instead of a low.
The truer “total” interaction of the Sun, Earth, and Moon would be the 19 year 5 hour two dimensional interaction cycle multiplied by the 18.6 year Lunar Declination cycle multiplied further by the mini-Ice Age cycle of at least 178 years if not 200+ years. This is a major “reason” why probably more Traders have lost their (family) fortunes trading the wave counts of the 19 year 5 hour supposed “total” interaction of the Sun, Earth, and Moon than have made money using it.
There is a tendency for bubbles when Saturn is in Sagitarrius. The SS Bubble peak was S in S, as was the 1986 to 87 rally, the 1957 to 58 rally, the 1928 to 29 rally. So, even tho’ I am a bidirectional short term trader, I will not be suprised if the next two years are in rally mode, even tho’ prices are high and solar waning has commenced.
The tulip mania also really got ramping up with S in S in 1634.
This is all verifiable in 2 minutes by going to “theplanetstoday.com* and scrolling back to dates mentioned. Why S in S is somewhat mania causing imo is unclear but does seem to be the fact.
Solar maxima make for speculation frenzies but not all speculation frenzies are caused by the sun
As always a balanced and well-reasoned presentation of the state of markets. Thanks, John.
The On Balance Volume* indicator has peaked in late December and trending down since Feb. it is currently dangerously close to breaking down below its lateral support. If it does, I will attack it with an increasing short position. Otherwise, continue to observe.
The winner in my portfolio based on this indicator is RSX which just broke out on the news of the Iran accord. Check it out.
Thanks John. Been a while since I last posted. In my opinion, Phil is the one to watch – his top call of Q2/Q3 is still on the table and most probably has the highest chance of success.
On certainty – it does not exist in precise stock market
timing.
It’s akin to children believing in Father Christmas.
You can with ‘certainty” make longer term calls –
another bear market will follow this bull market.
Reading JH’s views it’s about probability,
John uses multiple data sources that indicate
a particular outcome.
There were numerous posters last year who appeared
certain the bull market would end in 2014,
some no longer post on solarcycles.
When I read some posts which appear to proclaim
certainty on a given short term outcome,
it amazes me.
I either think this is disingenuous, or more likely foolish.
We can all share strong convictions on a given outcome,
but claiming more than this is ridiculous and enters Nicholas
territory.
John Hampson- many thanks for continuing to share your views
freely and facilitating a really great forum.
The lunar chord which uses moon phase, distance, and declination, tidal action and seasonal patterns is an attempt to achieve a probable short term direction for the market. In my opinion, this is more useful because there are more profit opportunities than making a unidirectional monthly or annual trade.
El Nino predictions increasing:
http://economictimes.indiatimes.com/news/politics-and-nation/now-imd-predicts-50-chance-of-el-nino-this-year/articleshow/46802885.cms
This has nothing to do with the Sun but it has much to do with the Moon as in Lunar Declinations. Do your research. For those of you into the 19 year 5 hour supposed “total” interaction of the Earth, Sun, and Moon finding out about the 18.6 year lunar declinations to the Earth will open your eyes to the fact that the much hyped 19 year 5 hour “total” interaction is based on a two dimensional plane of those three bodies and is not the real “total” interaction of those three bodies.
A “Canyon of Fire” has erupted on April 4 on the Sun and ejected a massive CME that will deliver a glancing blow to Earth’s Magnetic Field on April 7th. Combined with the very recent Full Moon and Lunar Eclipse could this glancing blow to Earth’s Magnetic Field help to unsettle the minds of the human herd such that an unsually deep sell off occurs this week for US stocks and the Dollar?
Or if I have porridge for breakfast, perhaps the China A50 will sell off some?
J
I hadn’t thought of that “the porridge indicator”. You may want to create a data feed linked to your pantry so we can all benefit. I could try to correlate my dinner choices with the Nikkei as it opens about the same time.
Thanks all
Of course the other explanation is that markets have nothing to do with sunspots.
So why do you come here? Plenty of other sites for you to frequent that would take the same line.
And as if by magic Mr Benn disappears
Go away –
I witness a spectacular red/blood moon rising yesterday 9pm GMT.
JohnH, thanks again for an amazing post and forum. This time the chart that ‘stands out’ for me is the ‘Evolution of Consensus Forecasts’ one.
It highlights the complete ‘nonsense’ that Wall St. analysts are trying to hype up.
It’s fantastic to read a forum with views that are
not readily available on many mainstream sites.
You can go on to just about any stock discussion site
and find 1000 posters who subscribe to FED/CB
omnipotence.
To the vast majority of stock analysts the cycle peak
is perpetually about two years away, it’s never today.
How many recessions have the FED anticipated.
Just fyi, the DOW long stop is moved to profit. Will see what happens later.
J
Took profits on DOW shorts. An Ascending Diagonal Triangle has an upward trend with ABCs in both the down legs and the up legs. It is more of a sideways trade with an upward trend. I am not expecting the ATH until this Fall nor am I expecting a parabolic tend higher in US stocks. Good luck trading Guys….
Note that June DOW futures are collecting a lot of daily Candle Stick “tails” under the 100 day sma. This is not bearish but bullish for new ATHs.
Hi all ! How are you ? Great employment report last week with less job creation than expected. This should encourage the FED to print more and drive the markets higher. I recommend to increase exposure to IBB and QQQ today.
Good post by John this week-end but I still don’t see any analysis on central banks actions.
You call that a “great” employment report? Are you nuts?
Ah the hindsight guy is back. Having said that, my DOW long worked out great:)
J
Good for you as the king dollar fell off his chair just at the right time-:)) This is a catalyst for the near future.
My oil stocks rocking.
Rotation to the weak sector such as oil can keep the market afloat. Internals are enjoying significant improvement.
Anyone who went long that futures dip deserves
their profits as it was a gutsy position to take.
The futures move looked exaggerated, enjoy your
gains.
Phil W: You have been quite accurate with your calls and always balance view. I recall a few perma-bears jumped on you when you made that gutsy call. Good job!
I think the current rally is short-lived though. Markets will quickly reverse tomorrow and sell-off will potentially soon resume. Great time to book profits imho.
50% closed on DOW, stop moved up (non-guaranteed btw). Just gone short China A50, stop at 12475. If not stopped, this I may be willing to keep for a while.
(In true JS fashion, this will probably be stopped within 10 mins).
J
too much pessimism…today the market structure has been fully reversed by Big Boys. Some money are going on commodities sector.
What a coincident! US dollar falling and Saudi raising oil price at the same time. They are game changers.
Looks like last Friday’s Full Moon has done all that it could to help an ABC lower in the DOW and now it is rally time to the New Moon on the 18 that will probably be a new ATH given the cluster of daily Candle Stick “tails” beneath the 100 day sma. A cluster of daily Candle Stick “tails” implies an Intermediate to Medium swing turn is occurring. In this case, swinging higher to a new ATH.
Until this Fall; Pivot, Swing, and Day Traders may “rule the roast” as the markets trade sideways with many ABCs with an upward trend.
The optimistic news that refineries are going to produce the most gasoline in history, over the next several months, may “trump” the pessimism from a credit downgrade of the energy sector this month.
And we still have 92% odds of a new ATH before taking out 2039
There have been a few cases when the market has spiked around the full moon, then trend continued down
I’m itching to go short here at DJIA 17939…..Newt, tell me why that’s not a good idea please.
I won’t tell you. We wear different lenses-:))
Hahaha!! Yes but it’s very useful to look at the world through different lenses from time to time.
I guess what I’m asking is whether you see the ‘internals’ of the market as being strong or weak despite the 300+ point rally on the DJIA?
P.S. Whatever you say, I won’t hold it against you, promise.
We are still in a trading range on a day when bad news is good news. No need to sweat on either side. Just watch lateral price support/resistance.
Please can someone help me here:
When the market is at a high of a range and the RSI is trending downwards whilst the market makes new highs then that is a ‘negative’ divergence….and vice versa.
However what is the significance if the market is near the top of the range but below it’s previous peak whilst the RSI is above the equivalent peak. Is that a ‘negative’ divergence or will the market catch up with the RSI? This is first time I’m seeing something like this ever in my (shortish) trading life.
Thx in advance.
Traditionally called hidden divergence
happens all the time on lower time frames
slater9 I’m sorry I just saw your response and am very grateful. Please can you tell me whether this set up means that the price will catch up with the RSI or vice versa.
Thx.
Excellent day for longs. I’m pretty sure there’s been strong central bank buying earlier today to prevent a gap down. Good job central bankers. We should be at nwe highs soon.
From a more experienced viewpoint, it appears that the topping patterns are complete in both the biowrecks and the transports.
Where’s the edit button? U.S. Dollar too
I boldly went short at the close today. Resistance is 2-3% higher, so this three day trade should only cost me that amount.
I have to hold this trade till Thursday AM so hoping some weakness appears by then. If not, I will blame it on today’s Uranus conjuction and the red moon eclipse not being sufficiently bearish.
I also went short today with a tight stop loss. It is so late in the current cycle that I don’t see a new ATHs in the next few weeks. Need to see a reversal first, preferably tomorrow, before adding more short positions.
It is kind of risky chance of 2 – 3% loss if market keeps higher, but sometimes this time of year (esp. with moon phase near full and falling tides) market falls by several times that. My ideal would be red candle tomorrow same size as today and continue lower. Won’t stay short past Friday tho’ as that is when tides reverse and new moon/perigee are on the horizon.
I went long in Aftermarket.
Key factors:
–fear subsided as shown by $CPC:$RHSPX;
–a buy signal flashed by $NYSI;
–SPX higher lows;
–$NYAD (cumulative) ended ATH and fractals suggest high prices may be in work.
–strongest $NYHLR since Feb. 17.
Longs need a price close above resistance at SPX 2,088.
stopped out for a small gain.This is getting silly.
Ditto Valley. I too view this week as an ideal time period for a solid reversal geocosmically. I am willing to hold my short through the rallies, as I see very limited upside for the SM from here, 2%-3% at most.
As you already know, there are better opportunities to make some dimes in the commodity sector now. Both miners and oil might still have at least 2-3 weeks to keep rising, unless the cycle is somehow aborted early.
I am excited about gold as I am seeing a tremendous opportunity of a lifetime. 🙂
Could be true. Sometime within a relatively few months or years the miners will probably 2 to 3 times the current price (albeit maybe only for a brief window). So buying now with a plan to sell at a predetermined level seems like a good bet. They are real companies with real profits and an important international business so eventually they will probably have their days in the sun.
Their last big bull cycle was +2400% over 17 years, 1965-82.
So, yeah, I agree with you, some days in the sun lie ahead in the stagflationary 20s.
Crash now or around the corner?
In my tool kit, Cumulative $NYAD and $NYUD most often showed a negative divergence to price before a correction took place. Currently, there is no negative divergence. In fact, we have a positive divergence since $NYAD (cumulative) reached ATH yesterday.
Why does it matter?
In the Carl Swenlin article linked below. The 1987 crash was foretold by badly listed internals. The indicators cited in the article are most equivalent to Cumulative $NYAD and $NYUD..
http://stockcharts.com/articles/chartwatchers/2012/10/lessons-from-the-1987-crash.html
so my answer to Crash now or around the corner?
A crash is probably not going to happen anytime soon but hopefully I can sniff it out with my tools when it does come….
Newt, thanks for answering my question from last night 🙂
I was looking at the NYAD and NYUD yesterday and that’s what prompted my question in the first place.
NYAD seemed very strong but NYUD seemed quite muted and I thought that price was being driven by low volume rather than conviction.
I’m still MILES (and miles) away from reading any of this well but one has to start somewhere eh?
A comment regarding e-waves. You know. Bob P. gave his dire P3 count and many of my friends are still waiting for it. My point is. People have been burned by outcome bias tool like e-waves. ..but I am not the expert.
Yes you are right. And yet the same tool ALSO told them when they were wrong (a long time ago) and should take action to at least mitigate losses if not actually trade the other way.
That’s why I believe EW is used incorrectly….sadly most by Bob P. whose done so much to promote it.
Any way just to let you know I can see a 5 wave count completed on the ‘up’ side on the 5 minute chart on the DJIA at 17984. I’ve taken a short position with a stop at 17990 (being generous here…lol).
The bottom line is we shouldn’t blame the tool if the user can’t use it properly.
Hi all ! Ok, looks like to correction is over for IBB. I’ve just increased my position again. DAX is also doing very well, nicely supported by ECB buying. The central bank of Japan is also doing a good with the nikkei. So, all in all, everything is going as planned. I’m tempted to sing ‘everything is awesome’ from Lego Movie.
People my earlier call for a short will be validated if we break below 17940 on the DJIA BEFORE we break above 17990.
IF this one holds then the downside target for me is below the Friday ‘out of hours low’ for starters although I would like to think that it goes WAAAAYYY below that..
This may sound a bit preposterous ….and it may well turn out to be so.
Provided the DJIA doesn’t go back above 17990 I reckon we are heading to at least the early Feb lows and probably lower than that too.
Please do your own homework here. thx.
Wonderful! World-wide, the central banks are buying the broad markets propping them up and that is your reason to celebrate. Have you ever given thought as to why governments would resort to propping up their stock markets? Obviously not – you and mad crowd of people that panic into and out of markets. People with no understanding of markets are left holding the bag at tops and bottoms – they are fools. Study some market history or you too will be left holding the bag at the top after being played a fool by experienced traders.
if you have long positions, you need a plan that you’ll follow when/if the market tops. Nicolas, what’s your plan? SPX could go to 3000, or it could top tomorrow. How do you decide when to cash in your chips?
The problem with the crowd at tops is that they think they are safe in numbers… that there is an all powerful government that has their back.. that if the “experts” on CN’BS’, Bloomberg, etc. say it is so, then it must be so… I saw it several times before, smug, inexperienced, greedy lemmings appearing at tops with no exit plan thinking they the chicken can outsmart the fox…
Ugh the above comment was meant to be on ‘its own’ and not as a response to our friend Nicolas. However the message remains the same Lol.
impeccable timing
like clockwork
peak biowreck
You won’t get any details from Nicolastroll on anything like that. This is his repertoire:
1. Stay away when markets go down.
2. Come back when the drop is over and apologise for your absence like anyone gives a sh1t.
3. Pump QQQ, IBB, AAPL.
4. When asked for any details brag about the size of your position and profits.
Tell me, which of the above are NOT trolling?
LOL
J
Moon is Scorpion today, and tomorrow. Building a lego bridge to much lower prices next 5 trading days. “Negative Beta is Awesome”.
You can located ephemeris on numerous websites, and moon in Scorpio for some reason has SM non rally most months.
Anyone wish to pay Spain to park your money for six months?…….INCOMPREHENSIBLE!
I know I sound like a broken clock but these markets are broken and astoundingly non-functional and it will end in disaster for all but the few holding tangible assets like gold.
And I am NOT and have never been a gold bug btw……however sometimes you have to recognise things as just what they are amd in the coming realisation, tangibility will count for everything.
I had hoped that the Chinese were a little more astute but unfortunately they are just as dumb as the rest of us
http://stockcharts.com/h-sc/ui?s=$SSEC&p=W&yr=5&mn=0&dy=0&id=p08372245106
Allan
I think that exchange is open to global money flows.
J
J, it is a product of domestic decision making. PBOC policy is largely to blame.
I am amazed of the geocosmic factors that valley and andre are presenting. It looks like your call is starting to play out, which would be in line with a strong correction case that JH has been calling…
I am a beginner of financial astrology. My observation based on my limited knowledge of geo is that we are entering a very critical reversal zone today and tomorrow. The Sun trined Jupiter on 04/02, then Jupiter will turn stationary direct tomorrow. Between 04/06 and 04/09, Sun and Mercury conjunct Uranus and square Pluto, which imv is a major reversal signal. imho It looks like the reversal signal has been observed before the close today.
As of now, it is amazing that the geocosmic factors and Ewave are resulting in the same result: an imminent downturn. A believer of EW, I however have never used it as a trading tool. I rely more on cycle count, which currently points to the primary cycle peak due anytime. or could have happened already on 03/02. If that is the case, the imminent correction could be nasty, choppy then heavy sell-off into May.
I am remaining 100% short SM, long oil and miners.
Sorry for the obvious, but what is SM?
SM: stock market 🙂
Silly me. I keep forgetting.
A few successful calls like this per year could really boost your annual returns. I am short SM, 100% long miners (small amount trying to market time). I won’t be short past 4/15 cause invariably there is a post tax day rally in US.
So the start of another US earnings Q.
Alcoa has sold off sharply since the last update,
so it will be interesting to see how the market views
the outlook.
More than usual the focus is now firmly
on the outlook and any guidance changes,
rather than the Q earnings.
http://www.bloomberg.com/news/articles/2015-04-07/the-great-american-invasion-into-europe-s-debt-market-has-begun
Ref, the commercials gold chart. It is in a position where rallies occur, However, when gold hit $1300 late last year, early this year, the miners sold almost as heavily as in 2012 when gold was at $1800. In fact, the pattern of commercial buying and selling is somewhat similar to the 2012 distribution – the miners have been selling heavily overall for months. Plus the pattern is lower lows and lower highs. Do the large specs have the firepower to over come commercial selling and take prices higher?
I’m taking another short here at DJIA 17970 with a stop at 17990.
Yesterday’s drop was a complete 5 including overnight session. So W2 can’t go beyond start of W1.
Let’s see how this turns out.
Uh oh! Just checked on NYAD and NYUD. The former looks very strong although the latter looks somewhat muted. I really should get in the habit of looking at those 2 at least before making a trade.
Just went long. SPX 2075. I love the whipsaw.
still playing $NYAD (cum) continuous ATH will lead price higher.
$NYHLR at 18 is very very healthy.
Hi Allan ! I think the chinese are very smart. They saw all the QE in the US and Europe and how it created a huge bull market in stocks. They want the same thing and it’s nice to see the central bank of China driving their stock market higher.
Do we buy Hong Kong or China?
Hi John ! I would recommend China over Hong-Kong.
Regards.
One of the strategies to hedge against a US top may be to diversify to oversea markets as the US FED is becoming hostile (at least in rhetoric).
China may go down but it will bankrupt a lot of shorts with it.
So Nicolas may have a point. No teasing, his lenses are pretty good in seeing through the easing game.
I agree that earnings season will be pretty crappy but it doesn’t really matter. The important thing is that companies continue to borrow at 0% to buy back their stock + central bank buying. So once again I’m not worried at all.
By the way, don’t forget to short gold and gold stocks.
Target Purvez?
jegersmart, I’ve lowered my stop loss to come out with a small profit. However if this is the wave that I think it is then I would like to see at least the low of April 3rd. but potentially much lower based on my larger counts. I’ll definitely take profits at around the April 3rd low and then re-assess wave counts.
Looking at the whip saw since the FOMC announcement I can’t tell what this wave is. However suffice to say that it doesn’t look anything like the down wave that I was expecting so I’m going to take profits at 17885ish and call it a day.
Gone long dax at 12050 for the next power rally to 12500. Small position at the moment but will add on any bigger drops to build up a full position. Easiest trade of the lot in my opinion. Bailed on my dow short with a loss as I don’t think that will work out just yet.
Hi Krish ! Good decision, although you should have listened to me earlier. I agree that DAX 12500 is a walk in the park.
Fully short, market going to drop like a gold plated lego until next Wednesday.
Short again.
The DOW is losing its upside momentum. Its momentum could rapidly go south.
taking nicolas’ advice here… Thank you!!! Short stocks and long miners.
“Everything is awesome”. Legoland Movie
(If you have negative beta).
Someone didn’t like what the Fed had to say.
The FED minutes look great, nasdaq up almost 1% and gold is down. Indeed, ‘everything is awesome’ for my portfolio.
Of course the Fed minutes is old news and does not reflect the disastrous jobs report. However, fools will continued to be fools!
Exactly. The data is at least 3 week old, before the horrible job report, and before the expected horrible earning season.
Nicolas, when the analysis of this FED minutes is complete it could be interpreted as a short term indicator of indecision which may result in a few days of market pause in its upward path. I would only be short this market until next Wednesday while the market digests the implications of the latest news.
Hi Valley ! Yes you can, but why take the risk of being short for a few days when you can make so much money by buying IBB, AAPL, QQQ and holding ?
That’s boring! Why not use your lego’s to build new structure every day. Today build a bridge to lower prices. Next Wednesday a sky scraper to much higher prices. Buying and holding is like building a lego structure and then letting it collect dust.
which side is going to get worn out?
Nicolas will soon realize that swing trading is superior to buy and hold in the sense that you profit more on the upside and the downside. Perma bulls and perma bears are right but just like a broken clock is not a sound strategy.
+1 Agreed.
This market (in the short term) has become very schizophrenic but the slightly longer term charts still say down…..to me. So I’m re-initiating one of Newt’s ‘scouts’ in that direction at 17886ish. Stop is 17930. Have no idea where it will go but if it does head down below 17820 then I’ll add more.
Watch the toupee!
I stand by my back-tested tool that says current’s $NYAD cumulative ATH will resolve in new higher price for the markets.
Newt., without a doubt there will be new higher prices for the markets. Just not until next Wednesday. I have backtested my indicator system to 1998 and by Martin Armstrong’s beard, I can promise you a one or two percent decline before next Wednesday.
I can dig it!:-))
valley. i am with you 100%. My confidence is enhanced when the geocosmic factors, EW, technical indicators, and cycle are all aligned. imv the question is not IF, but WHEN and by HOW MUCH the market will retrace. Worst in the worst case scenario to me is a retracement of 38% Fibo by early May. Best case scenario is a 10% drop like last Oct. 🙂
100% short.
Erick, I am only bearish very short term. I am bullish next week. I am trying to trade only on lunar seasonals and price action cause even in a bear market almost half of the trading days are up (it’s just that the days that are down are doozies).
You have a great strategy valley. I agree that the correction doesn’t look like a straight drop from this level. It might be choppy, fleecing both long and short before falling hard. I too view my trade as a short term short. Will adjust or swing trades where I see fit. Good luck to you!
Purvez – On the daily charts the markets are basically trendless right now, so you have that correct.
Earnings season is as rigged as the markets and I pay almost little attention to it in my apporoach to markets.
From my memory in the last 20 years, overall earnings have have not met expectations on only 2 occoasions and neither of those was during the GFC. Companies know well ahead of time whether they are going to meet expectations and begin prepping analysts and accounting accordingly.
It is just another way that WS hoodwinks retail investors.
On AA earinings, case in point…..adjusted earning crap, who gives a?… Bottom line sales disappointed and are actually disastrous and it sells at EPS of over 60 !!!
The mirage continues.
“One of the strategies to hedge against a US top may be to diversify to oversea markets as the US FED is becoming hostile (at least in rhetoric).”
I hear this said all the time and yet history is filled with the exact opposite evidence.
The fact is that when the US markets go down, everywhere else goes down.
Usually it is more like a relay race where US leads 3 years, then Europe 3, then EEM for 2 or 3. Look at comparison of annual returns by market and you will see this is more or less (except for 2008) they way capital moves from market to market. Based upon this expect EWG or EEM to lead in the next leg of the race.
No offence intened but advising people to BUY this??
http://stockcharts.com/h-sc/ui?s=$SSEC&p=W&yr=5&mn=0&dy=0&id=p65068182090
That is not investing, that is tantamount to throwing your chips onto black or red!
imv SPX is just simply crawling along its 50 DMA. When SPX breaks down, we’ll quickly see the 200 DMA. I am confident that the correction is around the corner that I continue holding my short positions, even if SPX manages to crawl to 2100 first before crumpling.
GLTA!
Curious to learn about your view of the VIX vehicles… It is dropping like a rock on large volume the past couple days. I know VIX is not an indicator. If the current VIX simply reflects the over and extreme bullish sentiment now, the markets might soon be in serious trouble.
I bought VIX at the close for the first time. Small position anticipating fireworks to the down side tomorrow AM.
Went long EUR/USD @ 1.07837
Setup chart
Added @ 1.07622
Added @ 1.07470
Nicolas here is something to to think about whilst you continue to bash gold.
Anyone that had the intestinal fortitude to buy good quality junior and mid-tier Australian gold stocks in late 2014 are now up at least 300% on that investment.
Some are up as much as 500%.
Buy when nobdy wants anything to do with a sector and sell when it is the only sector people want anything to do with.
The really exciting thing is that gold and gold stocks are still not even close to being on investor radars.
I was jumping up and dow late last year saying that gold producers, particularly those outside of the US, such as Australia, were entering possinpbly a perfect scenario of declining domestic currency and collapsing oil price. One company I bought increased their cash on hand from $68m to $108m in one qtr whilst establishing a new record production and lowering costs.
Nicolas, time to pull your head out of you know where and look around a bit!!
A few examples
http://bigcharts.marketwatch.com/advchart/frames/frames.asp?show=&insttype=Stock&symb=au%3Asbm&x=47&y=23&time=8&startdate=1%2F4%2F1999&enddate=9%2F13%2F2012&freq=1&compidx=aaaaa%3A0&comptemptext=&comp=none&ma=0&maval=9&uf=0&lf=32&lf2=4&lf3=131072&type=2&style=320&size=2&timeFrameToggle=false&compareToToggle=false&indicatorsToggle=false&chartStyleToggle=false&state=10
http://bigcharts.marketwatch.com/advchart/frames/frames.asp?show=&insttype=&symb=au%3Arms&x=0&y=0&time=8&startdate=1%2F4%2F1999&enddate=9%2F13%2F2012&freq=1&compidx=aaaaa%3A0&comptemptext=&comp=none&ma=0&maval=9&uf=0&lf=32&lf2=4&lf3=131072&type=2&style=320&size=2&timeFrameToggle=false&compareToToggle=false&indicatorsToggle=false&chartStyleToggle=false&state=10
http://bigcharts.marketwatch.com/advchart/frames/frames.asp?show=&insttype=&symb=au%3Anst&x=39&y=15&time=8&startdate=1%2F4%2F1999&enddate=9%2F13%2F2012&freq=1&compidx=aaaaa%3A0&comptemptext=&comp=none&ma=0&maval=9&uf=0&lf=32&lf2=4&lf3=131072&type=2&style=320&size=2&timeFrameToggle=false&compareToToggle=false&indicatorsToggle=false&chartStyleToggle=false&state=10
They are some of the most bullsih charts you will ever see.
Well done Martin Armstrong for scaring the c#%p out of investors and contributing to the hysteria surrounding gold and gold stocks at a time when they should be buying…..SHAME ON YOU!
He certainly made it easy for me though!
Yeah, it is easier when no one else cares about the sector you are sure to go many times higher. I wish I had the expertise in this sector, have to settle for the GDXJ which will do o.k..
Previously posted thoughts on oil of a triangle – seems to be playing out still so I’ll stick with it.
Vertical line was the timing model I referenced previously and when I went long.
Thanks JH for posting – Would like the time cycle to play until July/August for better odds of a final thrust down to 34 level.
Tomorrow is Mercury SC. Average returns over last 17 years for 7 trade days after Mercury Superior Conjunction have been slightly negative, and at during the same time the SP500 has risen from 71 to today it is at 204. This is another reason apart from seasonals and lunar that I expect bearishness next 5 trading days.
Can you chart your lunar declinations? My lunar Cycle had april 6 bottom and strength into new moon.
Or do you have a site that lists the parameters? I’ve been cautiously bullish because of your posts, usually I’d be bullish bullish.
Agreed strength into new moon. However, seasonals until 4/15 weak and Richard Nolle declination table shows 4/11 as far South position. Market often doesn’t rise until far South is past.
I don’t have ability in using Stockcharts. But with a few minutes work you can print a chart, go to Nolle’s calendar and post the far N, far S, and equatorial crossing on a few months of data. What you will find (this is fractal so applies to any month you look at, subject to exceptions) is that when moon crosses equator you get high tides and high stock prices and when moon makes it far N to Canada, or far S to Australia you get low tides and low stock prices.
That Hong Kong though……:)
What about a gap play on the Hang Seng? In my experience these always close sooner or later. There are 2 now below, from approximately 25300 to 500 and the most recent from 26250 to around 750…..
I think if 28000 is seen I would be tempted to short, hell I may short if not seen once this pullback is more directed…..
J
should have some more room to rise as with this momentum (best with the indicator divergence – target at 28500 – reason behind is this year low is 22500 +6000(6000 is a Gann target).
Nikkei old high at 20800 level (or 21000) so if looking from a global perspective, a bigger correction say 10% need to wait Nikkei hit 20800 level and revert.
Expected high day should be around of beginning of May.
China is still at 25% or so premium to Hong Kong. The problem with arbitrage is that those doing it do not care about technicals and stops.
yes and agree. That’s AH share is part of the story (to eliminate the difference) and the other is the volume. Look at that volume these two days breakout, these breakout are with volume and with enormous china capital inflow.
What would be the trading vehicle to short Hang Seng? Thanks.
Hang Seng future (in IB you type HSI and pick future and option month)
Hang Seng put option
I suggested you double check clearly before shorting this as this craziness can run for awhile, though the pattern is a daily shooting star but I don’t see any bearishness as of now
Thank you so much for your answer and suggestions, apple.
My last night’s DJIA short got stopped out at 17930 after I was already in ‘la la land’. I was miffed!!……but then after making a nice low it shot back up again a little earlier today so I’m short again from around 17920ish.
I still don’t know where this thing is headed but I have a ‘screwy’ wave count which says this is a ‘Leading Daigonal Triangle’. I admit a very shallow one and therefore highly suspect but nothing else fits the bill….and the one thing about EW is that there is always a way of counting any wave. Ha!!
So I’ll wait to see what happens.
Aaah well that didn’t work out so well.
I can’t help myself, I’ve got another ‘scout’ short since DJIA 17920ish. At time of writing it’s very healthy!! Haha.
John Li’s comment on arbitrage has prompted a question to jegersmart. Do you have any other spread bet trading accounts other than IG?
If you do, do you monitor the quotes between them and arbitrage on the ‘not so rare’ occasions when they go out of synch?
I have an IG spreadbet account and a CFD account with another provider and quite often they go out of synch by as much as 3-4 points before catching up with each other or even better going in the other direction. I have often wanted to play those as they are ‘guaranteed’ money. Unfortunately my IG account is for short term stuff and my CFD account is part of my SIPP pension fund so moving money between those is really difficult. I’m tempted to open an ordinary CFD account with the other provider but my laziness prevents that from happening.
However over the last 6 months one could have made over 5K GBP from just doing this arbitrage with a 10GBP per point trade on each side. Each trade lasts no more than a day at the MOST….and often just a few hours.
I’m talking about GUARANTEED FREE MONEY here. If one could afford a bigger amount per point then this could ratchet up very nicely indeed.
I haven’t looked at it tbh, the last time I traded arbitrage it was between Bitcoin exchanges and pools of liquidity over a year ago….:)
J
Was that successful?
Shooting Star candlesticks are lighting up the biowrecks day after day
i’ve never seen such a collection of inexperienced, uninformed, ignorant and greedy sheeple in my life
I was in the cancer business when often my partners (MDs) had to deliver the bad news to their patients. Biotech is about hope… human’s strive for a cure. Biotech share price reflects the collective hope. Look around you. your family and friends.
Biotech may be bloated but this is the kind of bubble we need. A flame out will have dire consequence.
My 12050 Dax long looking great. Stop moved to breakeven and hopefully it can power up from here and smash through previous highs. Can’t help but think it will drag the dow up with it to around 18100. Lets see where it ends up over the next week! GLA
Excellent Krish, wish you all success.
Out again with small gain. This is really silly but I am happy.
Newt, please may I pick your brains here. The following is a link to the free Stockcharts chart for NYUD. The extreme right hand bar which I’m presuming is today’s data is showing a clear (as opposed to red) candle starting somewhere below -250 and just under Zero.
Should I read that as being Declining volume or something else? I couldn’t FIND any explanation for this on the site, although I’m sure one exists.
An explanation would be very gratefully accepted with Thx.
Oops missed out the link:
http://stockcharts.com/freecharts/gallery.html?$NYUD
For $NYUD. Best to set the “Chart Attributes./Type” to “Cumulative” and “Indicators/Price” to “$SPX”.
I use $NYUD” to identify bullish/bearish divergence and bullish/bearish fractals.
Add “Williams%R (14)” as an indicator……as it rises above -80 from below…that is your BUY signal.
I am stuffing money in your pocket-:)). Free no charge.
Ok did that and that actually shows that NYUD is still climbing but the SPX price is flat. Do I take that to mean that the SPX price will catch up to the upside again?
Sorry but this stuff is really new to me, although it may seem like novice questions.
Thx.
Thx Newt, if I ever get good at this, I’ll remember who put me on this track and send you a bottle of your favourite tipple….as long as it is under 100 bucks LOL.
I encourage you to continue to observe. Everything (all your tools) will tie together eventually.
Now replace $NYUD with $NYAD (also cumulative) As long as Williams%R stays in the green, you don’t sell.
This is my last post on this subject so I don’t clot up the blog.
Thx Newt, I’ve been looking at the NYAD chart from their gallery and the first thing that struck me about it was that I could count 5 waves up!! EW habits are hard to break.
Using my EW trading tactics I would go short right here with a stop above the ATH on that chart.
Anyway thanks very much for your tuition and I agree we shouldn’t clog up the forum.
Thx again.
It is not very ofyen that I can agree with Larry Summers but in his latest rant about liquidity in the bond markets I agree 100%.
i have said it all along, liquidity is the key, destroy liquidity and you destroy the markets ie bond amd stock.
Central Bankers are and have inadvertently distorted bond markets and thus in the process liquidity.
Forget SM’s, bond and currency markets dwarf the SM and this will lead to a crisis of unimaginable proportions throughout all three.
Cheers
Stopped out on EUR/USD long, terrible trade.
geno, I saw your trade set up chart and you had identified a triangle with an eventual thrust down. So I couldn’t understand your logic for the long position? The gain was always going to be quite small if the triangle was effective.
Not being critical but just trying to understand your logic for the trade.
Lovely pop on the DAX, I suspect the US exchanges will follow soon?
J
There is some serious divergence brewing between US and Euro, particularly Germany.
The DAX looks like it’s just completing the right shoulder of an Inverted H&S, so there is potential for further upside. Although on what basis is beyond understanding.
Their Factory Orders for Jan and Feb and March have been ….uhmmm lacking, and this is Germany we are talking about here! All hail Draghi.
Purvez
Re bitcoin arbitrage – only moderately. The main reason that I saw for the betas was the slow speed with which money could be moved. It worked fine for a while, but as things sped up I didn’t have an advantage any more.:)
It was good to learn something new, and also to actually move markets withone’s own trades – volume and numbers were quite low then:D
J
Yes bitcoin is a whole brave new world. However if you look at the chart it’s starting to look quite bullish. Don’t know if/when you would get above 1100 again though.
Strong accumulation day in the energy sector. If you set your Indicator to Daily CCI(272), you shall see a pounding buy signal.
newt. I think the same thing is true with miner. Accumulation day… Good call on RSX a few days ago. ESX and RUSL are flying high. Russia is a gold mine imv.
Sorry for the typos.. I meant RSX and RUSL.
The only problem is ON BALANCE VOLUME** which measures the difference between up and down volume. This is indicative of buyer/seller commitment. Until it turns up from its double bottom??, Lower low has a higher probability.
** XLE OBV is showing higher highs since Oct. 2014.
I will continue to observe. Thanks.
Thanks again newt for all the great tips.
Hey newt. – finally somebody else that uses OBV. The only indicator that has ever worked for me consistently daily, weekly, monthly up down and sideways.
Yes. Sir! This is a powerful tool and should be used in conjunction with all other tools.
The bulls have already won the battle and it was already predetermined by the chart action going back three months ago. If the primary trend was to even possibly reverse into something bearish then things would have broken down by the negativity during the end of Jan and definitely during mid-March at the latest.
But what is quite clearly happening is that the market made a temporary top at the end of Nov, then spent the next two months consolidating in a relatively “tight” range within 5% before breaking out to a higher level during a one month run from the bottom of the consolidation (end of Jan)
It is now merely repeating that process again where it temporarily topped out late-Feb/early-Mar and is once again consolidating within an even “tighter” range than previously (under 4%). There might be one more minor dip later this month, but the probability leans towards the lower support level holding and likely bottoming before the end of April. That implies a continuation of the uptrend pattern towards a breakout into another 3-4 week run into mid to late May to post a higher high again.
I can’t believe some people are still expecting a big crash, it’s like waiting for Godot. I’ve just read the Swiss Central bank quarterly report, and it says clearly they have been buying small cap stocks. The japanese central bank is buying stock ETFs outright. These are facts.
This is definitely a new era. This time it’s really different and John Hampson’s analysis is missing it.
Do you really believe this time is different? Or do you believe that we should ride the wave while it lasts, but have an stop order to get out at the peak? I would respect you more if you argued the latter.
Hi John ! Yes, I do believe this is a new era. It’s the first time in history that we have central banks buying stocks directly and driving rates below 0. The correct strategy is to buy stocks and hold until this era ends.
When central banks stop buying stocks, raise interest rates, contract their balance sheets etc…. then it will be time to sell stocks.
Regards.
Thanks for the honest response. I wasn’t sure if you were serious or not.
But if the Fed raises rates 9/2015, you would then sell?
“This is definitely a new era. This time it’s really different and John Hampson’s analysis is missing it.”
If this is indeed your thinking then why do you even bother wasting your time coming to this site to post your comments?
Even though I might not agree with everything that JH writes about or the views of some posters, I somehow keep coming back here because the majority of the folks here are respectful, intelligent, razor sharp, use multiple tools for analysis/investing/trading, and I always learn something new from someone or at the very least a new perspective that I might not have considered.
I think why the majority detest you, Nicolas, is not for your assumed success in going long and staying long in a bull market, but the manner in which you present yourself. You critically demean the creator and facilitator of this great website and you completely disappear when the market goes against you and reappear only when it resumes its bullish trend with egotistical remarks that most folks find completely condescending.
So I would suggest if you think JH’s work has absolutely no merit, then maybe you should go and create your own website and post your own theories about CB omnipotence and see how many regular followers you get. CentralBankMania.com domain is still available … you should register it now before it disappears.
Also … NicolasTheTroll.com is also available if you want to blog about your adventures into hijacking investment website comment threads.
🙂 🙂
Bravo Steve T. Well said!!!!
If this is true it means unlimited buying power chasing fewer shares as companies buy back their own shares. Sounds bullish.
Valley,
Thanks for your posts. What do you make of todays action? Are you still short?
Steve T
yes agree, and as I guessed the US indices are following suit so all good for now.
J
A good day for the long. No doubt.
I laughed hard when someone is saying that now is a new era. I remember the tech bubble vividly, that the term new era was thrown out all over the place to justify why the tech bubble was still worth a buy. We all know what happened after that bubble burst..
New era?????? lol.
Just ignore Nicolas, nothing to see here, move along.
imho
J
Price won but at the expense of internals today! In this case, I go along with price. No short signals.
purvez. I suggest you overlay Bollinger bands to your $NYUD (cumulative) chart. it is instructive.
Price 1, Lunar seasonals 0.
So far, Valley. I still have hope.
Since the all time high in the DJIA I can only see 3 wavers everywhere. There are only 3 wave types that have that signature. Triangle and Leading/Ending Diagonals.
Since the start of the wave at the ATH there has been a slight downward bias. 26 Mar low was lower than 11 Mar. 23 Mar high was lower than ATH. Given that scenario it rules out the Triangle. It also cannot be an Ending Diagonal because that would have to be trending UPWARDS at this juncture.
Therefore that only leaves the Leading Diagonal option currently. I recognise that it’s a bit shallow but it hasn’t broken any rules of the Leading Diagonal. I believe we are completing W-4 of that structure currently as a flat or a double flat.
So until it goes above 18160 (then it is no longer converging towards the lower trend line) I’m going to stick with that as the most probable course. If it is a Leading Diagonal then we should soon get a 5th wave down in 3 sub waves which ideally should touch the bottom trend line between 11 Mar and 26 Mar or even go a little bit below it. Currently that would be just below 17500ish.
Although Newt said there wasn’t a sell signal yet, he suggested that the internals were weakening. Also I’ve added the BBs to the chart as Newt suggested and we are close to the top of the upper BB.
Let’s see what happens today and Monday.
Having said all the above, I’m currently flat but will get aggressive once (if) it breaks below 17800 which is where support currently appears to be.
It can ride along the upper BB.
When a horseman climbed back on his saddle (which took tremendous energy and strength), he probably would not fall off his horse immediately. He will continue to feel sick from his internal injuries, and his body further deteriorate by the sun, the wind, the storms and dehydration. The next time he fall off his horse, you can mutilate him.
So I watch the health of the market. No short and happy that all my longs are doing fine.
Op/EX next week and April typically being the best ave. return month of the year are anchors for the longs.
Chairman Mao would say…”retreat when your enemy advances”.
You can tell I have watched a lot of western movies.
Hahaha Newt, yes definitely a ‘B-Western’ plot there!! 🙂
Good to know that your longs are doing fine. I’m side lined at the moment and feeling like my Leading Diagonal hypothesis is slipping away.
Hi All,sorry I did not update the back as I have said before, I am busy for the analysis Astro Time JKSE(Indonesia), for the S & P 500 I am looking for 15 / 16Low and rally into high.pullback 22/23 27/4 into 30/4 rally.Gbu
sorry I did not update the back as I have said before, I am busy for the analysis time JKSE, for the S & P 500 I am looking for 15 / 16Low and rally into 22/23 High.pullback 27/4 rally into 30/4 .Gbu
So the significant falls to an approx mid April low
have not materialised, despite the certainty of some
in this scenario.
$ index will increasingly hurt so things get interesting
as we head in to Summer.
Big dichotomy in current views on the US .. beginning of
the cycle roll over, or temporary weakness with growth
accelerating in the second half of ’15 – the answer to
that largely determines if we see the final bull market
top over the next few months.
Have a good weekend folks.
‘Not materialised ‘ yet Phil.
Too early to count those chickens.
Take a look at a seven month daily chart of the June US dollar index futures with a 35 day sma and 50 day sma.
As the June US dollar index soars to new highs is Gold going to break to new lows? Is US stocks also going to smash to new lows right along with Gold as the dollar soars to yet new highs?
Is the Euro going to follow the Pound lower?
In current “market conditions” is it all about the strength of the Dollar?
How much more Dollar strength can US stocks take?
As long as Nicolas is not disrespectful to John or others I see no reason why he is not free to express his opinion as others do freely.
We don’t have to agree with him, because I certainly don’t.
Longs on DAX – stops set, SPX in profit but lagging as we can see. Here’s to another potential 32.3% profit in Q2 with any luck!
J
Closed dax long with almost 300 points profit. So very easy to make money on the DAX as long as you remain bullish on it. As I mentioned it is dragging the dow up with it but not as much as I had thought. I am not another Nicolas though as I pick my long positions carefully unlike him who blindly goes long everything (much to his luck). I am not confident to go long US markets but only Europe for the moment until things change.
I have taken half at over 300 points profit, and stops moved up the remainder and on the SPX long.
It’s never easy in my book.
J
Does California weather follow the solar cycle?
Drought in
2014, 2000, 1990, etc…
http://www.bloomberg.com/news/articles/2015-04-10/california-s-new-era-of-heat-destroys-all-previous-records
The self-professed “Blue-Ribband” experts will laugh at you for suggesting that there is a cyclical connection between the solar cycles and Earth’s climate! There might well be drought conditions in a specific area (eg. California), but the only temperature “records” showing an increase are the falsified ones from the likes of the NOAA: http://www.forbes.com/sites/jamestaylor/2012/06/13/doctored-data-not-u-s-temperatures-set-a-record-this-year/
It will be fanscinating to see where all this official falsification leads us – temperatures, GDP, unemployment, inflation etc.
“According to the EPA, US heatwaves are much less common and severe than they used to be”;
“According to NCDC, droughts have become less frequent and less severe in the US”;
“According to Rutgers University, autumn and winter snow extent is increasing in the US”
Forget about the doctored temperature readings…doesn’t the drought image look like the solar cycle?
Thanks for sharing that chart John, do you have a link please to the original?
@John Li I discussed this almost two years ago on here. A refresher is due but larger climatic patterns are solar cycle influenced.
Is the Pound going to lead the Euro and Yen lower?
Neither emerging market stocks nor European stocks matter to US stocks. All that matters to US stocks is how much more Dollar strength can they withstand.
GE selling its financials because this is the best time. This leaves GE a pure industrial play go forward. This is instructive for the econ. cycles observers.
Watch XLF not excited about the deal.
$NYHL made a lower peak today. Recent history would suggest a price peak in 2-3 weeks. So sell in May??
Sy Harding’s sell in May signal is triggered upon a MACD bearish cross anytime after April 16th…
Check out RSX (Russia). Gaps to fill at much lower price and overbought on daily oscillator.
Yes. It is overbought. Buy low sell high. The same rule still applies.
I guess it would not hurt us wary of now, the flash crash came not tell in advance.Gbu
Still short after all these green candles.
$NYA broke out from the Feb. Mar. channel resistance today.
Given the weak internals, a back-test of the $NYAD bullish fractals early next week may turn your position green.
Good luck.
Wow Valley, that’s not your trading style. You must have a lot of conviction about a down wave. GL.
Thanks, exiting shorts now. Next week Lunar Chord sans seasonals is perfect.
Probably a good decision from a risk’s standpoint since $NYAD is riding the upper BB.
The next best short set-up requires a noticeable down day and a rebound to marginally higher price with negative divergences baked in….then the HFT algos can take over and wipe out the longs.
Valley do you mean perfect for rising or falling?
Perfect for rising. Sans seasonals which imo don’t turn until 4/15 at the close (Wednesday).
Hi all ! thank you Allan for your comments, highly appreciated. Yes, the DAX trade was very easy, as discussed on this board.
Look, I think John Hampson’s analysis is interesting but he’s still missing the importance of central banks in our new era.
As I said, the Swiss central banks is explicitly buying small cap stocks for example. This is something important to know and few people on this board seem to understand that.
Nicolas, I will agree with you on te point tjat CB’s are most definitely supporting this market
One needs only study the intraday 15/60 min charts to see the constant injections that are being undertaken to support these markets.
I disagree however about the longer term success of CB action. As I keep saying,
Iiquidity is the key and liquidity is evaporating rapidly. This will be a failed experiment by CB’s that will have ramifications for decades.
The proof is in the pudding: GE is leaving the banking industry and will be followed by others.
The days are counting down to CB impotence.
Nothing to see here other than another CB disaster in the making. I can guarantee that a few years from now Central Planners will become THE most despised, hated and castigated group in history…….and rightly so IMO.
http://stockcharts.com/h-sc/ui?s=$HSI&p=W&yr=5&mn=0&dy=0&id=p64884472015
“The proof is in the pudding” ! Who corrupted the original saying so that it becomes meaningless.
“The proof of the pudding is in the eating”, is the saying.
This implies that you can’t “Judge a book by its cover”.
ie., A superficial analysis reveals nothing. You need to dig deep and thoroughly research a subject to really understand what is going on.
Yea, and all those “perfect humans” are broke too:
http://finance.yahoo.com/news/gaps-tale-2-brands-shows-100608760.html
Hamilton Bolton of the Bank Credit Analyst “discovered” the importance of CB EZ or tight money policy in the 1950’s. So it is quite old hat. He was one of the great stock market predictors of all time. The new thing is the Japanese experience. The economies are so overly indebted that even though loose policy still helps the economy, reducing unemployment and increasing interest rates and inflation albeit only slightly. When they stopped QEing, the economy maintained some momentum for 9 months to a year. We are at six months. They went into recession and a bear market
He is not missing central banks and has stated their behavior as humans is influenced similarly. Checks your facts.
What’s missing everywhere is identifying when the new bull market started as opposed to just ABC correction of Great Recession of 2008.
I called earlier this year for stocks to go up. Not like 2013 but like 2014. Think need to pay attention to 17 year stock markets cycle for electromagnetic energy influence as opposed to pure or a single solar cycle. I believe now the 22 or 44 cycles are more important then a single 11 year one.
Yeah…..the Hang……I am going to love shorting that sucker…….soon….:)
Good weekend al!
J
You don’t tug on Superman’s cape
You don’t piss (spit) into the wind
You don’t pull the mask off the old Lone Ranger
And you don’t go short in April
Slim in the above referenced Jim Croce song imo is actually the planet Saturn which entering Sagitarrius may delay the end of the bull market until 2016.
This Jim Croce song “Operator” is dedicated to Nicolas:
Operator, well could you help me make this trade?
See, this bullish market is old and faded
Living in L.A., with the sun soon losing Ray
This bubble hubris has created
Isn’t that the way they say it goes?
Well, let’s forget fundamental analysis
And give us the numbers that best fit
So the market will turn to equity gold
Operator, let’s forget about this call
You see there’s no pin that going to pop this bubble
Thank you for your credit, it’s been really kind
Going to sell my silver dime
Isn’t that the way they say it goes?
Well, let’s not forget fundamental analysis
And give us the numbers that best fit
So the market will continue to brightly glow
The seasonal high sell mid April & early May and go away.
Voltaire,
Superman doesn’t actually exist as far as I know – but point taken:)
(not sure about Lone Ranger though?)
J
A detailed summary from Bob Hoye.
The bull’s days are numbered.
http://biiwii.com/wordpress/2015/04/11/pivotal-events-44/
GM,
you have been vociferous is calling for an imminent
equity correction – so how soon is now?.
We are aware that the bull market’s days are numbered,
we are in to the 7th year.
That’s akin to to me predicting that an 80 year old has already
enjoyed the majority of their life.
I have referenced the end of Q2-Q3 as the final bull market top,
so we are only 7 weeks approximately from the beginning of
that period.
If the bull market rolls on in to 2016, then that call will
be poor, no reasons or excuses, just a bad call.
Certainty in conviction and the actual outcome are
often different.
The first is subjective, the actual outcome is factual.
There is no certainty in short term stock market timing,
it’s never existed and it never will.
Me vociferous? Go find some evidence of that and report back Phil. I’ve merely continually agreed with JH’s analysis since discovering this fine blog late last year. Topping is a process of course.
I may have been vociferous about gold and its miners once or twice?
What exactly does the ‘end of Q2 – Q3’ mean then Phil? 30th September?
Me, I think it’ll be much sooner than the seemingly wide window you generously give yourself. I’ll be surprised if we make it to the end of April.
But I’m pretty sure no one here will trade anything based on my view (except hopefully picking up some shiny real stuff).
Gold Bug Hillbillies
This is a story ’bout the metal AU
Gold bugs say equities are thru
Say load up on GDXJ
Having hard assets is the only way
To Preserve Wealth
(Or with Texas Tea)
Next thing you know all the bugs are millionaires
Kin folk say what savoir faire
Moving to California to see and be seen
Pack up the Lambo and move to Beverly
Hills that is, swimming pools and movie stars.
Followed by gratuitous banjo playing.
This attempt at humor is just to say that just as Jed Clampet in Beverly Hillbillies TV show became wealthy by being at the right place at the right time (beginning of the oil economy with oil on his land), the new wealth is digital and is tied to digital commerce. AU is historically wealth, times are a changing, no guarantee that it will continue to be so in future.
Nothing is guaranteed, tis true. But credit bubbles come and go, and this one’s a doozy, its bursting will be very painful for many.
I am invested in GDXJ so I am a bit of a gold bud myself 🙂
Here is an idea for you.
EEM:$SPX scores a confirmed double bottom this week. Could it be about time for the EEM to out-perform the US?
I will be buying EEM on any pull back if this young trend continues..
Or try VEU:SPY…VEU which excludes the US performs since US.
I am tired of Chair Yellen and her colleagues threaten me with a rate increase almost on a daily so I will go to friendly places where valuation is relatively low and their CBs are friendly.
First Post.
Here’s what I see:
1. Moon crosses 0 degrees into the northern hemisphere on April 16/17
2. Moon at perigee on April 17
3. New Moon April 18
4. Puetz Crash window still unofficially hanging around out there??
I feel that the longs are probably still in control next week. But after the above factors come into play I believe a strong possibility of a steep reversal exists. This reversal might have some extra bite to it due to the fact that we just passed through a Puetz crash window.
While we did not meet the exact criteria of a Puetz crash window, I’ve noticed there have been a number of instances where the solar/lunar eclipse + full moon combination has produced significant reversals even though the exact window of time and exact criteria was missed.
TechNoir,
Maybe a fractal analysis can bring some clarification.
Adding 5500 days to the very important March 2000 high gives April 15th 2015. The midpoint of this cycle – adding 2750 days- gives October 4th 2007; just a week before the biggest crash this century. This is fractal.
Adding 182 days (=180 degree Gann technique) to the October 15th low gives April 15th.
This will happen in week 15; 15 being the 110 degree angle on a 52 week cycle.
This coincides with a lunar declination extreme on April 10th.
Crashes typically occur after a sun-moon square and typically run for 3 lunar phases.Today is last square so this pattern predicts a may 4th low on the full moon.
I think the crash cycles are still open.
Cheers,
André
Andre’, this possibility fits nicely within the metal stem months which began April 4th and extends to June 4th. Metal chops wood (paper) and since stocks certificates are paper metal reduces value of stock certificates. Since 1998, stocks have averaged down .5% during metal stem months considering this includes about 38 months of data this indicates that these months are weak. Also, if at beginning of metal stem months, if you were to go short (this would be April 4) and remain short until 4% gain obtained, about 65% of time you would have made the 4% on the short trade; the other 35% of the time would have been about even. The only factor which works in favor of the bulls is the preelection news cycle which has so much tradable value that it may be more important that all of the other factors. Preelection years in year 5 of decade, 1995, 1975, 1955, 1935, 1915 have all had gains, especially Jan 1 to July 4.
thanks
So if I’m following you correctly, you’re saying the top might be in around April 15th?
That’s right.
Andre,
I take it you are still expecting a crash. Your analysis, while appreciated seems to be continually truncated by CB jawboning interventions. What are you current thoughts?
Thanks
Bluestar,
I am constantly updating my timing tools. Next weekend I will show what I’ve found. I remain bearish, but want to understand what kept the market floating. I doubt it is CB’s. But that’s just me.
Fractals explain electromagnetic properties at quantum mechanics levels. Spoke about angular momentum of light. You are just seeing the indirect data Andre. Look at light.
Welcome TechNoir, your post is dialed into how I look at the market with the moon as the fulcrum of most short term directional changes.
You real reason you don’t short April is because :-
http://www.seasonalcharts.com/saisonalitaet.html#pos03
In a “5” year which is also a pre-election year, you would expect a high around Aug/Sep, allowing for a May/Jun interim correction.
I do my Armstrong cycles from actual lows not fixed dates. That suggests Aug 18 as ideal for an important top.
The Central Bank experiment may well ultimately prove disastrous both for the economy and for the CBs themselves as the final result would probably require reconstructing the global banking system. But even if that should come to pass it may take 20 years or even more. As the ongoing rallies have shown, trying to time that has been futile and the path of least resistance has continued to be up.
Practically speaking, we have a tough choice in front of us when the buyer of stock pays in currency freely created. The stocks may be wildly overpriced relative to history but the currency used to pay for them may be even more overpriced relative to its potentially infinite supply. The theme that the CBs are pounding on is “Whatever you do, don’t hold cash” because as a group, we can truly turn it into trash. Of course, that is where Central Banks finally discover that they overplayed their hand.
From ZeroHedge:
Six days prior to Japan’s devastating 2011 undersea earthquake that killed over 18,000 people, around 50 melon-headed whales – a species that is a member of the dolphin family – beached themselves on Japan’s beaches. Now, 4 years later, and despite a lack of scientific evidence linking the two events, many Japanese took to social media in fear as the mass beaching of over 150 melon-headed whales on Japan’s shores has fueled fears of a repeat of the monster quake, which unleashed a towering tsunami and triggered a nuclear disaster.
Is something brewing in the sky?
Please note that the HC Jupiter/Saturn cycle made an opposition on February 23rd 2011, some 2 weeks before the March 11 tsunami.
And we are headed for a square on September 21st. Things will definitely get wild; not just in Japan.
Both Chernobyl and Fukushima exploded very close to hard aspects in the HC JS cycle.
Sun is waxing and waning effecting markets as JH has illustrated. J/S are also very important in their effects. Thanks, Andre for sharing about the J/S square coming up on Sept. 21st., worth looking at previous ones to see the effects.
Valley,
The last 110 angle on the HC j/s cycle was exact August 3rd 2014. That fits nicely with the peak that JH saw in solar activity.
Interesting that this J/S square will occur whilst S is in Sag (the Galaxy Center of our galaxy is also in Sag).
The energy could be enormous.
I doubt it. Melonhead whales, surely you jest?
For the future bag holder lemmings that think the laws of economics have been repealed because of an omnipotent Fed, you are fast running out of time to catch a clue. Unfortunately, such novice ignoramuses will have to learn the hard way and the suffer the consequences. And sad to say most of these fools will never learn.
Then again, that is what makes a market. For instance it is why we can accumulate large quantities over time of the illiquid gold and silver miners that are set (once again) to become 30-50 baggers into 2021.
In the very short-term, the metals (Gold & Silver) remain on track for an overall decline into late-June / early-July 2015 when the longer-term cycles (weekly, monthly, yearly & multi-year) have been targeting a very important bottom.
Gold remains set to reach its secondary high sometime between April 13 to the 24th.
And Gold needs to close above $1224.5 to extend its advance…
I hope most have used this opportunity to acquire the excellent deals that are set to benefit from the next cycle up in the precious metals. Everything is a go… contra-indicators like Nicolas included!
WW, your post is based upon the assumption that past industrial context will be of relevance in next phase of industrial mechanization cycle which is debatable. Graphene made from graphite and structured by nano engineering is poised to replace use of PMs in current sensitive electronic processes. Bitcoin and its numerous clones is set to modify alternative currency. If the two traditional uses of PMs namely high end electronics and store of value are usurped who will be buying the PMs at much higher levels?
China! The capitalist communists will save the gold bugs. Wouldn’ t that be ironic? Certainly improbable.
Gold and silver miners have bottomed ahead of the metals, as was always to be expected.
Gold and silver miners are an extreme BUY!……..more so than at any other time in the last 40 years.
Valley, remember your post made on April 12, 2015… you have too much to learn as you will be forced to discover! A very long learning curve for you. Where to begin? lol
All that I know is that AU/AG miners are only popular with investors for a time and then prices rise enormously; when unpopular all gains are given back. HL Hecla Mining was trading at multiples of current price in the 80s, and there has been 30 years of CPI inflation to boot. The CEO of Endeavor Mr. Cahill recently said at current metal prices the business has become a utility. A utility that produces a luxury good or speculative asset. Sounds kind of risky. Trade them like you drink whiskey. In moderation.
Please please Valley, don’t use that term ‘precious metals’.
Silver is an industrial metal, but gold is 99% a wealth reserve, nothing else, and totally unaffected by technology/jewellery/industry.
Many cultures value AG more than AU as wealth reserve. AG/AU ratio in mines is 1 to 16 and since AG is used up each year is quite scarce. I would say that qualifies AG as a PM.
Name one current culture that uses silver over gold? (I won’t allow a few gullible American silverbugs as an example of a culture).
Yeah, silver gets used up, like all industrial commodities. Gold doesn’t, it’s different, it’s an inter-generational wealth reserve. Most of the gold ever found still exists in vaults. Gold doesn’t oxidise, silver does, so does palladium etc.
There is only one gold, all the others are just plain old industrial metals.
Also, there are many forms of debt, but they’re all worthless if the capital/interest aren’t paid, or if the currency numerator takes a dive. That includes electronic digital debt too.
The China India middle class buy gold as store of value idea may/may not play out into the future. Given the ubiquity of electronics among the new earners in these regions could change the status value of AU and replace it with having a nice small home with yard in the suburbs, lots of electronics, a car or two, and money for education of the youth. Historically these expenses were not present in China India as non food luxury items were not available as their economies did not have the developed world suburban (read expensive) lifestyle available.
Best to ignore that $70 trillion debt elephant in the room.
Your world, your whole life, has been a bubble, and it will burst over the next 20 years. The yoof will be in for a rude awakening (and that won’t be because they can’t afford the latest iphone!
It is not a binary argument: either buy hard assets or else. Equity markets could still be the best place to be over the next 20 years and probably will be. Having hard assets is a great idea if we are going back in time economically; we aren’t.
Everything is rapidly going digital. Agreed fiscal issues are problem. Muddling along and having new electronic currency units will be solution. Middle class will be fine. So long as they are college educated and have a bit of career initiative. Being fine is defined as having shelter, food, and a bit of spending money.
Valley, my friend, you’re delusional. Yes, equities may be great for the next 20 years (just like the last 15 eh?), but they won’t.
Ignore the history of debt bubbles at your peril. Keep your head in the sand and hope that everything will muddle along nicely.
It won’t, everything is going down, really hard, for a long long time, many decades.
Time to ditch the rose-coloured spectacles.
NB…not hard assets mind you, just gold. Other hard assets are also bubbly.
Gold is wealth for folks who wear fur, hunt and gather, and live close to the land. A barbarous relic of the pre electronic age. I see the world as it is and is becoming, not a utopia, but a rapidly evolving technologically enhanced society. AU may be the wealth of nations, but the expression of that wealth for most will be electronic credit.
Yes, valley, most Westerners will shun gold, even as it increases in value by c. 30x over the next 20 years.
They will cling to their constantly devaluing electronic credits.
Good luck to them!
Watching Hillary announce and excitement that this has apparently generated on Fox, CNBC, etc. it seems obvious what might cause equities to continue their rally until 7/4 in the US. A kind of preelection year mania is likely to be in the air until then. Looking back at preelection years over the decades there is a reoccuring rally from 1/1 of preelection year until 7/4, this year will probably be the same.
Excitement for Hiallary??? I’m perplexed where you seen any of that.
Chinese exports collapsing and of course that is fuel the Shanghai required to make new 7 year highs.
We know why the market responds that way, the absurdity is why investors respond accordingly and never learn.
It is just another display of the power of mass market psychology lead by greed that will be forgotten in years to come when it happens all over again.
http://finance.yahoo.com/news/chinas-march-exports-down-14-022323583.html
Australia and Canada are going to get hammered
After I made another post I thought I would check the quotes on the Australian dollar and it is down 100 ticks. Looks like you may be right about the Aussie.
What I don’t understand is why the Aussie Stock market is holding up so strongly. The resource sector is getting hammered with some of the large companies on the verge of going broke. Real estate values here are at all time highs. There must be some sort of correction coming soon. We really didn’t see one in 2007/8 like in the US.
Here is an example of a large gas and energy producer.
http://hfgapps.hubb.com/asxtools/Charts.aspx?asxCode=STO&compare=comp_index&indicies=0&pma1=0&pma2=0&volumeInd=9&vma=0&TimeFrame=M10
Which could help to explain why Dr. Copper is facing stiff overhead resistance at its 100 day simple moving average.
RD, central banks have destroyed bond markets thus forcing investors, funds etc into stocks in search of higher yield regardless of how risky or overvalued stocks may be.
Look at CBA, its market cap is absurd beyond all reason. Its exposure to residential real estate is off the charts and I have gone on record here saying that when the RE and stock markets collapse CBA will collapse with it.
And I am not just talking about the stock price, I am talking about the bank collapsing. It will get that bad IMO.
Al. I hear you but where do you put your hoot. I have cash in the bank earning stuff all interest. Is gold the answer or farm land. Issue is if and when all this comes to a head the whole show will come down.
John H. based on history, a hallmark of the “2nd Chance” is a badly listed $NYAD and $NYUD (both cumulative) at the inflection point….. such as the time preceded the Oct. 1987 crash and Dec. 2007 start of the financial crisis.
The March 23rd high was supported by ATH in both $NYAD and $NYUD along with positive divergence to price. My point is…March 23rd was not the “2nd Chance” and perhaps the top and the 2nd chance are yet to come.
RD, many that know me here know me as a contrian( I hope). Based on that I have been accumulating physical gold and gold stocks since last year due to them being the most despised sector bar nne and sentiment being extreme.
If you look at the recent performance of both Aussie gold stocks and AUD gold they have both been a huge mover in recent months.
I think Agricultural land in the right region will be a good investment longer term. Residential real estate is in a once in a 100-200 year bubble in especially in Sydney.
RD, just to add, I have a very goodformer colleague no mate who is a investment banker. He has sold everything including his Sydney home and has bought a farm in Tasmania near Hobart.
That is extreme IMO but I can assure you that there are some very connected people very worried in Australia.
Al. Strangely enough I have been looking in that same area. Up here in the Surat Basin Queensland, the massive gas boom has come to a screaming holt. There are businesses shutting their doors everywhere.
Issue with rural land is that its still way to dear per acre to make something out of it. Flat getting 3% ROI from leasing it out. It will have to make a solid correction as well as all real estate to get me back into the game.
After noticing an advertisement last night for the Martin Armstrong film, I had a look at his website blog this morning and was surprised to see that he is accusing anyone linking solar cycles to the economy as a plagiarist. He chooses not to identify those plagiarists, so we can’t have a look at what they have been saying. http://armstrongeconomics.com/2015/04/12/sun-economy/
The very day before he made this accusation, he published a chart of late 1800s/early 1900s interest rates (link below). This chart is interesting in its own right, but it shows a very important relationship between solar maxima and interest rates which Mr Armstrong, the solar expert, has surprisingly failed to point out.
That interest rate chart:

1 – Call Money rates (the interest rate required to finance the all-important Margin Debt) spiked in 1882, 1896, 1907,1919 and 1929 (with some intervening spikes);
2 – monthly sunspot numbers (ISN) dropped out of its solar max plateau in SC12, 13, 14, 15 and 16 during 1882, 1896, 1907, 1919 and 1929 (plus or minus 6 months);
3 – ISN is currently threatening to drop out of the SC24 plateau (although I suspect it will keep modestly bouncing for several months yet);
4 – the current Call Money rate at 2.0% appears at first glance to be at an exact inversion to those earlier (and similarly weak) solar cycles.
So there are two possibilities to be decided very soon:
A) – QE and artificially low interest rates have over-ruled these natural cycles and forces (but to my mind that is not possible, because humans have no choice but to instinctively do what comes naturally); or,
B) – looking at the sheer magnitude and suddenness of those spikes in the Call Money rate as shown in Mr Armstrong’s chart, and all coinciding with ISN breakdowns, we are soon to see an explosion in interest rates.
More expensive Margin Debt is unlikely to be good for stock markets, but increasing general interest rates have in the past usually had the opposite effect. This will lead to massive volatility, just as it did in the late stages of those previous weak solar cycles – 1896 (right where we are now) being the most spectacular example: http://www.chartsrus.com/charts.php?image=http://www.sharelynx.com/chartsfixed/USDJIND1800-1900.gif
Mark, the graph here and the numbers, show that 33.88 was the high in 1896, very different from your chart.
http://armstrongeconomics.com/panic-of-1896/
http://i1.wp.com/armstrongeconomics.com/wp-content/uploads/2014/01/DJ1896-Y-Panic.jpg?resize=584%2C438
“The very first [formal Dow Jones Industrial] average price of industrial stocks, on May 26, 1896, was 40.94”: http://www.finfacts.ie/Private/curency/djones.htm
That opening value is significantly above the 33.88 Yearly High quoted in Mr Armstrong’s chart. This subject – the lesser accuracy of older data – has come up before, and has to be taken in context.
What I am referring to above regarding 1896 is that is where we are now in 2015 when measured by the number of months from the start of the solar cycle. Also, it was where ISN broke down during SC13, just as it is threatening to do soon. So I am looking to see what happened in the markets subsequent to 1896…
Thanks for the link and data
I see, so you mean that we are at $45, and will see $30 and then $90.
Very interesting, the correlation, and the Armstrong mocking. 😉
Getting every closer to new highs in the US markets which will invalidate the recent topping theories. You can’t fight this bull market and as such I give up all my recent bearish views on US markets (I was wrong). We are still in a bull market everywhere until more bearish signs appear. I am expecting a swift breakout to new highs maybe to around 18,700 area on the dow over the rest of this month. If this does not occur then a topping case may still have small signs of life. BTFD is my trading strategy for the next 2 weeks as a result. GLA
Just FYI, I am still long DOW and SPX but now short China A50 for a bit of balance. Some mixed data from China, we will see….
GLA
J
China, exports decline 15%, stocks soar. It is the credit cycle again. Real estate crashing, economy crashing, CB printing like crazy. So where can the money go? The stock mkt. The best time to buy stocks is when the CB is printing into a weak economy like Japan, China, Europe now, and the US until 6 months ago. Since WWII this would help the real economy recovery and self perpetuating growth would be generated. Since the 1990 top in Japan, not so much.
Anyway China appears to be in a similar situation to the US IN 2007. The monstrous real estate bubble has broken, but the economy is still positive aand the stock market is doing great. In fact, a speculative bubble seems well underway in China.
From the top in real estate to the recession in the US was 18 months. The top in Chinese real estate was Aug, 2014. As Gann would say, you can make a lot of money on the upside between now and then as a bull and a ton as a bear after that.
I should have said that China’s economy is slowing, not crashing. That will happen next year.
Bad news come at the bottom while the market is forward looking….China SH index doubled since its start of QE.. it is like given a second chance at buying SPX 1,332. Anyone?
Inflate or die. The only option and Reality.
I can imagine many eyes rolling at my provocative suggestion.
Buy outside of US on any pull-back.
Krish
Yes, no technical damage has been done so still bull – but be careful as always.
J
Newt, is the mkt really forward looking or in a weak economy (plenty of bad news) is the QE forcing interest rates down and stocks up in spite of the bad news. Either way you get bad news at the bottom but I believe fundamental reality (excess money to invest) is the accurate explanation, not prescience on part of the mkt. So the foreign mkts look great until the news gets good.
That’s true. That’s demand & supply concept, look at DAX and Nikkei and they were doing great this year so far and now China.
With most of the country making new high, I doubt US will have a bear case soon or it is going to to defer again.
Hi all ! Excellent news on China today, with their exports down 15%. I really hope we get a crappy earnings season, which would be great for stocks. So, honestly everything is going as planned.
I see that earnings estimates have been going down a lot recently, which is also great news, which should support the market going forward.
That post reminds me of something i read somewhere lately.
“Everything is backwards; everything is upside down. Doctors destroy health, lawyers destroy justice, universities destroy knowledge, governments destroy freedom, the major media destroy information, and religions destroy spirituality.” – Michael Ellner
i would add that banksters destroy wealth
This is going to end badly. Only inertia is holding America together. The American bonds of civility have already untethered and only the carrot of money is keeping everyone going the same direction. When that carrot turns out to be an illusion….
Apparently the poles on the sun switch quite regularly. Maybe the remaining planets suffer the same fate every so often. We just happen to be in one of those ‘oftens#?
Double ditto, thanks for that greatmquote.
Specie,
Inversion is Satanic. Nicholas is the devil himself.
ATHENS, April 13 (Reuters) – Greece denied on Monday a report by the Financial Times that it was preparing for a debt default if it did not reach a deal with its creditors by the end of the month.
The Financial Times reported that Athens planned to withhold loan tranches totalling 2.5 billion euros to the International Monetary Fund due in May and June if it failed to reach a deal on reforms with its creditors by the end of April.
“Greece … is not preparing for any debt default and the same goes for its lenders. Negotiations are proceeding swiftly towards a mutually beneficial solution,” Prime Minister Alexis Tsipras’ office said in a statement.
“What appears to rankle is that the Greek government is determined to put an end to austerity policies.”
(Reporting by Renee Maltezou; Writing by Karolina Tagaris; Editing by Gareth Jones) ((karolina.tagaris@thomsonreuters.com; +30 210 3376 469; Reuters Messaging: karolina.tagaris.reuters.com@reuters.net)
Greece is non-issue. At the end of the day, the ECB will just print whatever is needed to buy those greek bonds.
You know what it means when the ‘denial’ is too strenuous.
I just fail to understand Tsipras. Yes he promised to stay within the Euro but without austerity. An oxymoron by all standards. (moron being the operative word here).
However he seems a persuasive enough bloke to sell the concept of no austerity AND no Euro. He’s spending too much energy down the wrong ‘rabbit hole’ sadly.
Having failed to rally above its 100 day ma, Dr. Copper looks like it is heading south again.
Returning to the markets….has anyone here got an opinion about the ramp higher earlier and the reversal since?
Is this just another BTFD opportunity?
Newt, any insight on the ‘internals’ to help make a decision?
I still have my ‘screwy’ leading diagonal wave count (which is getting increasingly difficult to defend…but no rules broken yet) so I’m still expecting a down wave.
I’m not good at the short term stuff but I think Randy Phinney is. Maybe his analysis would answer your question
http://rightsideofthechart.com/qqq-spy-bearish-rising-wedge-pattern-overthrow/
Thx Specie, I do occasionally look at the RSOFTC site. He has some amazing success rates.
Good to know that he too is thinking along the same lines as me, from a different angle….I think.
Riding the Shetland until after 4/15. Shetland is a short horse.
Hehe Valley, that’s a nice analogy. I was under the impression that lunar ‘whatsits’ were favourable to the ‘upside’. Whats made you change your mind?
It would be reassuring to know ‘why’ I should be thinking short (other than an EW count).
BTW although I’m leaning short, I don’t have a short position yet. I’m still waiting for 17800 to be taken out, although my ‘impatient’ side is getting very twitchy now.
You should be thinking short because $NYAD (CUM>) needs a back-test from its recent break-out. Also, very weak $NYADV in the early going. I am short from SPX 2,016. This test may worth 50 S&P points to the shorts.
Thx for that insight Newt. I’ll probably take a short position tomorrow once I see a 3 waver to the upside.
Newt, did you mean SPX 2016 or 2106?
The Lunar Chord sans other factors is crystal clear bullish. However, price has very persistent seasonals in April for some reason. Down into 4/15, up 4/16 to 4/30. %s are more impressive when you consider the magnitude of the move. 55% trade doesn’t sound that great but if 55% of time 5% gain, and 45% of time 1% loss is better. This is the kind of magnitude of April seasonals deliver.
The only thing I am more certain of aside from the Shanghai collapsing is gold entering its final phase move that will take it well above the 2011 highs and likely on to absurd five figure levels before it collapses.
Hi Allan ! I would be very surprised if that happens. If gold rises too much, I’m sure central banks would short it to drive it back down.
As far as Shanghai is concerned, I think the move up is rational, based on great news we had today (exports down 15%). Also, the chinese economy is doing poorly right now and earnings should be crappy this year. All this is excellent news for chinese stocks.
Am I correct, you are implying that negative economic news makes certain that CB will print more money some of which will be used by corporations to buy back their shares which will boost their EPS? As well as ensuring ZIRP for many years which makes equities more attractive. This may be also how AU is being held at lower than mining cost as the shorts have unlimited sources.
Nicolas, I told you late last year to buy gold miners. Aussie gold miners have bottomed and entered bull markets. Many junior mid-tier are up over 400% in 4 months.
Markets can NOT be manipulated against the long term trend indefinitely. I also maintain that at some point higher gold is the only thing that will save central banks.
I can assure you as night follows day that central bankers understand the importance of gold and how it will save them when the time comes.
I am not even going to debate you on the other issue because even a 10 year old could grasp that ultimately all that really matters is fundamentals that will reassert themselves due to cyclical forces.
If US stocks are headed lower then so could the USD which means that the Euro could have just made a C of 2 (or B) lower and is starting up in a 3rd wave (or C wave).
While the Euro rallies in either a C or 3 wave the Yen could rally up in a C of E of a sideways Triangle of the past five months. All of this could equate to declining USD and US stocks.
Ahhhh, how sweet it is, the Retail Sales disappoints and the Dollar sells off along with US stocks.
Gone long dax at 12250 for the ride to 12500. Should be there by the end of the week.
Small long on the dow too just now at 17965. Aiming for 18100+ again by end of the week.
There is a chink of light in the DJT for those
looking for lower levels.
Sharp sell off on NSC after hrs on earnings.
“China MSCI forward P/E remains relatively cheap. It was just 10.3 at the start of April” according to Yardeni.
SPX PE is 20.47X according to Wall Street Journal.
A no brainier where money should go.
Russia is also sub-10.
Inflate or die. All CBs (except the US) are playing the Nicolas game.
In the mean time, GLD—more sell signals will be triggered today.
added shorts. $NYHL collapsing.
$NYLOW at 1. That is right. Only 1. Do you know what it means?
No and I can’t find anything useful on the web either other than ‘new 52 week lows’. I would have thought that it was quite bullish as ONLY 1 new low happened rather than a whole bunch, which is what you would expect at a bottom.
Am I anywhere near correct teacher?
Newt I’m beginning to get a feel for your ‘internal indicators’ and I had to smile at myself when you said that this ‘back test’ will be at least 50 SPX points….’cause I’m also looking for 500 points down on the DJIA.
It’s really good to get confirmation from ‘real time’ data of EW counts. This will become a major tool in my arsenal.
Thx very much.
With NSC selling off sharply last night,
I was surprised to see futures ahead earlier.
Today’s data has not helped and further
adds to the weak US Q1 picture, which now appears
to be the accepted.
So cycle about to roll over, or not?.
Watch the non energy sector earnings and outlook
on this Q, big clues there imv.
Hello Phil.
Did you see my question above?
What does your ‘end of q2 to q3’ actually mean?
Those are two quarters, so it’s not at all clear what you mean.
Thanks.
Well it takes incredible luck to call a turn, so hedging bets across a 6 month period seems prudent when wanting to be right…..
imho
J
Some amazing buying after 1600hrs London time….almost co-ordinated?
J
Naaah!! You suggesting collusion J? Tch Tch neither the MMs or the CBs would EVER do anything like that!!
P.S. Are you still long the Dow jegersmart?
Market not ready to roll over. Not yet! Covered my short. and made some . In the meantime, UK inflation 9 year low.
The world must inflate or die! CBs have no other choices. Accumulate the world.
Lafite every day!.
One more tool for you for free. Plot a $NYADV:$NYDEC”; Invisible; 5 EMA.
Observe the oversold region… The hook (up) at the right place is your buy signal. …in conjunction with other tools, of course. and understand why this tool is another power house.
I
Newt, this is ‘baptism by fire’…. and I’m not even christian!! LOL!! I’ve barely got to working out how to plot single indicators and now you want me to try out ratios.
OK Yoda I’ll have a go.
Jokes aside…THX V Much.
Newt, I can’t quite draw the $NYADV:$NYDEC as you have explained..on StockCharts. I can’t see the “Invisible” overlay? Could you explain the chart further?
Newt, whoa!! I’ve barely learnt to plot the individual indicators and now you want me to migrate to ‘ratios’.
You must remember my limited 2 brain cells ability…..puleasse.
“Invisible” is selected in the drop down menu of the Chart Attributes category called “Type” on the left margin.
Uhh whoops my first post about non-christian didn’t come through when I posted it so I thought the ‘comments police’ had blocked it…hence the second one to avoid any religious content.
Purvez, no just got out actually. This rally feels a bit fake – may go long on a close above 18125 or so.
imho
J
You are definitely one ‘smart’ jeger!! I’m counting on it being a fake as per my other posts.
Hi all ! Everything is under control as the markets prepare for a summer rally. Allan, why did I need to buy gold late last year ? I’m doing just fine with my IBB, AAPL and QQQ thank you. They’ve vaslty outperformed gold. I think in this new era of central banks omnipotence, gold is the last thing you want to own.
Another great news on retail sales which missed expectations.
Also good earnings by JNJ, they reported earnings down 9% and they cut their guidance. This is excellent news and should support the stock going forward.
What about Harry Dent’s prediction of Dow 6000 due to demographics?
Valley do you believe Nicolas even knows Harry?
Everybody knows Harry. Harry is the Martin Armstrong of demographic economic cycles.
Yes but Nicolas is not ‘everybody’….he’s ‘somebody’. We (us plebs) have to understand his superior view of the investment world around us. LOL.
Well, imo, Nicolas provides comic relief and is the board’s token contra-indicator. It’s a good sign of a top when airheads ramble on about every CB needs to own stocks! lmao
Is the DOW “Channel Trading” lower? (A-B-C-X-A-B-C)
Richard I, glad you noticed that too. I personally think that its a Leading Diagonal down (just extremely shallow).
We’ll see.
It’s been testing my patience for a while but refuses to ‘break any EW rules’ either.
Still waiting for Godot to tell the market it is overpriced.
Just trade. trade and trade as the market whipsaws. Sold all my OIL and USO accumulated in the past 3 weeks.
The trades were based on Paul Tudor Jones’ buy when price is below 25 EMA and when 25 EMA is below 200SMA.Combined that with fractals…very clean, simple and profitable.
Thanks for this trading technique. 25EMA below 200SMA buy when price is below if fractals support.
Once you mastered your tools, you are fluid, have no form, soft, flexible and flow like water and penetrate the (trading) cracks. at ease.
This is the Zen do.
Yes! Good trading approach and life as well. Water is the best.
Late May-September is my timeframe.
For me earnings and macro are vital here,
you can have a nasty correction without these
rolling over, but a new bear market highly unlikely.
My call is for a final bull market top within that
time, not a correction.
However that requires macro to now roll over,
if this does not happen it will be invalidated.
If the mid cycle view is correct, which would
result in a continuing bull market, then non energy
earnings should continue to be positive during
this Q earnings, this is the area to watch imv.
That will be my one and only attempt to nail the
bull market top timeframe, continually changing
dates is ridiculous as by it’s very nature you
will ultimately be “correct” by continually
suggesting future different dates.
Well, it’s very generous that you give yourself a 5 month timeframe Phil, so not entirely sure you can call that nailing it.
I think down hard April/May, rally into the second chance (Oct?), all bets off from there.
http://www.bloomberg.com/news/articles/2015-04-13/oil-rich-nations-burn-through-petrodollar-assets-at-record-pace
Purvez,
I am not smart, but I try to be careful instead. a little underwater on China A50 short, slight profit on long Nikkei and around even on Dax long.
I tend to trade some “opposite” positions when there is whipsaw…..^^
J
jegersmart : “I tend to trade some “opposite” positions when there is whipsaw…..”
Now if that’s not smart I don’t understand ‘smart’.
Congrats.
Will someone tell the Chinese that to double the SSEC in 9 months is just plain naughty and typically ignorant. They must think they are immune to our sun and our solar system. What happened to our Opium trade? Should we send another gunboat or set the FED on them?
Hi Peter ! I think the central bank of China took the right decision to double the SSEC. Why not ? I think all countries should want a higher stock market.
Stocks should be part of every central bank balance sheet. One day, all central banks in the world will own US$, Euros, Yens, S&P 500 futures, NASDAQ, EURO 50 index, etc…. as their reserves. Why own just currencies ? Stocks should be part of their reserves.
i don’t see anything wrong for Shanghai market, “new normal” applied every where and not just US, you can say their market is just catching up or ppl just suddenly realize their value, don’t forget, they have been in the bear market for 7 years.
Do you know who won the central banker of the year award in 2014? Yup, they gave it to Raghuram Rajan of India. Maybe if they televise the central banker of the year awards then these guys can become more popular than film stars. This will complement their established power base and enable them to take more reindeer into their reigns. Modern Vikings etc.
Troll away “Nicolas”……just troll away……
J
Well he succeeds in getting you to comment and
highlight him, repeatedly, so as that is probably the
rational you play right in to his hands.
“rationale”……is overrated?:D
J
Here’s a chart by The Wall Street Journal showing that there has been no convincing causal link between QE and US stock prices during the last three years. There is no evidence to suggest that Fed QE (or ECB or BOJ for that matter) has been timed to support stock prices. All we have here is a natural bull market, occasionally interspersed with gifts of free money to financial insiders.
“All we have here is a natural bull market”
wow
This cyclical bull market in US stocks has seen gains of just over 200%, so far. That’s about half of the gains during the late 1920s Dow, 1930s Dow and 1990s Nikkei; and about one quarter of late 1970s gold and late 1990s Nasdaq; and about one twenty-fifth of the earlier true bubbles (like tulip bulb prices).
If QE is the cause the current US stocks bull market, then it has a lot of work to do just to catch up with all those previous non-QE-fuelled bulls.
I don’t think QE has been timed or targeted per se, but the results are clear in terms of asset inflation imo. Whether CB’s now directly buy stocks or other assets I am not 100% sure, but the above graph could never have happened without QE in my view.
J
Hi Jegersmart ! I can tell you some central banks are officially directly buying stocks. The Swiss central bank has been buying small cap stocks recently, it’s in their quarterly report. Also, the bank of Japan has been buying stocks ETFs, it’s in their official policy, You can check it out.
Mario Draghi should pump the DAX back up today. Hope everyone is long dax or neutral but definitely not short. My personal view is to accept that stocks will not trade on fundamentals but on interest rates for the next couple years. Based on that the bull should run well in 2016 before reaching a plateau. I have switched to bullish on the US markets from neutral and am looking for any pull-backs as an opportunity to buy.The bears will capitulate again soon which will further accelerate stocks higher. Only thing I’m currently short is oil and that is not doing so well.
Hi Krish ! Yes, your analysis is similar to mine.I don’t understand why some people are calling me a troll just for expressing my opinion. It’s not my fault if central banks are driving stocks higher. I try to provide facts and detailed analysis to back up my point of view.
I got stopped out of short DOW after lowering stops to my new identified chart pattern. Oh well. Dr. Copper is lower today and the NY Fed area manufacturing index is lower but that seems to mean buy more stocks in anticipation of more CB easing thereby.
Richard please may I ask what your new chart pattern is? Thx.
Well some of your comments don’t make very much sense at all. I understand you are very bullish but you need to make sure your arguments make sense sometimes. I am also of the opinion that any minute investors could lose faith in central banks and we will have a cataclysmic crash. I am just betting that moment is still far down the line. A grexit may give us a 5% correction which I would be very happy to buy upon. Other than that decent pullbacks are a rare occurence nowadays.
I was looking for a larger downside correction before the bull market to new ATHs happened. Looks like that BTFD is still way to strong for any sizeable correction at this time. I used a new pattern of a downward channel to lower my stops with to cut my loses shorter than normal. Short the DOW is not the only trade I have on. I recommend looking at what I have recently posted about the Dollar etc. Also look at what others are posting about the USD such as all time record commercial net shorts etc.
Short SPX 2,107. This could be my hedge for SPX 1,450 bought in late 2012.
$NYLOW at 6..was 1 a few days ago.
Newt, please will you put me out of my misery and explain whether $NYLOW at 1 meant bullish or bearish….and ideally why too.
I did try to do my homework on Google but nothing sensible came back.
Thx.
Set $NYLOW with “Histogram” as Type.
Set $SPX as a Price indicator on top pane,
Now, observe and back test and come to your own conclusion where we are in term of market top/bottom. Complacency or fear.
Good luck!
It takes time to become a master. You will see your own enlightenment.
Zen spirit says…I know nothing so I continue to learn. I am in the cloud observing every minute.
A no mind spirited man can see things clearly instead of blindly believing in his crystal ball when he ain’t got it. The bias man shall suffer from perpetual disappointments.
Newt, you would make an excellent teacher. Thx for letting me learn by showing me the way rather than just answering the question. Much appreciated.
A big threat to the market is the lack of Up volume. This lack of commitment can not sustain the market unless buyers return to Mama Yellen with gusto..Would they?
A bigger threat would be a lack of Up direction. 😉
Agree Newt. The gusto volume day and VIX smash was on Friday, which was still minimal compared to March 20th or even Feb 3rd.
I really love this chart. Is there anybody on wall street not long the dollar?
too funny.
Anyone in US stocks is long the dollar… anyone that is clueless of history. The guy in the picture should be worried that lemmings like Nicolas are in the market. lol
Not sure of dollar hedgers terminology, but that chart shows dollar hedgers are net SHORT 100,000 contracts. The big trend change in the $ started in Jun of last year when large specs started buying heavily (trend following) and large commercials started selling heavily (sell more as prices rise). Oil did the same thing in the bull market that started in 2009. The large specs bought heavily and large commercial (oil producers) sold heavily. This went on for over 5 years and reached 500,000 contracts 5 times what had been extremes, before the bull mkt ended. The recent limits on the $ was about 50,000. This could be just a bear mkt rally as many believe, but my opinion, the beginning of a bull mkt of 3-5?years.
another view
Still short, remaining so until close of US mkt. Lunar Chord says go long at close as well.
short what Valley?
SP500
Valley could you expand on why you feel lunar aspects going bearish next week will be overcome by April seasonals?
Factors favoring non tidal lunar reaction:
1. Preelection year
2. Year 5
3. Price has not ramped up recently which feeds down moves
4. Option expiration post week sell offs mostly missing from Aprils in past.
Bought X. ..China import of iron ore up 2.4% as reported a few days again. X broke out from 3 months’ base.
Oil price rise suggests the global economy is sound and demand will continue to rise. All goes against any sort of bear scenario. Closed my oil short with a loss unfortunately. The oil disaster is over and we should get some stabilisation around these prices. Looking to buy oil stocks now for the recovery.
Lol ….rigged. Another Qtr of earnings beating expectations on average. That makes only two missed qtr’s in over a decade and a half.
It’s simple, lower estimates if you know you are going to miss, also use creative accounting, to ensure you meet or beat and continue to buy back to create the illusion that all is well.
Organic growth is NON-EXISTANT!
Does not matter. This is a casino.
Allan, can’t you read mate?
it was posted earlier….
“All we have here is a natural bull market”
four most expensive words in the world
THIS TIME IS DIFFERENT
Yeah, well there are some companies out there with real earnings transformations and organic growth explodining sectors that are going to outperform.
Not a recomendation btw just a fact 🙂
http://stockcharts.com/h-sc/ui?s=LSG&p=D&b=5&g=0&id=p74146002222
Hi Allan,
Yes, that’s a very good one. I own quite a bit from .46
Good day for the markets. ‘everything is awsome’. Maybe it’s time for commodities to join the party along with emerging markets. So, I would still keep my IBB, QQQ, and AAPL, but for new money I would recommend emerging markets now.
Congrats to all longs.
Hello Nic. Whilst you have been telling us all to buy the Q,s,IBB and overvalued stocks and sell gold miners, I was doing the exact opposite and buying good quality gold producers in both NA and OZ at bargain basement prices, many of which, make returns on IBB and SPX look positively anaemic.
Are any of these producers available to purchasers in other are countries? If so, could you mention the name of the producer and the symbol. Seems like the GDXJ is moving down to sideways last few months. So would be interesting to see miners that are actually rising in price. May be a sign of things to come. Even Nicolas mentioned commodities rallying so the writing may be on the wall.
Valley, not entirely sure what you mean by
“Are any of these producers available to purchasers in other are countries”
You can purchase whatever you like so long as you have access to the market, in this case the ASX.
At present I am absolutely bullish on NST,SBM,RMS,NCM which are up 300-500% since late 2014 and with improving gold prices and an increase n interest from investors SLR,KCN for starters, which have so far not budged, will double or triple without any problem.
Just to add. In NA the chart I posted above of LSG is a stock with an ever improving story. If gold gies back to anywhere near $1800 IMO it has $5 written all over it …..easily. And if gold breaks $2k then it will be skies the limit.
Another NA junior I like is Canadian listed Crocodile Gold which has projects in OZ an d is listed on the OTC market under CROCF. They are doing great things downunder.
Thanks, Allan. I agree easily two to three baggers, or more at these prices with decent time horizon.
Take a look at Soybeans and Wheat. BTW: I do have my eye on Gold but I am not positioned long Gold at the moment.
This morning’s Soybean report is very, very, interesting:
http://www.agrimoney.com/marketreport/am-markets-china-soybean-bounce-lifts-world-oilseed-markets–3092.html
New high on the RUT, so safe now to say that the
significant sell off to mid April is not happening,
appreciate that some here appeared certain this
would happen, no certainty on precise market
timing, merely guesses.
DJT continues to lag.
It’s mean earnings that investors mainly focus on
longer term, so a beat on lowered expectations
means little, if average earnings continue to chug
along this is highly supportive.
The figure to look at is non energy mean earnings
when the Q ends imv.
‘so safe now to say that the
significant sell off to mid April is not happening’
Folks, note the date and the time of this post (top tick?).
Lunar chord has all cylinders in sync tomorrow and Friday. I will exit longs next Monday (TNA 3x Rut). Lost .7% on recent bet shorting SPXU. Got into JNUG at open for nice gain on tiny position.
Tomorrow is equatorial crossing of moon should add volatility. VIX usually climbs in association with this day. High tide is on weekend, often marks tops. Perigee weekend, perigee often marks tops. So Lunar chord not “awesome” next week.
Preelection 5th years Aprils are usually really strong, so maybe won’t short until May. April and May are metal months so maybe the price chops that usually happen will be more muted given the 5th year effect.
The market is not monolithic so I hope you also own other things that make you a winner today.
Stonehenge is made up of hundreds of monoliths, as is the trading toolkit. My monolith at the moment is connecting the dots of lunar, tidal, seasonal, solar with market directions in the SPY, RUT, QQQ. Many other ways to approach trading, none imo as fascinating. And it seems to work based upon a few months of trading. What makes me a winner today, aside from trading, is having virtual friends like you.
Ooooh you flatterer you!!
😄
I wish you the best success in finding your path.
No man is an island, even in the virtual ocean. A two plied cord is stronger than a single strand. Stonehenge is important because it has many monoliths not only one. Having virtual friends like you Purvez, is the wind beneath my wings.
valley. I truly admire and am fascinated of the set of trading tools that you have. I am not half as sophisticated as several savvy investors on this board. Learning from you all and appreciate you sharing the invaluable knowledge.
My simple cycle count and basic candlestick analysis are what I mostly use, with EW as a confirmation tool. Continue longing miners and oil, and shorting VIX (for now). Luckily, I exited my short positions couple days ago, and have turned long since.
GLTA.
Go miners!
Go San Francisco 49ers! They are the named for the intrepid souls who
mined the hills and mountains of California starting in 1849 for AU.
Thanks. Good job trading. This is the year where techniques can be developed that will make beating buy and hold possible.
I think that was really good that Mario feared for his life today if only for a brief moment.
these banksters have destroyed the lives of so many people throughout the world.
Mario is just trying to keep the Euro stable, he’s not to blame for the crap system we live with.
It was a significant moment though, a sign that many in Europe want their own currencies (to devalue). Of course, devaluation destroys more lives than a stable currency Specie.
Choose your poison, hard(ish) money, or currency collapse. One saves the saver, the other rescues the debtors.
You’ll enjoy what the ECB does to the banksters in the next few years BTW.
I think if you make a long entry in the Apr 23-27 range, especially if it coincides with a downswing, then you can hold for about one month and sell May 22-25 and be pleasantly surprised. Lower support levels should hold next week and projections extrapolate towards +5% gain (over 100 points) to a new 52-week high in SPX.
Much shorter time frame, I am also in agreement with some others in the view that tomorrow Thursday might have a modest early morning dip and then rise strongly to end this week Apr 17. But this is a more speculative call obviously.
Sell setup NDX daily (RTVS) – http://scharts.co/1aWIWof
Drilling in to the 2 hr (RTS) – http://stockcharts.com/h-sc/ui?s=$NDX&p=120&b=9&g=5&id=p55254865877&a=403575808&r=1429133813986&cmd=print
Weekly big picture – http://scharts.co/1ILQbxI
Jay Taylor on the “Jaws of Death” indicator:
“But as we can see, the Fed has indeed caused a “Jaws of Death” in the market, such that the lower jaw on this Jaws of Death suggests that at the bottom of the next stock market crash and gold bull market peak, the ratio of the Dow to gold will be considerably less than 1:1; it could very well reach Ian Gordon’s prediction of Dow 1,000 and gold $4,000.”
This would be really good for the GDXJ.
I have known Ron Rosen for nearly 2 decades. I first became acquainted with him over 16 years ago and enjoyed many a cyber conversation with him on various topics, including at that tiem our common belief that gold was on the verge of greatness.
Ron’s timing may not be perfect, but I can vouch 100% for his longer term calls. He was ridculed back in early 2011, as was I , in fact I was drvien off a very popular website in Australia, for sounding the alarm about gold and silver stocks.
As for myself, I was a holder of Aussie gold SLR which had risen from the mid teens all the way up to $4 in 2011. i very luckily sold at $3.93 to be exact the very day before it topped out and as of yesterday it is .17 cents and I am literally backing up the truck!!!
Like I say, despite my repeated warnings to others then, I was told I was a fool, a insider stooge and many other things.
We have now gone full circle. Now I am told by many again that I am a fool fir buying Gold and silver and their stocks, which were the most despised sector in history and in many ways still are. They are the buy of this Century and perhaps the buy of any century ever.
Don’t listen to me though, I could be a raving lunatic, but if Ron Rosen says gold is going to explode higher, I would pay very close attention.
Click to access rosen033015.pdf
Hi Allan, thanks for your thoughts on Ron Rosen. I only discovered him in the last few years but i really enjoy reading him.
Gold will not rule in the coming Mini-Ice Age. Food is what will rule by 2030 and not Gold as all who have Gold will be trading it for Food as crop failure happens World wide due to Drought caused by cold air that does not hold moisture. Go to either Pole and the air is very dry…
Goji berries could be cultivated. They do well in dry soils and have extensive root systems. They have high nutritional content and as a snack are delicious.
Meh. I enjoy some doom pr0n as much as the next millennialist, but after someone was posting about this last year (you?), I went to do a little research.
According to this scientist, the mini ice-age stuff is overdone and -hilariously, enough- all that CO2 will help to ameliorate it anyway:
In every age, there are those that are convinced that the end of the world is nigh; it seems to be a perennial human preoccupation.
Personally, I am more concerned by the warmongering of the dying American empire against the Russians/Chinese.
He is a gifted writer that I have been reading on Kitco for years also. By the way, couldn’t the Barricks and Goldcorps ride out another few years of ridiculously low AU prices and slowly pick off the better juniors along the way thus ensuring their profitability and market share?
Barrick and goldcorp might last a few more years with low gold prices but I won’t make it
These shenanigans are wearing me out
“…I can vouch 100% for his longer term calls”.
Ron Rosen 22 October 2013: “US is within months of total collapse… We are now at a fork in the road for the markets and there is no way back. Either we are going to enter an electronic hyperinflation, or we head south and the major averages will collapse. But, regardless, gold is going to super-spike…” http://silveristhenew.com/2013/10/22/60-year-market-veteran-says-us-is-within-months-of-collapse/
You will tell me that he is right and is only 20 months out in his timing, but it is only perpetual losers – like you and your side-kick Specie – who are content to be obstinate bears in a bull market for month after month after month.
You have very selective memories.
Mark didn’t say he was perfect……As for selective memories? Let’s see.
I have screaming and jumping up and down trying to tell folks to buy gold stocks since last qtr 2014.
Whilst you and many here diddle around with trying to eek out a few bucks either way on the broader indices, all whilst taking huge risk I may add, I have been smashing it in gold and silver stocks, whilst being invested in the most undervalued, most despised and least risky sector of any, period.
Things look fine from where I sit 😉
“You will tell me that he is right and is only 20 months out in his timing, but it is only perpetual losers – like you and your side-kick Specie”
I think it best that I leave for a while before I say somethIng that offends. It is arrogant twats like you that ruin forums like this and I for one DO NOT have subject myslef to DH’s like you.
I gave my opinions and advice, agree, don’t agree, I don’t care but at laest show some class if you disagree.
Surely this cyclical bull in stocks must crack. I’m over here swimming in the bloodbath of gold miners. I will continue to ride dia and qqq call positions until sunspots pick up for one last run.
Still looking good imo. I dont have it here… (I should add), where most overall divergences exist you can find either the north or south measurments themselves to continue to match the pattern during the overall divergence.
added to dax long. Shouldn’t be long for it to hit 12500. Long term target still remains 14000.
The problem wit h the Dax is that it has broken through support this morning around 12175ish. Theoretically, there is a danger that it could retest the 12050 level….but am looking to add.
J
Looks like you were right! Added again though. Should find good support here. The Greece situation will blow over as it usually does and we will get a nice rally again. great chance to go long if you aren’t already in.
Great call on 12050 by the way jegersmart. Hoping it bounces now and we see a positive finish for the day 😛
p.s. we will see in the next few hours whether that is a bear flag or not….(DAX)
I guess it was, look for 12025…imho
J
I should say 12050, beyond that 11960…..am still waiting to go long…..will probably take an hour or two to resolve…imho
J
Don’t be in a hurry, these are clear patterns that will resolve one way or the other. No point acting rashly.
Problem is I have to get some sun whilst I can still do so lying on my bed…….(south facing)…..hmmm….money or tan…..^^
J
That is one ugly daily candle on the DAX, still waiting to see how this is going to pan out…
J
Agreed. Maybe i jumped in too early with this one. Very confident it will recover but may be nursing losses for a while if it does indeed carry on declining.
Remember jobless claims in 25 mins……!
I would be very cautious on Euro short positions here,
on any Greek exit expect a powerful snap back as
the weakest member leaves.
Hey Allan, you sure get a lotta crap thrown at you. Didn’t think i would be a target just because of my comments to you.
But I guess most of that is due to different perceptions about time frames. A lot of people seem to be in a big hurry to make money.
My experience is that real wealth takes a longer term perspective and conviction of ideas. Then the money comes in like waves over the beach.
But as “THEY” say….”THIS TIME IT’S DIFFERENT”
Mate I come across these type of investors all the time. They think they’re killing it because they scalp a few dollars day trading either direction.
The fact is the big money is made by knwing when a sector is overvalued amd moving your capital into undervalued well ahead of the herd.
And when I say big money, I mean having the courage of your convictions and moving multiple seven figure amounts into a sector.
I recently sold ALL my residential investment property in Sydney and have taken huge positions in gold and silver.
So I either sink OR I come up looking like a genius.
I am sorry you got caught up in it. I’m ouuta here for a while because after my experience trying to offer advice once before on another website and getting crapped on constantly I no longer have any tolerance whatsoever toward this kind of BS!
Cheers take care
Allan, I don’t think there was any need for Mark to make his point so personally at all, let’s hope he will apologise for the language used.
I’m with you on the miners of course, but I think Ron Rosen is one of the many who have been caught out in the past 2-3 years of the gold bear, so I understand Mark’s point. It’s the same point Armstrong makes, gold promoters say ‘buy’ or ‘hyperinflation’ too often to be credible. Like you, I agree you just need to pick the spots to buy during the dip for the long run.
I hope you hang around anyway, best wishes.
Zen ways. refrain from criticism, expectation and demand. You will find peace and tranquility.
In trading, don’t be righteous.
Hi Allan… your comments are most appreciated. Hope you don’t leave. Just ignore idiots like Mark and Nicolas – these are smug contra-indicators that always appear at tops. They have no clue about all the recent developments in the world that are challenging the current banking structure.
Please stick around and enjoy the transition – 2015 is turning into a remarkable year. Gold will soon be viewed as a currency yet again… China is seeing to that. 🙂
Allan
Hope that you don’t jump ship permanently, although I must ask whether it is necessary to use such a negative tone towards people who trade shorter timeframes even if a negative tone was used against you by somebody in the first place?
I don’t have 7 figure sums outside of my pensions, but I replaced a large London salary through trading, and as I am nowhere near pensionable age I cannot live off that pension yet:) So in this scenario based on your own description, I would class you as a millionaire investor, which is presumably why there is some disconnect when discussing markets amongst all the individuals on here who presumably are not all millionaire investors who don’t need an income? (Nicolas excepted, he has already put me in my place and is clearly a billionaire).
What I don’t agree with though, if you don’t mind me saying, is you stooping to a low level and deriding others? If you have $25+ million just in cash, why bother to make yourself look like a di*k on an internet forum?
Hope you stay, my longer term investments are somewhat aligned to yours.
imho
J
The problem I see: Allan tries to….in his words “….trying to offer advice”…
Life is funny. Trying to offer something to people who did not seek advise is called imposing, not welcomed by most.
Allan feels pain now. How would pain going away for him?
Jegersmart, you must stop using ‘imho’ because some of your opinions are ‘anything but’.
I agree with ‘most’ of them but ‘humble’ they ain’t.
I’d much rather you said what you ‘thought’ and let the ‘recipient’ make their own conclusions.
Now that may ignite WW3 but hey….what’s the point of living otherwise?
Some comments on here are so childish it kind of ruins this site.I can see why John rarely comments as he has to trawl through most of the rubbish.
I’ve partially closed my dax long as it looks like it may head below 12000. Will reopen when the situation is a bit more settled but this time will try and hold until 12500 to recover losses and make solid profits on top.
Hi Krish ! Yes, some comments are totally useless. Me too, I’m tired of going through the garbage. But I know some people here appreciate my detailed analysis of the markets.
regards
Whats your opinion of the dax now that its dropped below 12000. Good buying opportunity or is it going to fall further? Doesn’t look so bullish after today. Longer term it will go up for sure but just interested in your short term opinion on maybe the next week.
No offense but instead asking clueless another clueless guy what is going on learn to read the charts… instead to repeat up up up
Have you saw the MACD and RSI divergence on the daily? Did you pay attention?
3 down and 3 up with higher high is expanded flat, next is strong impulse C lower with target 11400-11200 to finish the correction – is today strong enough? Yes impulse is running.
Wave 1 of C will finish soon around 11850-11900 and when we see wave 2… who knows 12100-12300 it will not be time to buy it will be time to sell.
I hope this is helpful… do not take it personal:)
That may be the charts but my interest is the situation with Greece. If that gets some form of agreement it doesn’t matter what the charts say we will get an enormous rally to new highs. At the moment everyone has fled the DAX because of Greece. In a couple weeks they will be back in wishing they hadn’t panicked when the situation is resolved.
Your comment shows you are definitely emotionally attached to this trade (Dax up)
Of course it will move higher but first a correction for a few weeks.
Why should I buy at 12k when I can buy at 11k
Stay cool and wait patiently the right moment.
P.S. I could not care less about Greece. The chart tells you everything.
Forget the news watch the charts. The big boys act long before the news and you see at on the chart. This is the only way to follow them.
Krish
I don’t try to predict the future, but looking at price levels I am keeping an eye on 11960 and then 11870 which are the recent lows where prices reversed last time round. On the upside a close or convincing break above 12050 would also be of interest to me.
all imho ofc.
J
i hope everything is okay with John Hampson.
I don’t see anything since April 6.
karni
It is disingenuous to deliberately insult people and then ask them not to take offence…..why make yourself look like a pri*k when making a point?
You could be right, you also talk as if you are definitely going to be right….why is that? As I said, there are some levels I am keeping an eye out for (one of which agrees with your opinion), and I didn’t insult anyone sharing that information.
Did you have a bad day or are you actually the above?
Don’t take it personally.
J
karni,
p.s. There was MACD divergence from mid May 2013 until June 2014 on the DAX….so what? Were you paying attention? If so, how did you trade it lol?
J
Seriously? first there is no divergence second there was an 18 month cycle low in the spring 2013.
I use technical analysis, EW and Hurst cycles. Divergence for it self does not mean nothing, but combine all techniques and you have powerful tools.
Example the Dax currently:
– EW rising with corrective waves 3 down 3 up with higher high
before that huge run probably wave 3 what follows wave 4. What kind of 4 when you have the information above?
– TA divergences on the daily charts appeared between the two highs
– cycles 40 week cycle average length 31-35 weeks currently at week 27
Now make your conclusions:)
learn to read the charts… learn to read the charts… learn to read the charts…
NYSE IH&S break-out to be respected.
Stocks aren’t the only game in town; check out the currencies. (Cut your loses short and let your profits run.) Note that Dr. Copper seems to being doing a complete reversal to the upside so as to close above its 100 day sma. Stock Shorts take note.
Richard our friend Nic said that the commodities would soon join in.
Well here’s the proof.
I’m beginning to think that Nic = aka Yellen or Bernanke or both. Just trying to ease their collective consciences.
Many on this board are dead set on an imminent collapse of US stocks that they can not see that other economies are actually starting to recover. Take Brazil for instance; one of the BRICs. March’s trade balance was a surprise to the upside which is one of the reasons that its currency has begun to recover. Look at the surprising turn around in the Russian ruble too. If Copper starts to rally it won’t be because of the USA but because the World economy is starting to recover. This seems to goad many on this board.
I am expecting US stocks to top out this Fall but not to go parabolic to that top but more “corrective” as in overlapping waves etc. But right-here-and-now it may be commodities that take off and rally better than US stocks to this Fall because World demand could be increasing and rapidly accelerate this summer.
Also note that if other economies are in fact recovering then the rally in the USD is probably over and could reverse into a Bear market which would also “fit” with beginning Bull markets in major commodities.
Greece is a non-issue. The ECB will just print whatever is needed to buy all the greek bonds.
That’s why I’m still bullish on the DAX. It’s just taking a breather after a huge rally.
I’m going to sound like the ‘boy who cried wolf’ (one tooooo many times) but the more I look at this wave in the DJIA since the ATH the more I’m convinced we are seeing a correction which has NOT finished yet. This late surge today is in my opinion a ‘c’ wave to complete a ‘B’ wave flat as follows:
w-A up from Mar 11th to Mar23
w-B down from Mar 23 to Mar26
w-C up from Mar26 to today or a bit higher.
The latter has been a ‘bu*&^@gger of a wave that has seriously tried my patience.
However if my ‘conjecture’ is right then not a ‘single wolf’ but a whole PACK are about to descend.
Either that or I’ve been living in ‘cuckoo land’ for many many years.
GLA.
Oops sorry those should read w-a, w-b and w-b in the above comment.
Hehehe not am I only sounding like the ‘boy who cried wolf’ I seem to be the ‘voice in the wilderness’ as well.
QE ZIRP where can all the ones and zeros nest except in commodities, real estate, or equities. Commodities and real estate are economic reality, no wage growth no bubble there. Equities is only asset class remaining.
YES very true Valley….but one could get to a HUNDRED years before ANY of this breaks. All Heill the Fed!!
‘goose step march’ required here with RIGHT arm fully outstretched at precisely 45 degrees.
One could argue that commodities are playthings of financial speculators (the Saudis have this view). As for real estate, I am sure ZIRP/QE for 6 years has not caused another bubble, sure of it! 😉
Apparently from Nicolas posts CBs are using the money to buy equities now. Also corporations are using low interest loans from the CBs to buy back their own shares.
The ONLY ‘bug bear’ in my count is that IG have gone positive (upwards) compared to my ‘other’ quote supplier.
Usually it is IG who ‘games’ the system so I suspect that for a while we may still have an ‘upward’ bias.
I noticed that John Hampson has been trading since 2004
anybody here been trading longer?
Not me. Was busy being a surf to an odorous lord
Ugh did I say ‘surf’? My english teacher will be turning in her grave. SERF!!
VERY SORRY MISS!!
About 1979.
John I will take this opportunity to wish you all the very best. I will continue to read your articles but have decided I no longer wish to participate in the forum.
There are sevral here that I wish all the best. There are many others who quite frankly have no idea what they are dealing with in this market.
This is without doubt the most dangerous market in history, not only because it is overvalued to extreme but because of other factors that now form the basis with how markets operate. These markets are no longer functional and anyone subjecting capital on the long side is taking a monumental risk. You seriously do not understand how dangerous this market is. John has repeatedly warned you but many think you can outsmart it.
Newt, somebody DID actually ask my advice which is why I freely gave it. I really did not appreciate or see the need for rmyself to be called a “loser” or for specie either for offering that advice.
As for Ron Rosen, the man could could pobably buy amd sell that poster 50 x over.
All the best John as well as many others here.
Thanks for posting especially regarding the ASX miners. All the Best!
Thanks Allan, all the best to you too.
J
J, mate you would understand why I reacted the way I did if you knew how much time amd effort I put into analysing the companies I invest in.
To take the time to then offer that to somebody that asks, only to have somebody else stiff me is a total insult and frankly one I won’t put up with.
All the best to you.
Allan, take a few days away, have a few cold beers, I’m sure you’ll calm down and realise this is basically a decent spot on the internet, and this is (AFAIK) the first time we’ve seen any personal comments, even though we do all have our own strong views.
Hope to see you back soon, and best wishes to you, thanks for the miners info too.
Chill out to this, apt lyrics too:
Allan: I took a good hard look at your Rosen link and I think that both you and Rosen need to seriously consider that the DOW will top 10/14/2015 and that Gold will bottom 10/14/2015. Just like the DOW’s top will be extremely high so will Gold’s bottom be extremely low. Consider wisely…
I totally understand but you can’t let people get to you like that. All that happens is that you move from board to board and don’t benefit in the long-run.
I like the fact people disagree here, and you will always have people who go overboard – on ANY board. You have to remember that people will say stuff because of the way it affects them or how they feel about themselves – this has nothing to do with you or me or whoever the target is……if you have to feel anything, feel pity and ignore…
Have a think about it maybe? There is no point flitting from to board to board because someone has roasted you because of how they feel about themselves…..
J
Tomorrow being day after equatorial crossing, within a day of perigee and new moon, and opex Friday could be very volatile with upward bias. I am long RUT.
April 9 was Mercury Superior Conjunction (Superior means other side of sun, inferior means this side of the sun) which has a cat of nine tails effect where stocks rarely end up higher counting nine calendar days forward from that day. This could if market still has upward potential mean that next week will resume upward track.
While no body was looking; the commodity currencies had pulled up to a stop light, revved up their engines, and when the light turned green they dumped their clutches and took off burning rubber down the street. The thing is –they are only in first gear….
Just in case no one noticed Crude, Copper, and the Canadian Dollar all closed above their 100 day simple moving averages today and it looks like that the Australian Dollar will soon do the same. Clearly, this points to the World economy starting to recover regardless of anyone’s “world view” that US stocks should collapse.
I am still holding that US stocks won’t top until this Fall before their major correction or collapse to start. A recovering World economy this northern hemisphere Summer would help US stocks to –not– collapse until the Summer is over.
Excellent observation! $USD…if drops below 97 would confirm a double top and cause a spark in many under-performing assets to play catch-up with the US. In fact, many non-US assets have already out-performed the US equity markets since January 1st.
This could be a very profitable trade. I am working on it.
A shocker is the Russian Ruble and Brazilian Real. It could be said that they are leading the way for this Summer….(such as a totally unexpected parabolic collapse in Gold as every non-US asset rallies parabolicly, along with their currencies, resulting in a world wide dump of Gold.)
Richard, I don’t understand your premise at all.
For example, these past 7 months EZ assets (stocks and bonds) have soared in response to a weak Euro.
Yet you expect assets to soar in response to strong currencies?
On what basis? It’s like a see-saw, one up, one down.
Regards.
If the commodity currencies and world economy about to go into 2nd gear, doesn’t that mean that GLD will go along for the ride. The “love trade” in AU as Frank Holmes says is tied to GDP of China and India. Similarly, if the Aussie Dollar is rising the ASX in dollar terms will appreciate and attract investment, many of the largest miners are on the ASX or the TSE.
No, Gold will be “the exception to the rule”. As currencies rally, Gold will be sold off to buy those currencies and, more importantly, to buy the parabolicly rising assets of those rising currencies. At the end of this World wide “summer of recovery” Gold will be the laughing stock of the world.
Allan needs to admit that Ron Rosen’s wave counting system allows for Gold to fall parabolicly downwards this summer. I think that the unexpected and sharp rallies in the Russian Ruble and Brazilian Real are pointing towards that unexpected -wave count- this summer. To Russians and Brazilians, Gold is falling hard and sharp basis their currencies and, soon, will be doing the same to many other currencies throughout the World. When the assets in those rising currencies takes off Gold will collapse and head south in a hurry.
Commodities will rally this summer with one exception: Gold.
Good call, will look into the commodity equities and commodity currencies for next few weeks to see if this trend continues. Copper having its day would be so bullish for FCX Freeport which could triple.
At last some quality comments:)
I think too, that we will see an important top later this year and in the summer only a normal correction.
Why do you pointing to 10/14/2015? is it something astrological ,cycles, Gann, Bradley ???
John, got to post something! I get tired of scrolling through all the comments. It takes FORever. :o)
I guess we will see what happens, Isaacson has been wrong before, just like the rest of us…:)
The only thing a bit worrying about his “prediction”, is that he sounds SO certain…….
imho
J
Good to see passion and conviction,
unfortunately this does not aways equate to
an expected outcome, no matter how certain we are.
In spring 2009 I had a stand up row with my Dad
about his decision to plough money in to buy to
let properties around Surrey.
I was convinced my view was correct and that
he was making a huge miscalculation with further
house price falls to come.
Well 6 years on my Parents have enjoyed fantastic
returns and my view now looks ridiculous.
My Dad is currently in the process of selling up,
with one of those properties left to exchange contracts on.
It was a big learn for me.
Major weakness in the DAX. No more adding for me. Just waiting out this correction. As long as the dax doesnt drop to 10,000 my account should be ok.
Wow Krish, probably not worth waiting to find out. Perhaps consider hedging till it turns back.
Haha I always hedge at the wrong time so will just leave it for now. This is just a much needed correction in the markets and once its over we should print new highs on the DAX at least. This DAX drop is too severe in my opinion and the bounce back will be equally quick. Its the slow drops I’d be worried about as they tend to signal a trend change. I still think we hit 14,000 by Q3 and after that I would become neutral.
Krish, don’t you have a stop loss in place?
What happens if that was the top, and its down to 7.000 over the next few years?
It would be awful to wipe out your account on ‘hope’ alone.
Be careful.
trader specie asked how long people have traded
did my first trade in 1961
Veteran! 2009 for me – total noob.
wow. I’m not surprised you’ve been doing it a long time but I never figured it would be that long. You got me beat by 12 years.
Phil
Life has so many random components that are impossible for us to evaluate and control. In the particular case you mention, your father seems to have been right and you seem to have been wrong. However, at another time you may have been right and he wrong…..the important thing is not to be right or wrong, but to realise that both possibilities existed and due to factors outside of our control an outcome was reached.
That is why I am alarmed at people who speak about possible outcomes with ironcast certainty, and in the case of Isaacson using emotive words like “parabolic”. It creates a message of extreme certainty and extreme outcomes – none of which he can with any surety state will occur.
Intellectually we all know this, but that sort of message is irresponsible because it could inject bias.
Having said that, I am always interested in what Isaacson has to write, but I have to be careful not to be affected by his “fire and brimstone” approach and remember that people who display such certainty are usually fooled by randomness even more than usual…
imho
J
Should you do a study of what Ron Rosen is promoting then you would know that my use of “parabolic” is totally correct FOR BOTH STOCKS AND GOLD. Allan ought to know this and probably will know it once he steps back from the markets for a while to clear his head. Once Allan gets a clear head he will recognize that stocks can go either parabolicly higher or lower and so can Gold —in this unique time frame— according to what Ron Rosen is promoting. In fact, according to the statistics of what Ron Rosen is promoting Ron Rosen’s predictions of a top in stocks having already occurred AND NOT OCCURING THIS FALL is against what he is promoting. Odd isn’t it. Allan should know this too and it might be what is upsetting him once he clears his head.
Ron Rosen is a sad situation. Due to gold stocks topping out and not cofirming golds rise to its high in 2011, he was expecting a big correction in gold. So he missed the best part of the rise, and after the top, he started calling the bottom. So his gold predictions have been even worse than most gold newsletters. He did call the stock market bottom in 2009. He has been so bad on gold I wrote, Rosen/Delta, Gannglobal/flannagan, and several others were bullish on gold, hence no way it could rise. Well, they’ve done better, it hasn’t gone to new lows since then.
One of my daily reads, since GM pointed me to it is the Alhambra Investments blog. The following:
http://www.alhambrapartners.com/2015/04/16/direct-evidence-for-the-supercycle/
is a somewhat ‘over my head in detail’ account of why the dollar has been rising and its associated effects on the economy.
If I’m right in my understanding of its conclusion then there is still a lot more gain for the dollar to come and a lot more pain for the economy.
Of course nothing travels in a straight line but the title of the piece suggests that is not easily stoppable or reversible.
purvez, the main point I have gleaned from Jeff Snyder at Alahmbra is that global banks dictate the availability of dollars/credit, and they are in tightening mode (big time).
Maybe they are influenced by perceived Fed tightening, maybe by solar impacts, maybe they just recognise it’s all as good as it gets (bubbly) and are making sound business decisions to reduce their risks, and in doing so, they guarantee the credit cycle turns down, and takes everything with it.
Whatever the reason, the eurodollar market is signalling risk off, and it’s been a trend for many months, far worse than anything seen since 08-09.
So, buckle up, it’s going to get very bumpy.
Krish, close losers early. Always.
p.s. China has been a windfall this morning, but I am not staying in long:)
How do you trade China?
Timestamp – 11:20 BST. Does anyone here know the ‘reason’ for this ‘sudden sharp dive south’ (as described by MarketWatch) in the futures?
Only thing I’ve found is that Bloomberg Terminals world wide have gone down. IF that is the cause of the down draft then I suspect it will quickly correct itself upwards too.
There were some rumours about China clamping down
on margin.
One of the UK bookmakers stopped taking bets on Greece
leaving the Euro yesterday, but the Euro is on the rise.
As mentioned yesterday I would be very careful about
being short the common currency at this juncture.
Plenty of correction calls doing the rounds this morning
folks, if you want some pre weekend reading.
I do not know if this stat is valid, but have read that bearish
articles generate significantly more page views that bullish ones.
May be on some level we all like to be scared,
it would help explain the popularity of the horror movie genre.
Zero Hedge )
However, hopefully we are all aware of where this ends,
in a recession and new bear market – this story is old
but it goes on.
Now timing that, well that is the very difficult part.
Have a good weekend folks.
Allan – if you are reading please chill, peace of mind,
happiness, family and relationships are way more important.
Perhaps an internet free few days may be a good idea.
I am speaking from personal experience btw.
John LI
I was referring to the China A50….
And yes, it looks like the trading clamp down in China has rocked China and Europe….although it is impossible to say ofc.
J
I wonder if there is some frontrunning of this news…
Re DAX, it looks maybe like 11650ish is on the cards but possibly not today. I am not shorting it due to not seeing an obvious place to put a stop other than above 12040 – which is a bit too wide for my liking right now. Closed A50 short position, and just waiting. Japan long was stopped out for all of 6 points profit earlier in the week.
Not sure at this stage whether I will open new positions before the weekend, although I may have a look at a Dax long depending on price movement and how US exchanges finish.
imho
J
In a larger picture scenario, I would think that it would be healthy for the DAX to take a peek down to the 200 at some stage – although that is more than 1k points down right now…..and is probably not going to happen anytime soon!
J
And the comments about an April sell off definitely not going to happen, well – I guess it depends on how you define it and how far it goes…:)
On the subjecxt of SPX, the 2092 and then 2082 levels are ones I am looking at. Again, not shorting this because I can’t see a stop within a reasonable distance right now….
J
I don’t see much chat about the USD – sorry if I am being short-sighted and I missed it – looks like we might have put in an interim top here. Huge monthly retest sell on USDCHF that has entered. Similar pattern on the DXY.
Any dollar bulls, thoughts? Jonathan, you about?
ultra, yes it does look like a temporary pause. The top in
Ooops fat fingers here….sorry. I’ll start again.
Ultra, yes it does look like a temporary pause. The top in EW terms was a 3rd wave. So we are now getting W4. These can meander and waste time but usually retrace about 38% of the waves 1 through 3.
Interesting take. Look at the 5-6 hour. Very clear 5 down, 3 up… 1-2-now 3…?
EW low down on my tools list, but cool when you see a pattern like this anyway. Riding short for now.
The long dollar trade is now the most crowded trade in the history of money.
It will, therefore disappoint the most people. That’s just how it works.
I am taking profits and standing aside for now. I got stopped out of my short DOW before this sell off but that is O.K. as I put on trades elsewhere that I just took profits on. Time to stand aside and take a fresh look.
Grexit very likely one of the next 4 saturdays. Watching that is going be funnier than any three stooges movie.
Greece may default, they then will have no need to Grexit at all. Media myth that is.
I know I said that there was a Pack of wolves coming but honestly I didn’t expect this!!
The decisive break of 18000 on the DJIA is what I’ve been waiting for…..but now it’s moving so fast that I can’t find a decent entry point.
One must be careful what one wishes for eh?
Purvez, if you are looking to go long, watch 825 and 730 for starters. Below 730 odd its way down to 490 possibly…..of course this could reverse at any time but I think QQQ could retest the 100 level (I am short) soon so maybe hold off a bit or wait for a momentum move to the upside. imho, use guaranteed stops….
J
J, it tested 17825 and has bounced a bit. Not sure where you get the 730 level though? I can see some congestion around 755 and then down to 560 which is the beginning of April low.
You are talking about the DJIA?
I suggest look for signs of extreme emotion where trades can be triggered.
I bought SPX 2,081. I can be wrong. Traders’ edge is to fade emotion extreme.
I just re-read my earlier post and I think I may have given the wrong impression. I’m not looking to go long. In fact I’ve been ‘scout’ short since my ‘Pack of wolves’ post last night but I need to increase my position and am looking to see where to do that.
If this is the wave that I’ve been tracking as an Expanding Ending Diagonal then there is still some way to go downwards.
However now I check for NYAD, NYUD, etc as per your tutoring Newt. It definitely gives me another perspective rather than just the EW wave.
Newt, finally, we have a drop on the $NYAD to below -20. that means stop holding.
Ratio between the advance and declines issues stands at 0.1663 which represents very strong sell pressure in the region where price had bottom.
Scout long position just initiated. If sell pressure intensify into week below 0.10. The mother of all buy!
Pulp. $NYAD (cum.) is back-testing its break-out which is very healthy if your are long. Watch if it hooks (up), the next buy signal…or course, it can fail. Good luck!
Steve T, I notice your comments a couple of days ago thinking we hit new highs in May. I am thinking the same thing. I was wondering if you have any charts or analysis that you are looking at to show this? Thanks
Zenyatta000, here is a chart of NDX dated Apr 9 that shows the declining consolidation channels nestled within the dominant primary rising uptrend channel. A breakout upwards from the blue resistance line would likely extend up towards the upper black resistance line, which appears to occur in May (if it is to do so).
Here is chart of SPX dated Apr 13 and similar to NDX except it appears to be forming consolidation diamonds instead of channels nestled within the dominant primary rising uptrend.
Sorry for the double post (trying to avoid the comment moderation delay)
Sorry Purvez, I meant 630 and yes Dow.
J
Newt, you have been on fire, great calls so far this year. I love your analysis. I was wondering if you made out with the short SPX? Any target you are looking for in SPX 2081? Thx
Covered my short. My system allows me to trade what is in front of me. I don’t set a target because targets cause bias. Bias doesn’t allow a man to see things clearly and act with humbleness.
My tools are probably the closest real time things that depict mass psychology of only the participants.
More often trends are there to be broken. I look for extremes. Constantly calculating risk/reward.
Good luck.
Watch is $NYHL goes below the zero-line in the coming dates. If it does, shorts take over control.
My scout trade (long) will be validated next Monday if my indicators hook up. If not, more “bargains” are coming.
PS. I have to be more carefully in crafting my posts. Too many grammatical errors. Sorry folks.
The DOW is in a bit of a precarious position today – it has broken a trendline *tentatively*. If it doesn’t reverse and shows weakness over the next few sessions we may be going to have a look at the 200. If going long today, use guaranteed stops imho. The SPX is still holding above its trendline so that may be an encouraging sign.
J
To that point, the Trannies have huge support at 8600 but have been showing relative strength for some time. Question for the board (that means you as well, Allan, come on back), is this a lagging or leading indicator in this market?
Roger that. Great observations jegersmart.
WEAK relative strength, I meant to say!
With no positions on and flush with profits (that greatly exceeded my recent loss of being short DOW futures that got stopped out with a lowered stop which now looks foolish) I am looking broadly for a non-stock or non-currency trade to do. Low and behold, it looks like that Cocoa futures are setting up for a “third of a third” decline from an Elliot wave point of view. It is “thirds of a third” that Ellioticians have wet dreams about.
European and American quarterly grind data are both lower than a year ago and there are predictions that Asian grind data will also be lower. If so, then those particular fundamentals agree with that Elliot wave count potential. What would be needed now is not crop declines, and better yet, crop increases for Africa’s “second” (and usually smaller) mid-crop harvest to really get Cocoa futures going south. Decreased Demand (world wide) with Increased Supply means falling prices per Econ 101.
Richard I, I marvel at your and others ability to handle more than one or two markets. I struggle with getting to know intimately the one or two that I trade. I look at other markets for confirmation of my thoughts but I can’t begin to put money on them.
Must be my 2 brain cell limitation I guess.
That is one of the advantages of understanding Elliot wave patterns. Fifteen years ago I had EWI’s services for two years but haven’t had any of their services ever since. However, I did learn and it stuck with me. Many if not Most on this board are familiar with Elliot waves.
being flush with profits is always a good thing…..haha
S&Ps Triple Top remains in place… the “Nicolas Contra-indicator signal” is working perfectly!
I can also see an IH&S at play where the right shoulders are getting smaller and smaller.
Yes, it looks a bit bearish right now but hopefully our CB pals will save the day for the 32nd time since October 2014?:D
I have no index trades open at this stage fwiw.
J
Just bought FCX. This is a next generation buy dedicated to Messrs. Valley and Isaacson. Thank you.
Good man. Good men!
J
Biggest loser, Valley for giving up 2% on leverage RUT investment in one morning.
Reasons for trade: perigee, rising tides, new moon, cross equator moon, price seemed right.
Reasons for trade going wrong: no idea.
I feel your pain Valley and I’m sorry to hear about your loss.
Is there anything you can develop in your trading discipline which provides for a ‘get out’ clause?
I am out, except that the loss occurred during the overnight session.
Aah yes, perhaps a futures account then?
Valley,
There is little that can be dine on some trades in which you go to bed in the money, but wake up under water. I like your Lunar Cord approach. However, please consider diversifying your a cords a little more. Currently I believe they are too highly correlated. For example, consider Pattern Analysis. There was a poster here last summer, Peggy, who used 7442 Analytics, which has a very good pattern profile manual – BIOS. Complicated and very very detailed, but effective. There was a patern that would have screamed Exit the indexes yesterday on the close. That said, I believe that your (and Andre’) research has been a real contribution that I have incorporated into my approach – I appreciate.
Steve,
appreciate your input on the BIOS will research this. Peggy’s spiral when I correlated it to tidal cycle was directly correlated. The spiral was a graphical representation of the max min tidal cycle of each month. Tidal cycle is highly correlated to market moves based upon back testing. Problem is tides are not alone there are also moon phases, apogee/perigee, declination which each effect the tide yet have their own spin or price characteristics. Also seasonals are to be considered which vary with sector but are pretty much correlated to SP500. And then there is planets Venus and Mercury which seem to have a particular effect on markets. Mercury has conjuctions which are to be avoided a few days before and after, Venus conjuctions tend to be dramatic sell offs with outsized gains following inferior conjunction. Putting together all of the indicators into one working system, tides, moon aspects, seasonals, and planetary aspects is what I am interested in. Doesn’t work every month, January up 4%, February down 4%, Mar up 10%, April so far down 5% and what is missing is something like BIOS which gives signals. will try to figure out BIOS tho’ last time I couldn’t. Thank you.
By the way, next week Lunar Chord:
Perigee: post perigee weakness until Thursday(perigee plus 4 trade days negative)
Phases: New moon strength until Wednesday
Declination: post equatorial weakness all weak, esp far North on 23rd
Planets: post mercury superior conjunction weakness has ended
Seasonals: very bullish (5th year, preelection, first month of quarter, etc)
Price: seems bearish to me
Valley,
Thanks for the info. Also, I am making a distinction between the BIOS chart patterns, and the Spiral (which to me is very complicated) which I can see would indeed be related to tides,…
SC
I keep on thinking what the best traders like Paul Tudor Jones would be doing today (trading-wise).
Newt, my guess is that if PTJ was ‘expecting’ the downturn then he would be adding to his positions, otherwise he would have been out pretty early on and waiting to see what develops next.
I’m suspecting that is what you are doing too.
Newt : “My tools are probably the closest real time things that depict mass psychology of only the participants.”
Yes you are absolutely right, although they aren’t the ‘only’ ones. Price which is the derived function of your tools is the ultimate arbiter and therefore I believe EW is ALSO a good tool because it is ENTIRELY based on the waves created by Price.
EW waves allow you to narrow down the probability of the actions to come….BUT combined with your tools it becomes much more powerful.
My call for a ‘Pack of Wolves’ yesterday was emboldened by the ‘hook down’ in the NYAD cumulative line.
Good analogy. Bulls are wolf chow.
Yes. Captain Hook.
CCI(272) says don’t worry, be happy…if you were long.
Does CH reference have several meanings? If so could you mention all possible meanings so I can get the joke? CCI(272) what is it? Why does 272 mean hakuna matata to the longs?
I just went short SPXU a few moments ago. Big red candle portends more down, next week tides are down, new moon strength waning, perigee post days are weak. So if CCI(272) is bullish I want to know how to use it. By the way, the NYHL indicator crossing zero has in the past corresponded to good entry points in this bull market. Why does it now show good exit point?
Valley, what’s your timescale on the SPXU. We are already down quite a lot so we have to expect some ‘up’ waves. I’d hate you to lose anymore.
The next ‘up’ wave (which is the MOST likely wave right now given today’s action) could easily climb to 2090+.
If you are happy to live through that draw down then that’s ok.
Longs are defending CCI(272). It is holding above 100 for now. A dig below 100 would be a confirmed sell signal.
$NYHL drops from + to – is a sell signal when shorts are beginning to control the market. It is at +39 so the “officers” who led the bull charge have not given up yet!
With $NYADV:$NYDEC currently standing at 0.18. The edge goes to the longs.
I see a H&S at play.
If the DAX don’t stop soon we might be looking at 11400 next week……it held 650 for the close, but it is down now. Will the US markets have a strong finish….?
J
If the DJIA makes another low below 17740 today then I’ll ‘hedge’ my short with a long after a 5 minute up candle develops below the low.
Of course the wave could extend further but I’m travelling over the week end and through Monday so best to hedge as it’s not going ‘MUCH’ further down before retracing.
I may regret this but given my circumstances of travel I’m going to hedge my short here at 17778 and wish everyone a good weekend.
The reason for my ‘change of mind’ is because I won’t be able to place a trade between now and close of play.
Thanks for your EW analysis. May cost me another 1-2 % but usually sell offs come in 2s or 3s and so would expect risk to reward to be on the short side for another few days, with falling tides next week as support to down side.
Just bought some coal stock. Counting on Repubs to stir up thoughts of a reverse in environmental regulations during campaigning. Plus they pay dividends.
Keeping score… here is how gold Stocks are doing since the low last November… up 20.37%. If one goes back to read the comments that day, the bears were predicting much lower lows for gold stocks and gold.
Now by comparison, the “Nicolas Contra-Indicators” were saying to buy the S&Ps… the broad market is up only a measly 2.85%.
By listening to these fools the past few months, one would never know that gold stocks have outperformed the broad market by more than a multiple of 7 (SEVEN).
[IMG]http://i61.tinypic.com/2eq8dh5.png[/IMG]
I hear you re gold bugs, and as previously stated I am invested considerably for the long term. BUT, please don’t massage the numbers and compare like for like….the SPX from a low of ca. 1825 and yesterday at 2210 is around 15.5%…….
Naughty, naughty boy…..
J
November 4 was the bottom in Gold stocks and Gold… from the perspective of a trader that buys bottoms, and who reads stock bulls predicting lower lows on that day, there was no “massaging” of numbers… just stock bulls that missed out still defending their erroneous view point that gold is destined for lower lows.
Now just imagine if you a trader that actually bought over-sold bottoms and sold over-bought tops… you would have made a multiple of 67 times what the “Nicolas-Contra-Indicators” would have made.
I don’t get it. You compare the absolute low and high against an average of something else for a similar period?
At least be fair. I am on your side here, but seriously…:D
J
Perhaps you haven’t read the comments on this board when gold and gold stocks were posting lows… most comments were very bearish (and many still are).
The point of the charts was to demonstrate that because the gold stocks sector is much more volatile than the others, it is in fact a much better trading vehicle.
It is also to point out that instead of being “invested considerably for the long term”, you might consider trading at least a portion of your portfolio in such a volatile sector.
Here’s a simple chart that indicates when gold stocks are over-sold and when over-bought… The chart also shows (as did the others) the profit potential as compared to the S&Ps… seriously.
William, I think your last name says it all.
Speci(e)ous… I think you you misspelled yours… your posts certainly prove so.
Hi William,
Thanks. But my moniker is the only kind of money mentioned in the constitution, gold and silver specie.
With an Advance vrs. Decline issues ratio of 0.16 when the low of the day was made on Friday, the easy money (on the short side) has already been made and the risk/reward started to shift toward the longs who dare to initiate a position.
For shorts to make money going forward, they need more fear. Would more fear come? Trading becomes more difficult.
If your system and tools have an edge, your order will be rewarded but your process must require you to calculate risk/reward before an order is placed.
The rest of the trading game is about emotion control. Mrs. Market is very smart and often suck you in at the wrong time and wrong price, especially right after you have a “regrettable” trade.
I hope all is well with John Hampson.
I have a small long on the DAX from last night just in case. We will see.
J
Friday, June, 2015, US dollar index futures held up on a trend line (12/16/14-04/06/15) while the DOW held up -again- on its 100 day simple moving average. With the trend that both are rising and falling together raises the odds that both will rally back up from these technical supports.
Even though I was expecting a C wave lower in the USD I went ahead and took profits on my currency trades just like I might have done if I had still been short the DOW. I expect both to bounce early this coming week then to re-evaluate if I want to re-short either or both.
If the DOW rallies, once again, from its 100 day sma, implies that the BTFD crowd are still dominate and that the Bull trend is not over. Sometimes it is as simple as that.
“If I have to make a choice, I go for a continuation of the down move the coming week.” Trader’s Library Market Commentary
I tend to agree. Red candle Friday was on the 50 DMA which acts as accelerator of moves either up or down. Since the move was down, would expect that Monday the down trend to continue at least a few more days until price reaches 2% below current price.
William Wiser
I know what you are saying, and I agree ffs – except that I think it a bit rich to taker a specific and limited period in order to make comparisons…..that is all.
I hear you, I am invested in gold bugs and all that….ok?
J
Interesting coincidence. Venus Superior Conjunction was on 10/14. Venus then has rotated around to far East in mid June of ’15. Rotates across the sun until mid August will be at exact center of sun in daytime sky. Then continues across sun to far West in mid October of ’15.
There was a big sell off in mid October of ’14 just as VSC was happening which happened also in ’02, ’05, ’08, ’10, ’11. Last waterfall declines of mammoth size occured in ’00 from VSC to Venus Inferior Conjuction, again in ’02, and the ’08 hundred year event traces out the exact dates of VSC to VIC.
So, if we are about to have a wooly decline ala ’00, ’02, ’08 and VSC to VIC is the catalyst for such events, market would decline precipitously from here until mid August. Then phoenix like rise from the ashes for rest of year.
Also, the 1929 sell off made most if its down moves VSC to VIC, 1987 sell off was VSC to VIC, 1994 sell off was VSC to VIC. Historically since 1914 VSC to VIC is mostly down these 11 months cycle, a few are up, and a good number are trending. But the take away is that the real bread and butter for the bears have been during this cycle last 100 years. If you include all data of these cycles I would guess that the average return for these 11 months is – 10%. Given that these events happen every year and one half that would be about 66 events. 66 x -10% is -660%. Infl adjusted the DOW is up 9 fold since 1914. By exiting the market during VSC to VIC (10/14/14 to 8/15/2015) based upon this you would save an avg. draw down of -10%. If you had done this over the last 100 years the 9x return would be multiples of that due to compounding effect.
Andre, front and center,….please…n
Thanks all. New post is out, sorry had no time to write one last weekend.