
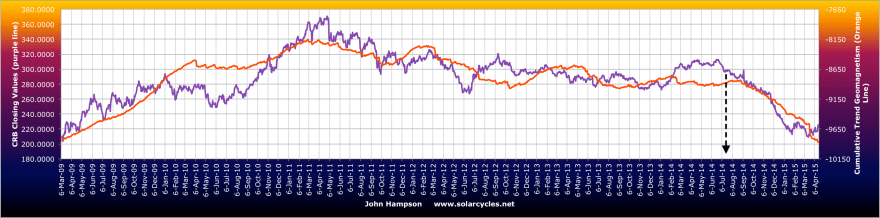
1. The solar maximum peaked out mid-2014

2. Geomagnetism intensified since then
 3. That’s twin negatives for risk assets, reflected in the drop in commodities

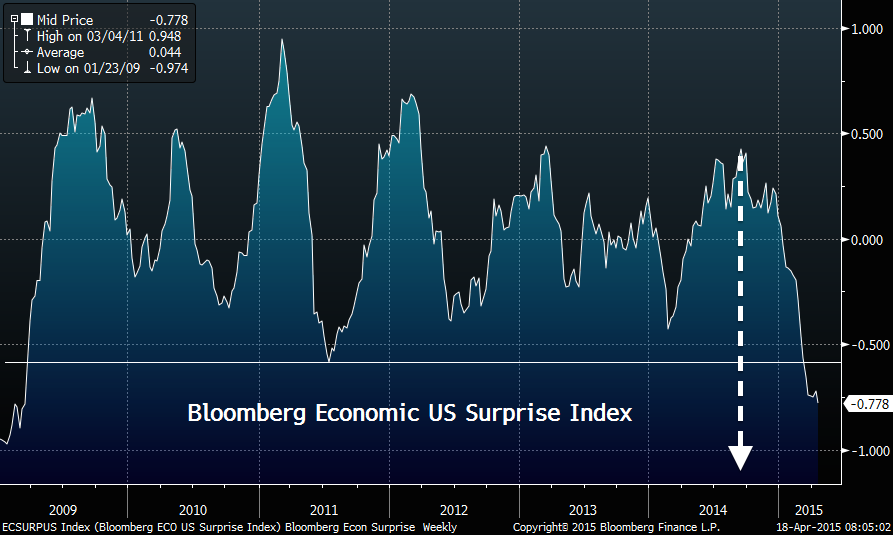
4. It’s also twin negatives for the economy, reflected in data surprises
Source: Charlie Bilello

Source: Alhambra
5. And in earnings

Source: Factset
6. And in Fed money printing
Source: Spiralcalendar
7. And deteriorating financial conditions

Source: WSJ
Source: Bloomberg
8. Although nominal stocks continue to appear to be in a bull market, measured versus bonds and dollar the top appears to have formed at the same time as all the above

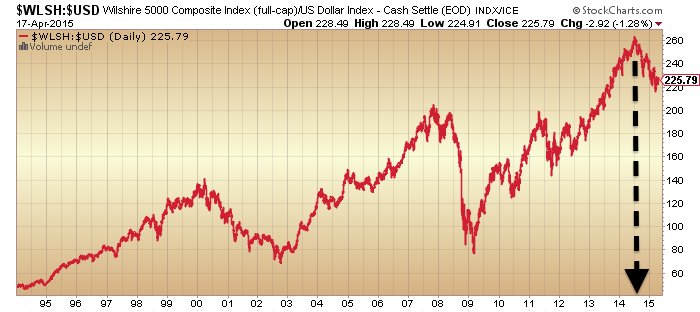
Source: Stockcharts
9. Plus a look at breadth, volatility and risk appetite also suggests a reversal has occurred

10. European stocks appear to be making a blow-off top at high valuations


Source: Gavekal
11. And forward earnings for all the main regions bar Japan (the only major that has a positive current demographic window) are negative
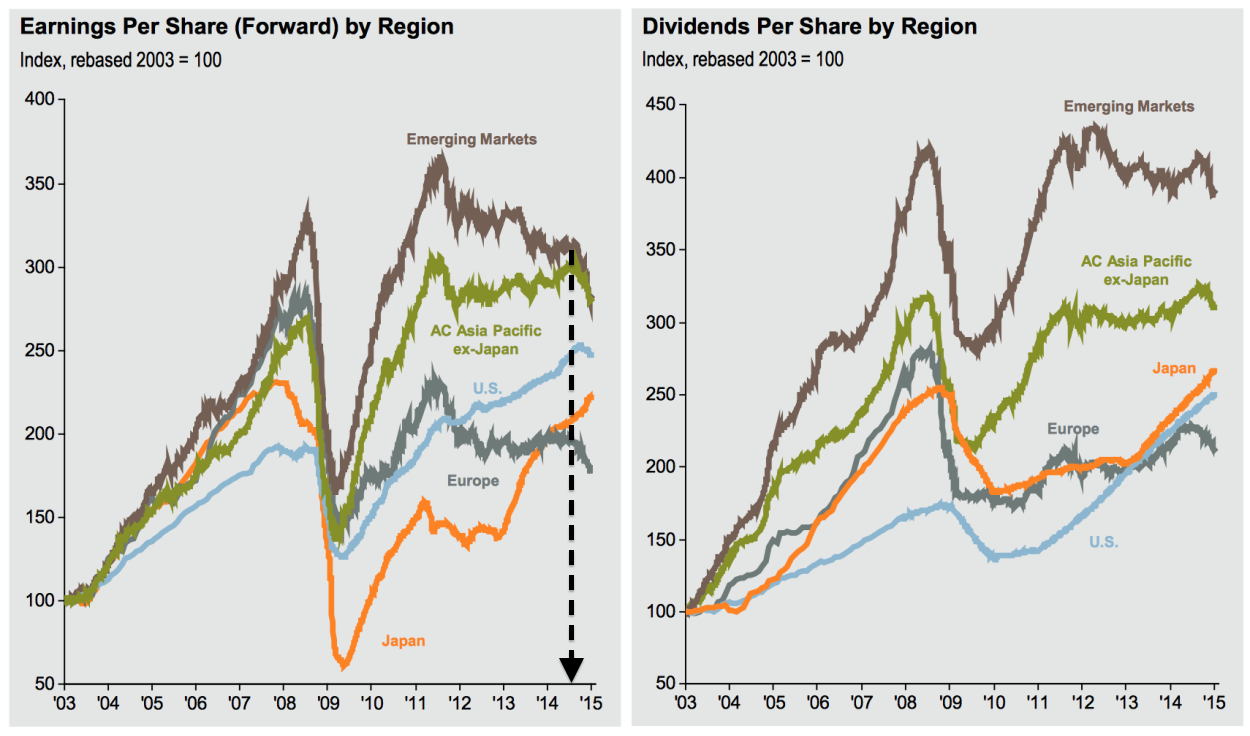
Source: Shortsideoflong
In short, I still see strong evidence for a reversal in financial markets and economy fitting with last year’s solar maximum, with the final piece of the puzzle being the missing sharp drop in nominal equities. Whilst Friday’s sharp down candle serves only to keep us in a sideways price range, it was another failure high attempt in US equities and I expect will form part of the final roll over in stocks, to fulfil what all the charts above are telling us. Sentiment and allocations remain maxed out:

Source: Charlie Bilello
 Source: Stockcharts

Wallstreet made a high March 2nd, 1 td after my harmonic timing date. Last week I posted a fractal analysis based on the 5500 cd count from the 2000 high pointing to april 15th as a significant date. Europe (Dax) made the high on Wednesday.
Us markets couldn’t fall with Europe still in an uptrend. The remaining question – to me anyway- is why Europe kept climbing with US markets already in down mode.
I think it’s the Interplanetary magnetic field. 4 planets drive the imf : Jupiter,Venus,Earth and Mercury. The strongest tidal force on the sun comes when all these planets are conjunct AND Mercury is at perihelion.
February 6th we saw HC Jupiter conjunct Earth. But Venus was still chasing Jupiter to make a conjunction April 25th. And Mercury conjuncts Jupiter April 30th. And Mercury is at perihelion April 19th (today).
I think the confluence of Venus, Jupiter and Mercury at perihelion – all within 10 days – is special.
What does this all mean?
1) From February 6th the Earth-Jupiter pair is showing reducing force.
2) Up into April Venus-Jupiter is gaining strength, Mercury-Venus is gaining and Mercury is approaching perihelion.
I don’t know the net effect of these forces but the least I can say is that up into April 19th we had both gaining and reducing powers, creating a flat market.
From next week on Mercury will move away from perihelion, but Venus and Mercury still moving towards conjunctions. By the 30th all factors affecting IMF are negative.
So I expect the next 10 days to remain consolidating- with a negative bias- into the end of the month and the FOMC meeting april 28th/29th. Then one last retrace before we can finally start that decline.
Significant dates will be April 19th, April 25th and April 30th.
Next week will show a retrace with a low likely Monday and then up into Wednesday, Then a decline into Thursday and some recovery into Friday. The week after that down into April 29th.
With apo/peri down long term – negative for markets- and IMF finally turning down I can’t see what will support this market. After April all forces are down, heading for an end of September/early October low. April 15th may have been the breaking point.
Cheers,
André
Yet another argument for some change is that Venus reached Hidek (21st degree) declination on April 15th (recognize this date?). Today Venus will spiral out of bounds. This should bring more volatility. May 1st Mercury will reach Hidek, adding to the tension. When Mercury returns within Hidek, 5 days later Mars will reach Hidek (may 27th). Mars will stay there until july 28th.
So 3 very significant trading planets all go wild as of last Wednesday. From early may it will get more intense which supports my analysis above,
Thanks Andre.
I am assuming the date you are looking at in late September is focused around the 25th +/- a few days? So now instead of the first swing low in early May you are thinking this accelerates in May?
sopriscap
Low will come between September 21st and October 3rd. Right now I’d say october 3rd. But we have time enough before that to update.
The first swing low will likely come by the end of April. Then a retrace into may and down again.
Cheers,
André
Thx once again for a very thorough analysis. In each post there is always tons of objective info but the 2 outstanding charts for me were ‘equities vs bonds’ and ‘equities vs dollar’. They speak volumes.
Yes, thanks John. Understandably, the focus of the board has been on short-term trading so it’s nice to be able to step back and get a longer-term perspective on what is occurring in markets.
Gary, very good point.
Thanks chaps
Cheers, John, as ever.
FAZ weekly – http://scharts.co/1HH1hSU
Or short FAS – as some on the board have noted in the past, it’s better to short the levered ETFs if you plan to hold for any time due to their trading costs.
You can see also that FAS shows a bearish divergence versus FAZ: the former made a lower high @131.98 as the latter just made a lower low @11.53 – a nice tell.
Retail losing steam.
http://stockcharts.com/h-sc/ui?s=XRT&p=D&b=5&g=0&id=p34645754558&a=227870436&r=1429426553740&cmd=print
Excellent, Niels. I was just going to make a comment on this group. These and the Trannies.
It’ll be interesting and likely an important tell, to see how China’s stock market reacts to this: http://www.marketwatch.com/story/china-cuts-banks-reserve-ratio-2015-04-19-94854558?link=MW_home_latest_news
My long term play—RSX, still holding this bargain and will add on pull- backs until it gets expensive. How about a PE of 5.96% and a yield of 3.99% (March 31, 2015)? RSX is good enough for me.
—-Oil and energy complex. The lesson of history..Dec. 1998, Exxon and Mobile merged WTIC at $16. That marked the bottom of oil until it peaked at $143 in June 2008. Would the Shell and BG merge usher a similar result? I am excited by this news for the long term.
Grek– I will accumulate. At a CAPE of 2.2 (Mar. 1st). No hesitation. A Greek default, even better. A “rebuilding from the ruin” is a powerful and positive mass psychology. Bring it on!
SPX- I am hoping for a complete correction to give me the pounding risk/reward and a sustainable rally. In the meantime, I will continue to trade the short term signals.
My long term outlook is the same as my short term outlook. My system (its edge), my process(discipline and preservation) and emotion control tell me what to buy/sell.
Zen way. Focus on the quality of my NOW because it will become my past.
I am glad that John is well. It ease my mind.
Appreciated Newt
On China CB cutting Reserve requirement the 2nd time in 2 months…. Communists need stability. people don’t make money on real estate anymore? Fine,let them make money in the stock market. Why not a return trip to the 2007 high? Everyone is happy.
I will increase my allocation in that direction. A bet based on China’s constraints, options and reality.
“The size of the cut is more than expected,” said Shenwan Hongyuan Securities analyst Chen Kang.
“It’s going to release around a trillion yuan (in liquidity) at least.”
Juicy? Does it change your outlook about possible global growth?
If this news intensify your contempt for the CBs, you are not playing Monopoly by its rules.
https://news.yahoo.com/china-cuts-bank-requirement-counter-slowdown-093446564–sector.html
Have heard that middle class Chinese are beginning to day trade in stocks again after a few years off. Your view of Chinese equities rising seems likely, but the question is timing your exit? And the daily/weekly price moves are not trending like the ES, more jumpy and seemingly chaotic. Maybe a more time centered approach instead of focusing on price. Say FXI will rise over next 6 months most likely. So invest for 6 months then exit, regardless of what price does. I wonder what Gann meant by time is more important than price?
Valley. Your FCX idea (for example) qualifies for a deep discount China play. In fact, I will add FCX next week.
Hong Kong housing raffle held last week. 1,300 housing units offer met by 130,000 entries. Just 1% chance of getting a flat kind of reasonably priced. Real estate can bounce too given sufficient liquidity.
Just a bet on hope, a bounce can be very profitable when all cats and dogs are bought. Just like the tulips and Webvan -:)).
Excellent summary as always. Thanks to all of the posters on this site who share their expertise.
Cheers Valley
Thanks John. Cycles seldom every “invert” whereas Waves “invert” all the time. As far as I know there has never been an “inversion” of the Solar Cycle. But there are some who claim that a minimum of magnetic strength must be meet for there to be any Sun Spots to occur and that in the next cycle or two that minimum won’t be meet and, therefor, there won’t be any Sun Spots. The lack of Sun Spots does not mean an “inverted” cycle but no cycle at all.
Both Elliot and Delta are wave counting systems that are prone to Inversions of their respective wave counting systems.
In my opinion of the Delta wave count for the S+P 500, the even numbered Super Long Term points are highs as will be the six point solution for stocks Long Term points. This means that I am expecting Delta Super Long Term point number Six to be a high that is brought in by six point solution Long Term point Two. Neither are yet due. As per Allan’s link to Ron Rosen’s page it seems to be that Ron Rosen thinks that both those wave counts will end up with their Evens numbered points as lows and not highs as I think that they are. This is the problem with Wave Counting Systems, they “invert” all the time as “waves” are no where near as powerful as “cycles”. ALLAN TAKE NOTE.
Note: The “rules” of Delta allow for Ron Rosen to be correct –or– for me to be correct in those wave counts but, honestly, no one really knows until some time afterwards. This is the problem with wave counting systems in that they “invert” all the time. Cycles seldom ever invert. Keep up the good work John.
Thanks Richard
About those Retail Sales. The decline in first quarter Retail Sales may only be because of the harsh Winter as the average temperature decline into the coming Mini-Ice Age is only just beginning. This year’s El Nino (Lunar Declinations which has nothing to do with the Sun Spot Cycle) points towards a warmer 2015 and possible 2016 before the cold really comes on to stay and get ever worse from 2017 to 2030.
There is a six month lag between American Gasoline price movements and consumer spending. That six month lag is about now meaning that one of the greatest consumer increases in spending, due to one of the greatest declines in gasoline prices, is about to begin. Should that happen, then it is unlikely that a crash in stocks will occur during the rising consumer spending caused by the prior falling gasoline prices. For Delta wave count followers like Allan it points to stocks six point solution Long Term point number 2 being a high (due 10/14/2015) that will bring in Super Long Term point 6 as a high too. Note that neither are yet due, statistically speaking, and that this is probably the exact opposite of what Ron Rosen (and Allan) is predicting. Inversions, Inversions, Inversions. Oh well….
Mainstream economists may be hoping to see an uptick in consumer spending Richard, but every sign it won’t happen:
http://time.com/money/3763261/savings-rate-two-year-high/
Some are a little to giddy about Greece leaving the Euro. Americans might have a much better understanding that Greece will not leave the Euro due to their Civil War wherein the American South was not allowed to leave the American Union:
http://www.forbes.com/sites/timworstall/2015/04/19/ecbs-mario-draghi-makes-a-dreadful-mistake-over-greece-and-the-euro/
spaceweather.com shows an increase in Sun Spots -and- that a CME is going to hit Earth on 04/23/2015 that could cause an intense geomagnetic disturbance much like the CME on 3/17/2015 did. Note that on 3/18/2015 the DOW attempted to crash only to reverse and rally strongly which was the day after the last CME hit. Should it do so on 04/24/2015 it could continue its rally to a new ATH given the possibility of an inverted S-H-S pattern wherein the next several days produce Candle Stick Tails at the 100 day sma. If this inverted S-H-S pattern holds up then it means that both the Head and the Right Shoulder produced Candle Stick Tails at the 100 day sma and that tends to point towards a significant rally to follow as its “Neck Line” and the February ATH are exceeded. Traders beware….
Hmmm… Talking about Inversions. What if there is a half cycle Lunar Inversion already underway? What if instead of this past Saturday’s New Moon being a high it had inverted and is a low which could by why stocks sold off so hard around the World on Friday? And what if the sudden increase in Sun Spots agrees with the New Moon low (or helped to cause it) and will help to form a base or bottom early this week before stocks explode higher when the CME hits later in the week. And what if all this Lunar and Solar activity is pointing towards a Lunar half cycle Inversion so that yesterday’s New Moon is a low and 14 days latter the Full Moon on 05/03/2015 is a rare High instead of the usual low for a Full Moon? Well…, isn’t in true that highs around New Moons and lows around Full Moons invert from time to time? If so, then why not know given Friday’s world wide sell off and the current Solar -unique dual activity- pointing towards it???
Adding fuel to the Solar fire that a rare Lunar Half Cycle Inversion is underway:
http://finance.yahoo.com/news/china-cuts-bank-requirement-counter-093446462.html
Could be. I would tend to consider that we rose into the new moon in normal fashion, given we didn’t top out until part way through the 17th, with new moon 18th. But the sharp sell off then into the 18th does muddy it a little.
Thank you John for another superb article. Glad to see you are OK.
As you are likely aware I have made the decision to stop contributing toward the forum in part because I don’t feel like I have anything further to add.
My position is one of long term and is at odds with many here and I really feel like I was upsetting tne apple cart, so to speak, by constantly repeating myself.
By now most should know my opinion about the danger of taking market positions on the long side as well as my outlook on gold.
My outlook toward gold is not based upon anyone elses opinion amd that includes Ron Rosen. It based purely and simply upon my own opinion after over 35 years of investing and studying market history.
I made referrel to Ron Rosen because, as I stated, whilst his timing is far from perfect, he pretty much gets the next big move right. In other words, for those wishing to take advantage of major moves over the long term and position themselves well ahead of the crowd, inluding the institutional investors, he should be listened to.
I don’t see him as some kind of Guru, just as a smart guy with something to add.
Finally, from my personal perspective, I always believed and have stated constantly that gold shares would diverge at the final major bottom and begin to outperform early on and that is exactly what is and has been happening.
The likes of Martin Armstrong, also in my opinion was responsible for adding to the mass hysteria surrounding gold right at the lows in both price and sentiment, should hang his head in shame. For I believe that history will show that his hysteria peaked right in line with the lows in the gold sector.
I shall conrinue to read your articles for as long as you are prepared to generously share your mountain of knowledge 😉
GL to all and be extremely careful. I love to see people make money and equally hate people losing it.
Allan, I mean you and Rosen no ill will. The reason I think that so many waves and cycles are being skewed late is because the Elliot Millennium Third wave is coming in several hundred years early.
I am sure hope that you’ll be posting again Allan. You are one of the great one on this board. Always read your posts with great interest and respect.
Thanks Allan
RI. Your logic sounds right regarding oil prices to spending. Issue is there is one thing missing in the equation and that is demographics. In the western world we have the largest part of the population peeking now (baby boomer’s) around age 55 which means retirement and that means saving. Japan’s (baby boom) population peeked during the late 90’s which coincided with their economy melting down and they haven’t recovered from that yet. Their economy got busted as the greatest boom in history was in progress. Germany has the worse demographics in Europe so keep an eye on them. Greece will look like a bug on the windscreen compared to Germany in melt down. China is not much better.
JH. any chance of adding a demographics chart into your summary somehow. I think a lot of people will be surprised. Love your work and Andre’s as well.
Thanks, demographics here: https://solarcycles.net/2014/01/07/demographics-bear-market-global-recession-and-deflation/
Brilliant. Thanks JH
Allan
well done in picking a buy point for gold/gold shares. I for one questioned it, and am the first to say I was wrong.
Reading Jeff Kerns latest freebie, he is a little more cautious now, do you agree? or are you taking a longer term view
I realise that you are talking Australian gold stocks which have benefitted from a devalued AUD, while Kern is in the USERX
Regarding Armstrong I recall him calling for AUD at $1.76 to $2
Saving rates tend to be very long term trends. It sounds like the trend has changed for savings. That is good long term, but devastating for a credit expansion dependent economy until the debt is paid down.
Allan, I for one appreciate your comments and agree with your gold thesis. I am one of likely many who continually review this set of links and analysis and appreciate the uniqueness of the analysis combined with a variety a viewpoints and value added links, charts, etc. Please do not let “the few blowhards” refrain you from your contributions. I for one am tired of the drumbeat of nicholas and his copy , rinse and repeat of long dow, long, dax, short gold w/ nary a single bit of quantitative analysis beyond BTFD!!!! every day the markets are green. if the futures hold up tonight, i will place a ben franklin on his comments before the day ends about all the money he made w/o posting a specific trade.
Why stock market new ATHs are inevitable:
http://finance.yahoo.com/news/why-new-stock-market-highs-are–inevitable-163430906.html
This could be a situation where Asian and American stocks experience a second half Lunar Inversion and European stocks do not. In other words; Asian and American stocks rally up to the next Full Moon while European stocks do the normal and decline to the next Full Moon (May 3).
As the markets come to grip with the fact the Greece will not leave the Eurozone both the Euro and European stocks will probably decline.
Thank you for the terrific analysis as always John. Major divergences short term, no new highs in the transports s and p 500 ratio in over 4 mos now, Despite the big fall in the market friday Vix still below 14 and no new highs in the s and p, vix ratio in over 8 mos.
Cheers
I have added to DAX long from Friday fwiw.
Good luck all.
J
Agreed. Looking for the dax to recover to around 12100 this week. I forsee a period of sideways trending before a bigger rally maybe in Q3 towards my 14000 target. A grexit will probably cause a drop but I’m sure they will avoid a messy exit so the damage to markets will be limited. The euro dollar exchange rate will likely influence a lot so will keep an eye on that too. If the dax can take out 12000 today that will be a rather bullish sign but I think that is unlikely.
A Grexit would be disastrous in my view, so I think it unlikely they will let that happen. I have stops in place, let’s see what happens.
J
Just went long Ibex fyi.
QQQ not feeling the love so far today…..
Jegersmart – quite alot of traders use systems where you trade on 12-50 cross etc. If you traded this system you would be about to sell Ibex rather than buy. Do you disregard this type of system?
Hi pulp
Can I assume you are referring to MA crossing? If so, no, I don’t tend to use those.
J
Please share with us the basis/trigger for your IBEX (long) trade. Thanks.
Hi Newt
In this case it was simply a speculative trade based on the low of the 17th April – that I am betting on today’s low being a higher low just as the 17th April was a higher low than 26th March. Subsequently my stop is fairly tight just below the previous low of 26th March. My stops are not at set distances, they vary according to the price structure (as I see it). This is an unusually tight one because the recent action has been fairly ugly.
The other way to trade it would have been to go short as soon as the price action broke the trendline to the downside on Friday 17th around 0930 UK time, however I had enough short exposure in my portfolio so I didn’t take the trade.
Generally speaking I am a studier of price action so I look for levels where price has tested before and how it behaves. It is one component of a process that I have that seems to suit me at least.
Hope that helps – I am now loosely tracking the position on the 30 and 60 mins charts, but I try to not overthink it. My stop is at a point I am happy with, I usually let these run.
J
Got it! You focus on attacking price action…while I attack the internals..Like there are many ways to get to Rome!
Newt
I am trying to get my head round your way of doing things, I think it is very interesting and could be a better component to use potentially. I follow your posts with great interest to see how I could use it.
Unlike you, I also have price targets in mind (not necessarily to close mind you) – in the case of the Ibex long we could retest the bottom of the channel that we broke through on Friday to the downside (it is sloping upwards quite steeply) and fail but I look for these levels purely to decide whether to close for profit, to add, to reduce my exposure or to add.
This is all a bit of a manual process and takes a lot of time and reduces my ability to adequately monitor many markets let alone many individual stocks so I have certain tools and services that sometimes alert me to setups that I like (and cannot monitor myself), or my old network of contacts that I used to be active with when I was a “professional”…lol.
I have to keep it simple and as safe as possible. I am considering changing my screen name as it is somewhat misleading…….—–> Jegersimple……?
J
p.s. At the moment I am watching 2097ish on the SPX, and may go long if convincingly broken to the upside intraday, however a close below and I will probably short it instead. We just had 2nd rejection just after open, but it is too early to tell in my opinion…..
p.s. to Pulp:
If you could share more details, I am always interested in hearing how you use them – if you do?
J
The concept is that you trade the 12/50 cross overs trading in the overall direction. Use the BB to confirm direction and MACD as an additional confirmation. Once you have made your initial trade you then add to the position at specific percentage up to four block trades with strict SL in place. You close the trade on change of direction or resistance levels. There seems to be alot of false trades but if you hit a good one then its all good.
Wow, what a day ! Congrats to all long again. I told you last week was just a breather.
Elliot Third waves are democratic. The largest wave of any sort that I know of is the Elliot Millennium Third wave and I am of the opinion that it is topping and peaking several hundred years early. This is “why” the world wide CB activity that is helping to support stock markets around the world and “why” so many other waves and cycle tops are being skewed so late as they all average in with the early top of the Elliot Millennium 3rd wave. Enjoy it as the peak could be very high in price and last for several more months.
I still contend there is one more surge in sunspots remaining where all participants will blow their load. (See sc 16 vs 24 analog in previous post comments)
Pulp
sma/ema? time frame?
Thanks
J
May I charm in just for fun? Bill Williams has an Alligator Indicator set-up calling for 5/8/13 SMA.
To me, the indicator is too slow as a trigger. Also, it has a very poor edge during a period of narrow trading range.
only in the 4hr time frame 12 & 50 SMA. You can use lower tf to verify entry.
Just to add..if you wanted to watch the expert explain – you can watch Scott’s video which is in the public domain: https://www.youtube.com/watch?v=3e9_p3vvzhk
NDX daily. If you went long futes yesterday on a sub-daily basis, well done to you.
Daily basis short got stopped out for a small profit: http://scharts.co/1aWIWof
Inflection point:
http://stockcharts.com/h-sc/ui?s=$NDX&p=120&b=9&g=5&id=p55254865877&a=403575808&r=1429546709170&cmd=print
Hi Pulp
Thanks for the clarification.
J
Today’s bounce seems to have changed little except for shorter term traders.
Biotech’s aren’t participating, greek banks are still falling and miners are ignoring the drop in gold and silver prices.
The resolution of the parabolics in biotechs and the dollar as well as the greek situtation are still the most important things i am watching
Lunar Chord:
Bearish all week, esp. bearish Thursday and Friday. 150% short in SPXU. (1/2 of portfolio in 3x inverse etf = 150% short.
(Tides falling, new moon green period ends Tues/Wed, post perigee, declination nearing North)
I love your conviction. So i take it you think this is a counter trend bounce before we head lower this week.
Yes!
I added a half weight FTSE long into the mix. The index lagged a bit today and as I am a bit bullish resources as well as Europe in general held up very well after the explosive start to the session I think it is worth a go. Stop below recent low.
J
$NYHGH:$NYLOW is showing a higher low. Up-trend channel intact since Oct. An overlay of 5 EMA is a buy/sell signal. Look back farther you will see negative divergence before price rolled over and give you nice short signal (in conjunction with other tools). This indicator keeps you from (excessive) fear of the market. Have fun playing with it.
Both $NYAD and $NYUD (cum.) are showing a successful back-test of its up-trend.
Market hesitation continues?
This has been an excellent guide to overall market direction. Thanks, Newt.
From nothing more than a practical point of view there are too many stops tightly compacted above the market for the DOW –not– to trade up to a new ATH. Shorts beware.
Today’s rally in the S&Ps was only a bounce that came on the news of China’s reserve requirement cut… expect to see the selling reaccelerate tomorrow and drive the S&Ps right back down to a new low for the move below Friday’s lows. Bull beware…
I don’t know WW, it looks pretty strong to me right now. I cannot short it now unless it fails to make an ATH or breaks 2072ish on a close….I am not going long either though, although more likely to go long above 2085 on a pullback……
imho
J
Shorting a price failure ( such as below SPX 2,072) is advisable per my system only if the market internals also failed. Otherwise, it could be a painful trap.
On the opposite of the same trade, longs must know their odd when buying a price “Support” or they shall catch a falling knife.
The juiciest short is shorting on a marginal new price high on sour internals when your risk is lowest. This condition will come in the future.
be aware of our directional bias if it is justified by evidence. Otherwise, gut feel can kill profit.
FWIW, my QQQ short got stopped at 108.26 this morning on open for a loss of some 160 pips, and I have gone long PHAG just now with a tight stop.
I haven’t added further to DAX and IBEX longs.
Good luck all
J
IBEX long closed just now. The recent spike downwards could be a warning shot….
J
Closed half my dax long at 12050. Didn’t quite reach my target of 12100 to close the rest but it should come later this week. This rise is exactly what I mean about sharp falls being reversed equally sharply.
Daily setup on FAZ/FAS: http://scharts.co/1HqBHBg
Krish
Gratz on closing within 30 points of high today. I thought your target was 14000 though?
J
Yes but I want to reassess and Re-enter when this recent volatility has calmed down. I entered at the wrong time for this trade. If I had got in around 11800 I would be holding out for much larger gains. Europe is overvalued but my trade is based on the fact QE will continue to drive stocks higher and not on the fundamentals. No doubt we will get more volatility if the Dax climbs towards 14000 as the gap between price and fundamentals grows. I prefer to swing trade as it rises so I can capture more pips than a simple buy and hold Strategy.
In the next 24 to 48 hours both a solar wind stream and a CME are expected to hit the earth’s magnetic field. (Shorts beware.)
Hi all ! Looks like this will be another great day for longs. The new chinese stimulus is great news for the markets. I would like to see the canadian central bank do some QE now to drive the TSX higher.
Sorry but I need to say it again: great job by the world’s central banks, Pretty much everybody is happy when stock markets go up.
lol… Quite the comedian – posting for comic relief purposes.
It’s difficult to develop real investment plans in this environment when most are simply reacting to CB moves and low volume overnight futures moves are often reversed.
Market is chasing its own tail. I should do something else until the condition is resolved.
Are the Shorts being “set up” for a squeeze play?
Did that not already happen?
They’re going to keep squeezing until the pips squeak!
(Then we can crash).
Longs lacking energy but have not given up yet!. $NYAD is still rising. Advantage– longs.
“another glorious day….filled with rainbows and unicorns… all that glitters is gold so you should short glitter.” latest excerpt taken from Sir Nicolas wonderful contributions to this thread about technical analysis. almost as valuable as mine.
I amount of all the DAX longs, it amounted to 17% gain pus it is starting to feel a bit “crowded”….
GLA
J
Sorry, it should read 9% gain above, I am also out of the FTSE long for now.
J
It should also read ‘I am out’.;)
Just sold some FAS.
Stopped out.
I am back in with a half weight DAX long some 84 points below closing earlier. Again with a tightish stop. Wonder if the weakness the US exchanges are displaying right now will be bought up into the close….
We will find out…
GLA
J
More All Change at the Solar Max. Real estate peaked 15 months ahead ot the stock mkt peak in 2007 and 18 monthhs before the Great Recession officially began. Fred Foldvary predicted in an article and a monograph, the Depression of 2008, based on the 18 year RE cycle and the depression begins two years after the top in RE prices (Jun, 2006). Based on this, I have taken special note of Chinese RE peaked in Aug, 2014. So I looked up US RE, guess what, it peaked again last year – 2014.
In addition, QE worked in Japan over the last 35 years when they were doing it. The ecomomy grew slightly, inflation got up to 2%, and unemployment fell. When they quit, the momentum continued for about 9 months to a year. Everything fell off the cliff after that. Well, we stopped QE about 7 months ago. Therefore, more information 2014 was a peak year. The follow on effects will be hitting hard this year and next.
It looks like crude is rolling over and it means last low will be retested saying at least. My target is 32-35 for crude. SPX not at final high yet but should test 1980-2000 pretty soon. Gold, when it finally succumbs to the selling pressure should visit triple digits or at least 1020.
I have gone Long American Grain futures. It looks like that Wheat, Corn, and Soybeans are all setting up for Elliot major 3rd waves higher. It looks like that Corn was holding them all back and that Corn is making a “Truncated minor 5th” of a C of a 2nd wave correction. If so then all three will start soaring higher in Elliot major 3rd waves.
Most on this board ought to be interested in and be knowledgeable about the coming Mini Ice Age given the interest in planetary bodies. Only an El Nino, due to Lunar Declinations, could hold back the ongoing plunge into the Mini Ice Age for 2015 and maybe 2016, but, But, BUT, that is conditional with the Pacific Ocean having any heat to release. The last two SCs point to little heat build up for the Pacific Ocean to release with this year’s most powerful El Nino of the 18.6 year Lunar Declination cycle.
“Rain makes Grain” is a presumption that the Grain is already grown such that the rains wouldn’t adversely effect it. But right now the rains are flooding many US Corn growing areas that look to prevent planting of Corn this year. Soon, the Large Specs will start to figure this out and reverse their heavy shorts and go long. Those Large Specs probably don’t know about the fact that the Earth is trending into a Mini Ice Age given all the political hoopaly about global heating. This means a trading opportunity for those on this board who are educated and open to new ideas and have futures accounts in addition to stock and forex accounts like I do.
what evidence do you have that supports the notion that the earth is about to enter a mini ice age?
Robert Felix “Not by Fire but by Ice”. “Magnetic Reversals Evolutionary Leaps”.
Confluence of cyclical patterns lined up now for Mini Ice Age. Mr. Felix is a retired architect, and business man self taught in geo climate history and presents quite a compelling story of why a mini ice age is probable soon. He has hundreds of interviews on youtube if you are curious.
Start with “Cold Sun” by John Casey and go from there.
Biggest of big picture items. Thanks for this info.
Shorts beware:
http://www.bloomberg.com/news/articles/2015-04-21/short-selling-herds-finding-april-is-the-cruelest-month-since-2009
Because I am not positioned in stocks at this time I might be seeing the situation with a clearly view than most. Question: Why is German and other Northern European government debt trading with a negative rate of return? The best reason I have heard is because of the belief that the Eurozone will dissolve. In my humble American centric opinion I think that the Eurozone has as much a chance of dissolving as the American Union has of dissolving. That being said then what will happen when those debt instruments rally up to a positive rate of return. Won’t it mean a rally in the Euro currency too?
Half the revenue of the American S+P 500 companies comes from outside the USA. Should the Euro rally, due to rising Northern European debt instruments, the US Dollar will fall. Should the US Dollar fall from the current heights then the foreign revenue of the S+P 500 companies will improve, IF, and I said “if”, American Consumers finally start spending their savings from low gasoline prices “then” the revenue of the S+P 500 companies would increase from both inside and outside the USA –at the same time. Then, shouldn’t a rally to new heights also occur to the S+P 500 companies too? (Allan: Delta stocks six point solution point number 2 is a High that brings in Super Long Term point number 6 as a High and not both as Lows).
O.K. So Greece doesn’t leave the Eurozone and the Eurozone doesn’t dissolve. OMG, but what if Greece defaults? So what. Back in the 1830s six American states defaulted. Don’t worry, when Greece defaults, and it will, this historical point will be all over the news to calm panicky investors and to burn the Shorts really, really, bad.
As an American I assume you’ve not heard of Spain (and their impending election)?
Nor Italy, Portugal or France?
They’ll all follow the Greek route, mark my words. Not quite such piffling sums involved.
Frank Holmes on Kitco said recently that the oil price decline effects lag by 6 to 9 months and will begin to be effective now especially in EEM in which energy makes up larger portion of the economic expense. Countering this: 1. the “shemitah” meme which promises 7 year bear market this year, 2. the too strong dollar which while attractive to outside investors must be held back to conserve US multinat’s profits, 3. normal rotation thru intl. equities, it is EEM and EWG turn to shine after US has been leader 3 + years, 4. demographic headwinds.
I am expecting a irrational rally during the next 2 years in US equities and an equal sized bear market following based upon Saturn in Sag (1986, 1957, 1928 etc.) but am going to try to trade bidirectionally.
Valley,
Thanks for all your messages.
Only question I have is why you expect 2 years rally in US equity? Because as per Shemtah we may see strong decline in equity in Sep/Oct 2015 based on historical precedent (2008, 2001, 1994, 1987, 1980.. so on) AND secondly, If we assume SC24 mirrors SC16 we may see TOP in US equity around Sep 2015. Any thoughts?
Saturn opposition May 23. Expect no net gain till then. 2 months after May 23, 2 % gain per month.
valley,
Are you still short? We have a bradley turn date tomorrow.
Yes, 150% SPXU. Until Friday, unless I can get 2 to 3% then will exit.
Bradley is 4/28?
Northern European governments are being paid to take money from investors because the investors believe the Eurozone will fail and that those governments will not fail but are the best keepers/holders (even better than the banks) of their money. When that belief ends then those government debt instruments will stop paying a negative return but a positive return and the Euro will rally thereby.
The emotional change from extreme pessimism of the Eurozone to extreme optimism combined with optimism spreading to many other societies as all their CBs try to simulate their economies should result in outsized gains in multi-national corporation’s profits. Add to that increasing US consumer spending and up, up, up, will go US multi-national stocks.
I am of the opinion that the Hope of all this happening is what is keeping the markets from panicking –at this time. This Fall will be a different situation.
Why would the Commercials be carrying the greatest net short position of the US Dollar in all history if they thought the Eurozone was going to fail? Isn’t more likely that they expect the Eurozone to hold together and, thereby, that the Euro will rally due to German, etc., debt reversing and paying a positive return?
To make the claim that the Eurozone is going to fail and break apart is to also make the claim that all those Commercials are wrong about the Eurozone holding together and lasting through this “crisis” (opportunity).
A coin has two sides. The reason that the Commercials are carrying the greatest net shorts of the USD of all time isn’t because they expect a crash in US stocks and the US economy, no, oh no, it is because they are also carrying the greatest net longs, in all history, of foreign currencies because they are expecting foreign economies all over Earth to revive this summer.
Never in all history have the Commercials been so positive of a world wide economic revival than they are now. This means no possible panic selling of stocks anytime soon.
The Japanese just reported a positive trade surplus for March which is the first time in years. Brazil already reported an unexpected trade surplus for March that was also the first time in many months/years. Looks like the Commercials are correct in expecting a world wide economic revival as is evidenced by their all time net longs of foreign currencies. This is not conducive for a stock crash as this time –maybe latter this Fall.
Bears Beware:

This chart looks like “Bulls Beware” not “Bears Beware”.
Then you need to learn how to read a chart…lol.
Red arrow is pointing down to 2035 level from 2100. Isn’t that a down move?
Gold has been held hostage to the US dollar index… likewise, dollar has been supported by the strong stock market. The idea is that as the stock market continues its downward trajectory (having already recently topped), the dollar will be pulled down along with the stock market (and as a consequence, Gold will continue up).
So to help you understand, here is a chart of the dollar created yesterday… you can see the anticipated C-leg up to complete (ii), before leg (iii) down… does this help?
So far so good… the Contra-indicators got fooled by the bounce in the dollar and stock market. Appears others are confused. Now we watch as the stock pull the dollar down and gold continues up from its bottom from last November. lol
You seem to be on the same page as Harmony Rainbow (Nicolas).
I wonder what you think of AU and the miners in this sector? Will they thrive in this new economic expansion as new wealth could increase demand in the love trade esp. in asia.
Thanks you sincerely for your explanation of one possible (and imo probable) scenario for next 2 years of equity markets (1929 redux).
“same page as Harmony Rainbow (Nicolas)”… you seem to be thoroughly confused.
anyone on this thread put much stock into bradley sideograph turn dates? hit some pretty accurate major turns in the market in 2014.
Analysis of Potentially Powerful Upcoming Turn Dates
Of the Turn Dates mentioned above, some of the most effective could turn out to be the following:
May 10 – On this Turn Date there is a significant turn in both the Bradley Siderograph and the Declinations, so this could be an especially strong turn date.
May 24-25 – There are significant turns in the Middle Terms and the Bradley Siderograph back to back, so this could result in an especially strong Turn Date.
August 27-28 – On these two days there is a turn in the Long Terms (100/100 Power) and the Middle Terms (14/100 Power), which could combine to produce a stronger turn.
October 9-10 – On these two Days there are very strong turns in both the Middle Terms and Declinations, and this could result in an especially strong turn.
http://bradleysiderograph.com/2015-turn-dates-sp500/
May 10th is a 100/100 power declination day. i’m thinking aapl earnings help drive marginal aths with a 5th wave to 141-146 post earnings before falling back to 119 w/ the rest of a market sell off. aap is 4% sp500 4.75% of dow and over 10% of the qqqs.
What is a power declination day?
valley, if you are interested, check out the link i posted and look at 2014 bradley turn dates and the explanation. i am no expert but it involves astrology and solar aspects. the turn dates had been posted prior to the major swing high/lows of Oct/Nov 2014 and nailed it.
http://www.timingsolution.com/TS/Mini/5_1/index_1.htm
http://bradleysiderograph.com/declinations/
In addition to the major planetary aspects, Donald Bradley’s Book, Stock Market Prediction, states that the Bradley Siderograph is also based on “the arithmetic combination of the declinations of the planets Mars and Venus.”
What is a Planet’s Declination?
Declination refers to the angular distance of a planet north and south relative to the celestial equator, which is in the same plane as Earth’s equator. Therefore, if you are standing on Earth’s equator, if the planet appears in the north it will have a positive declination, and if it appears in the south it will have a negative declination.
Planets move back and forth between positive and negative declination as they orbit around the Sun. Donald Bradley elected to only incorporate the declination of the two planets between the Earth and the Sun, which are Mars and Venus.
In addition to considering pure movements in a planet’s declination north and south, the following three points in a planet’s declination are of particular importance:
Maximum Declination — When a planet reaches its highest point north
Cross 0 (Zero) — When a planet’s declination is zero and it is crossing from south to north or vice versa
Minimum Declination — When a planet reaches its lowest point south
How the Bradley Siderograph Incorporates the Declinations of Venus and Mars
According to Donald Bradley, “The value of the declination factor is half the algebraic sum of the given declinations of Venus and Mars — northern declination considered positive and southern declination, negative.” It is also important to remember that Donald Bradley used a multiplier when computing the value of declinations for the overall Bradley Siderograph.
With respect to this multiplier, Donald Bradley mentioned that the the long terms and declinations factors “may be given considerably more weight by multiplying it by 3, 4, or 5 times, depending on experimentation.” Therefore, in computing the Bradley Siderograph, one adds together (1) the sum of all the planetary aspects of the Middle Terms and (2) the Declinations and Long Terms Factors increased by a multiplier, such as 3X, 4X, or 5X.
Donald Bradley’s Comments on the Declination of Various Planets
Declination of Saturn: “The 14.8-year rhythm in livestock prices correlates strikingly with Saturn’s declination cycle, as do wholesale prices of food seasons.”
Declinations of Other Planets: In his book Stock Market Prediction, Donald Bradley wrote, “inclusion of other declination or orbital values is being considered as interesting improvements or refinements in the formula, although omission of them in the interim does not seem to seriously detract from the system’s now high degree of accuracy as an indicator of mass psychology. Additions and adjustments will doubtless be forthcoming as the outcome of further research.”
The Declination of Mercury and Microsoft’s Stock Price
Some securities appear to move up and down in relation to the declination of a certain planet over time. An excellent example of this relationship is reflected in the declination of Mercury and the stock price of Microsoft. Since the turn of the millennium Microsoft’s stock price has had a strong correlation with either (1) the declination of the planet Mercury or (2) the inverse of Mercury’s declination. Click on the graph below for an analysis of the strength of this relationship over the last decade.
Declination of moon has such a consistent effect on the markets it makes sense that planet declination would also. Thanks for this explanation of declination.
http://bradleysiderograph.com/2014-turn-dates-sp500/
valley, this link does a great recap of how the turn dates that were posted in the beginning of 2014 matched up w/ the sp500 throughout the year
e.g.
December 17 (100/100 Declinations Power) – The S&P 500 rallied over 2% on the exact same day as this Declinations Turn Date.
The next day (December 18) the S&P 500 rallied over 2% for a second day in a row. This was a very significant shift in the trend of the S&P 500 given that prior to this turn date the S&P 500 was experiencing one of its steepest declines of the year.
2014-12-17-S&P-Declinations
Thanks, Scott. I will print this information and study it. I will try to correlate it to lunar tidal if possible.
DAX half weight long stopped this morning for loss of 34 half points.
11830 might be useful base to long from, however I am just going to wait to see how this flag plays out…..
J
Asian rallied last night and Europe declined. This could be the day that the average American Investor completely writes off Greece and anymore news about Greece and goes from downbeat Europe in the morning to upbeat Asia in the evening which will result in a complete turnaround of American stocks from lows in the morning to highs at the end of day.
This could be the day that the average American Investor and many International Investors have had enough with bad news about Greece and the Eurozone.
Obviously the way that Asian markets rallied last night the Asians don’t give a “rat’s ass” about Greece and their petty problems and neither should Americans anymore.
Greece could go the way of Detroit and I could care less. Cut your losses short and let your profits run. Should American stocks rally strong by EOD then Asia will most likely rally strong, again, for a second day, and a trend just might be underway to new ATHs.
I think Asia and China in particular is displaying hubris. I don’t think Greece even comes into it, the shape of the graph indicates to me that people are just afraid to miss out?
J
I doubt that there is a single person in all of Asia that gives a hoot about Greece defaulting or leaving the Eurozone. Greece means less to the world economy than Detroit does and no one cares if Detroit were to default on its debts or succeed from the American Union.
More Chinese are opening stock accounts than at any other time in history and their stocks are soaring.
You’ve convinced me Richard.
I’ve just sold all my physical gold bullion, and bought into a Shanghai Composite ETF.
Go China!
Detroit has 325 billion in debts????
spaceweather.com Solar activity is rapidly increasing.
My PHAG long was stopped for 140 pip loss, mostly on the sidelines now^^
It is a bit of a wild ride today…..
Just wondering if there is some good news being sold into last couple of days – earnings are good (vs. expectations) but most of these companies price movement was underwhelming…….too early to tell?
J
Hi ! Congrats to all who remained short gold. Well done ! A few days ago Allan recommended me to buy gold. no thanks. I’ll keep my AAPL, QQQ and IBB.
Why would you want to buy gold in this environment ? Can someone provide a good argument ?
As Asian stocks soar Asian selling of Gold could increase. Note that the Chinese are opening new stock accounts by record amounts.
You are borderline to being showboating. Peace.
I look at Richard as my unpaid financial insight provider.
He is a smart man. I appreciate his keen analysis. This man has an edge.
What he is saying is factual and somewhat common sensical, what is more is useful and relevant. Without self referencing or smugness. I find his posts to be the among the most useful on the internet, including McVerry. In fact, his posts are better than McVerry which is mostly inside the box thinking. The breadth of his knowledge is impressive (climate issues, currency, equities, economics).
Gold is oldest form of money. No counter party risk. Selling for cost of production.
Peak gold, finding less each year and costing more to extract. Valued highly by consumers in most rapidly growing economies. AAPL QQQ IBB are by any historical metric high in price. CB money printing has found its way into equities only, eventually will effect commodities including gold and they will double/triple from current price levels.
Hi Valley ! You do raise some good points. However, central banks are buying stocks and bonds, not commodities for the time being. I think that central banks don’t like to see a rising gold price, so i’m sure they will find a way to keep the gold price down.
You think wrong.
Not all central banks are the Fed.
Could the belief in Gold be temporarily disrupted by CBs’ seemingly success in holding things together? Swiss citizens voted in Nov. to not add gold reserve may be telling.
My gut feel (often wrong) says people born after the 1950s don’t care for gold because most of them ain’t got the wealth to care about hedging. Where would gold demand come from when CBs and citizens don’t care?
Am I wrong? Please correct me. Thanks.
All commodities have been reduced in price as has gold. Demographic and cyclic factors have caused this. Richards excellent analysis points to robust growth next few years worldwide. Gold will go along for the ride.
Valley, FYI, gold is in an uptrend against normal commodities (see link).
Richard has produced no good reasons for robust growth, not a single one.
Gold will rise in a counter-cyclical manner for a couple of years as everything else tanks. Then gold will rise faster than everything else being bought as the world loses faith in growth/central banks for a repeat of the 70s (on steroids).
http://nftrh.com/2015/02/26/gold-cci-gdx/
newt, currently gold demand comes from central banks (China, Russis, Mauritius).
In the future demand will come from those seeking to escape paper debts in a rising interest rate/zero growth environment.
Gold rose 24x from 1965-82, I expect something similar starting any time now.
I agree with his opinion because price is moving in that direction, markets have cyclical rotation, europe is largest trading partner of china and east, equity markets in those areas are climbing much faster than US. Price tells one what is happening as it reflects capital moving into those markets. Many reasons not to invest there esp. lack of profits, demographics, and dull economy. The US rally and USD strength can not be totally explained by low oil prices, it was capital flight to US. Similarly, EU market strength next few years may be credited to a credible causative reason.
GM, he does not give reasons for growth. However, when everyone is on one side of the boat (US equities and Dollar), that may be unsustainable. I look at gold as the “wealth” measure and for it to rise real wealth must increase in the economy. I do think it is undervalued somewhat, but what will make it rise will be 20 years of new tech advances and economic development in BRICS and developing world. You seem to be seeing 20 years of entropy and decline, I see 20 years of harmony and cross national integration fueled by technological game changers (AI, Robot, Nano, Materials Science, Energy).
‘I look at gold as the “wealth” measure and for it to rise real wealth must increase in the economy.’
It doesn’t really matter what you look at gold as, the reality is the polar opposite.
As for the next 20 years, time will prove all.
‘Richards excellent analysis points to robust growth next few years worldwide.’
and
‘he does not give reasons for growth’
Are you confused Valley?
IYT fractals and IH&S buy signals confirmed and successfully back-tested.
Oil sector is supportive of the market despite US crude inventories rise by 5.3M barrels, more than expected…
At this point, I am hoping Mrs. market would goose a marginal ATH high with weakening internals. A precursor of a salivating bull slaughter orgy.
Back to the reality, I see no edge for both longs and shorts, just banging heads.
Perfect low risk short setup imo. Tomorrow is N declination when many 2% down days occur.
You still think we roll soon? Stong afternoon rally.
I think so.
Tough day for bears..
Lots of bad earnings reports from semi companies tonight. They are the canary in the coal mine. I think you may be right.
Louis Navellier of Navellier Funds said earnings were going to disappoint this quarter and next. I guess he was right.
I sold my SPXU. Wait to go long next week.
RUT daily – a short signal that entered today, yet looks to be in the process of turning into another long setup – http://scharts.co/1DNT3pk
Just opened SPX short, tightish stop above HOD but looks worth a go at this point. I can’t really go long unless we go above 2111ish at the moment…
vimho
J
are you serious ? I guess you’ll get caught with your pants down, once again. Honestly, why don’t you just buy and hold IBB and QQQ ? It’s so simple to make money nowadays.
It appears the Q earnings are broadly stronger than
expectations, ex energy.
Expect a likely last minute fudge on Greece,
Gold is not giving any indication of some
imminent catastrophic financial event.
I think the short opportunity may come tomorrow if SPX continues to gain few points while $NYUD (cum.) drops.
Scott, the Bradley turn date of Monday May 11 (May10 declinations) will likely result in a significant (short term) turn, because it coincides with the May 11 deadline that the EU or IMF has imposed on Greece to present a proposal to satisfy creditors. Greece has interest payments of E$770M due on May 12 and E$1.6B in June.
Good to know about the imf greece deadline. The illuminatti love to use astrology and numerology in their market rigging. The bradley turn date was set months if not years ago. The deadline was not. No coincidence imho
Nicolas,
I get caught with my pants down all the time, and managed 32% gain in Q1 this year. I am about 4% up this quarter so far, I don’t think IBB and QQQ have done that for you in Q1…..? In reality I am almost done for the year in some ways, but not every year is the same so I will keep trying to maximise my gains if possible. This does not involve buying and holding IBB and QQQ at this time, perhaps at some stage in the future.
:et us know where your stop levels are on IBB and QQQ, and maybe someone here will start taking you a little more seriously than a fluffer.
all imho ofc.
J
JS, does your trading involve futures, options, stocks or all three. I would really like to make 30% per quarter on capital but without leverage and especially without overnight trading seems difficult. I made 10% in March only to give 5% back this month. Futures seems more action cause lots of trending swings especially in the ES happen from 12 AM EST to 6 AM EST. Any advice would be appreciated.
well, at least i learned one thing today
ofc – of course
Hi, Does anyone else think that we could have some small weakness in the ES contracts till Monday next week and then rocket past resistance post FOMC?
Appreciate the feedback.
A “Risk-On” signal was triggered today as indicated by TLT:SPY. The stock market is finding support and may be ready to go higher.
I’m still not too sure about that….my thinking is a small down move (nothing like last Friday) and then a bounce post FOMC……but the question is whether one should be net long or short the ES?
My “gut” feeling is that the market wants to go higher….hardly any weakness in the ES in Asian trading hours and there is always a bit more volatility with London open (yesterday was a good example) but this seems to subside with a move up once US markets open. I’m tempted to go long but I can also see a small dip (maybe to ES @ 2080ish) and then a move back up. Certainly don’t see anything like last Friday on the horizon.
It’s difficult to see a viable future for Greece in the Euro,
but this generation of Eurozone career politicians have
a huge amount of political capital invested in the project
which is why I expect some last minute deal.
My own view is that both Greece and Italy would be better
outside the single currency and hope this eventually happens.
A Greek exit now is what I would like to see.
Greece adopting their former currency and prospering
outside the Euro – then I might just die with a smile on
my face after all this time )
Phil, Greece never prospered with its own currency. Constant problems. They don’t pay tax you know? Good on them.
I can imagine the Greek savers with a smile on their face like yours as their savings are wiped out if the drachma returns. Happy days eh?
Long dax at 11780. Think this is good entry point for the slingshot to the 12500 area when it happens.
Valley
I trade pretty much everything except debt, all of it is more or less leveraged which is why I am very careful. I have long term investments in pensions and IT’s spread around the place which are of course not leveraged.
Q1 was exceptional in some ways, however I don’t even aim for that sort of performance normally. I need to make about 35-40% per year on capital to equal my current earning potential in the markets as an employee, but I don’t *need* to earn anywhere near that much really. I have zero debt which has taken a chunk of money over the years to achieve, and it is going to stay that way for the foreseeable future.
30% per quarter is pretty high imho!
J
Thanks for the information on your trading for Q1. I made 10% in March and have given 6% back so far in April. New to trading so it will be a few years before I have a clear picture of what is possible. Many websites offering futures trading chat services that seem to make money (Alphawavetrader, Eminipics, TraderShark, TheTradingClan). Hundreds of them and some publish their results daily and are impressive. I have observed them day after day, and while they do overestimate by a bit actual returns they do have solid methods that pay off day after day. I will probably join a few of the better ones and just follow their lead.
Krish
Nothing in life is certain, 12500 is in my view likely but I wouldn’t call it certain as it would cloud my judgement too much. My own personal view only ofc, I wish you all the best!
J
GM, let’s just agree to disagree on Greece
and the Euro, my view is diametrically opposed
to yours.
Speaking of which, what has happened to your
imminent equity market correction?.
Phil, let’s just agree that you think devaluation is good thing (savers/pensioners be damned), and I don’t.
Yeah, the imminent correction grows more imminent by the day.
I find some of those % gains jaw dropping folks,
my trading style is clearly very different,
however I never use margin.
A couple of % a Q plus dividends and I would
be more than happy.
I began trading shares at 19, mortgage paid off by 28,
began working part time by 37 and was able to give
up work by 43, will be 47 this September.
However I have never even come near those type
of returns, may be in my very earliest days starting
with a very small amount of capital, otherwise I cannot
even relate to those types of % gains.
It’s been a slow long process for me.
I just vanilla trade LSE listed shares, never touch
anything else.
Off for a few days, good luck and stay safe all!
J
In the past several days DOW futures have been making a Triangle and Triangles usually resolve themselves by breaking out the direction that they came in and that means new ATHs for the DOW.
Pressure is building for the Euro to explode higher after breaking thru a Trend Line going back to December. This means a downside breakout of the USD index AND that would be good for US stocks given current “market conditions”. An upside breakout of the Euro (downside breakout of the USD) may coincide with an upside breakout of the DOW out of its Triangle of the past several days. The currencies may lead US stocks…..(follow the leader).
The Dollar going down means Crude going up and that means an upside breakout of US stocks to new ATHs. If you are short US stocks then I highly suggest you take a look at a chart of Crude. An upside breakout of Crude is imminent.
Added to dax long 11685. These are small additions now. Draghi probably preparing his next DAX boosting speech in a panic. But I think we are close to a bottom in the DAX anyway. Dow holding well…expected more weakness there.
Ahead of the rush. Bought WMT yesterday for many compelling TA reasons. It is also a defensive play in time for the next recession. WMT management woke up and realized that they have a socialism/capitalism mix-up and they are fixing its plumbing problems immediately by stores closure.
$NYAD (cum.) at ATH. This is a leading indicator for price. No sign for significant correction. Do not be afraid.
Richard, as mentioned last week those
shorting the Euro at this point may find
that decision costly.
Would expect GBP to begin to weaken against
the Euro with the UK GE now looming large and
no outright majority the more likely outcome.
This week I have posted warning that the Euro is going higher and shortly after I did so the German government debt instruments made a sudden and quick rise in interest rates. The Eurozone is not going to fall apart and Northern European debt is way over bought meaning that their interest rates are way, way, to low. When their interest rates rise so too will the Euro. Given current “market conditions” a falling USD will translate into rising US stocks to new ATHs which is not what many on this board are expecting or positioned for.
Right on! appreciate your analysis.
Hi Richard and all. I am very well positioned for a continuation of the bull market. New highs for QQQ and SPX, IBB is near the highs too. Congrats !
‘everything is awesome’
I think the next leg of this bull market will be in commodities. So, I recommend to buy stocks liek BHP, CCJ, RIO etc….
Honestly, you cannot deny I’ve been spot on with my analysis.
I think the major Grains are setting up for Elliot large degree Third waves higher.
“The time has come,” the Walrus said,
“To talk of many things:
Of shoes–and ships–and sealing-wax–
Of cabbages–and kings–
And why the sea is boiling hot–
And whether pigs have wings.”
And when all said it is today that the next big correction begins
I thank you I thank you
Good Day
Why today Peter?
This madness may continue for quite some time.
The rain in Spain stays mainly in the plain
I think she’s got it. I think she’s got it
We continue to label this bull market as Cycle wave [1] consisting of five Primary waves. Primary waves I and II completed in 2011, and Primary wave III has been underway since then. Primary I rose in five Major waves with a subdividing Major wave 1 and simple Major waves 3 and 5. Primary III is also rising in five Major waves, but Major 1 was simple, Major 3 subdivided quite a bit, and Major 5 is expected to subdivide as well. When Primary III concludes there will be a steep Primary IV correction, probably in 2016, then a rising Primary V to end the bull market, probably by 2017. Our target for Primary III remains SPX 2530-2630 by Q1/Q2 2016.
Sorry Peter I don’t follow Elliot Wave but I’m interpreting that you expect a correction (primary IV in 2016 but you don’t mention why at present you expect this correction.
Thanks
GOOG, MSFT AMZN JNPR up strongly after hours on earnings.
GOOG misses estimates on revenue and earnings, the stock is up 10$ after hours.
You see, bad earnings is actually great for stock prices. This is the new era I was talking about.
Regards
On this positive note, I will leave for the wine country and relax for a few days. Good luck.
Elliot B waves often exceed the ending prior Impulse wave especially if the B is part of a larger 4th wave. The DOW could be making a “B of 4th” wave higher that becomes a much larger correction, lower, for the Summer, with the adage “sell in May and go away” aptly applicable to it. Then, from an October low, the complex 4th wave ends its correction (Delta low L-2) and the DOW soars higher in its final Elliot Impulse wave that tops early next year (Delta high L-3 with SL-6) for the crash that so many are expecting (several hundred years early Elliot Millennium 3rd wave top). Allan take note.
Thank you Richard. Your EW count is the most compelling and logical count among several counts which I have encountered. Time wise, I think your count fits nicely with the shemitah and geocosmic factors that some folks on this board have discussed. I believe valley, Phil White, and andre are also calling for Sep/Oct corrections.
All signs are pointing to a market top. imv.
Richard, what you are seeing in the Euro is a
counter trend move only imv.
The $ appreciation has some way to go.
I expected some Euro strength as $ sentiment
looked overextended to me.
Could be correct. Triangles tend to end in “throw unders” or a “through overs” meaning that as the major currencies make “throw unders” the dollar makes a “throw over” and the DOW makes a “throw under” given the new “market conditions” that a higher dollar adversely effects American stocks. All could be in sideways Triangles that end and, then, their final 5th waves began. Recall that Elliot 5th waves can “truncate” but don’t have to. If the DOW 5th wave “truncates” then this “B of 4th” wave higher will be the ATH and the truncated 5th wave will be John’s “second chance top”. Lots of possibilities.
USD may be forming a triangle. Too many betting on downside in USD
Large industrial currencies and American stocks could be starting to trade in a sideways Triangles like the Yen has been doing all year.
Euro macro is not strong enough to support
a longer term appreciation of the
common currency at this point.
The $ is still most likely in the early stages of
it’s bull run imv.
Due to new and different “market conditions” should the USD trade sideways in a Triangle then so will US stocks but opposite of each other. Elliot “guidelines” are that 4th waves are usually Triangles before the final 5th wave that ends and reverses the major trend.
If my memory serves be correctly then John has identified major Geomagnetic turns in May, October, and January. If so then that could be what Delta conforms to with a six point solution stocks Long Term Inbetween point in May, its L-2 low in October, and its L-3 high in January that brings in its high SL-6 with the crash to follow. This would point to John’s Geomagnetism being the truer ruling “wave” power at the final end of the SC’s effect before the Top and Crash to follow.
Everything looks good today again. New highs for QQQ, gold down sharply. It confirms my theory that central banks will make sure the gold price stays down.
Regards
Indeed Nic.
When I look for confirmation of my theories, I always, without fail, look at just one day’s price action for validation. Always works so well. Well done to you for following my lead.
LOL I agree with GM
Good one GM 🙂
Hi GM ! It’s not only one day. My QQQ, IBB and AAPL have been outperforming for years now. I just think that today is quite representative of my outlook with QQQ at new highs and gold in the toilet.
But Nic, QQQ has made 2% total since 2000.
Do have a look at the gold price over the same period. then report back.
I’ve got a very poor internet connection where I am so I try to save it for something important.
Hehehehe!! Well said GM!!
P.S. I wish ‘I had said that’
I finally figured it out, except i don’t know how janet finds the time to post here
I just bought AMZN at 448.48$. It’s a nice addition to my portfolio. I think AMZN is still very cheap and should go higher.
what do you think ?
There is an old saying ‘all gaps get filled, except in loss-making internet stocks’, so yes, seems a great buy.
I half expect that you are actually short and just making fun of yourself….
Margin debt makes new highs. So much for 2014 being the peak.
http://www.nyxdata.com/nysedata/asp/factbook/viewer_edition.asp?mode=table&key=3153&category=8
Yes, it really hurts to say it but John Hampson has been wrong. There’s no other way around it.
Margin debt at new highs, new highs for QQQ, SPX. IWM and IBB are also near new highs.
Europeans markets are on fire. Gold is in the toilet where it belongs.
Frankly, I think it’s time to admit it. John’s analysis looks good on paper but it’s been way off.
My suggestion is to focus more on central banks actions and less on fundamentals.
Please don’t shoot the messenger. We can have a constructive conversation here.
You really need to stop shooting your mouth off about your gains and how brilliant you are, because if you had bought Canadian and Australian gold stocks late last year when you trashing the whole sector your gains would now make your gains in those you mentioned above look positively paltry.
And that is a fact friend.
Read ’em and take a deep breath…….you wish you had some of these gains.
And John has more analytical ability in his pinky finger than……………. Show some damn respect!
http://www.miningfeeds.com/gold-mining-report-canada
Nicolas, no offence however your comments RE gold display a total lack unbiased observation and an inability to decipher market action.
When John updates I will make one post RE USERX as somebody questioned me about it the other day and depending upon todays closing price things could be about to get very intetesting.
Hi Allan ! Of course some specific gold stocks could have outperformed. However, GDX and GDXJ are still near the lows. So on average, QQQ, AAPL and IBB have clearly outperformed gold stocks indices.
I have a lot of respect for John, but it still doesn’t change the fact that his analysis has been wrong. It’s not my fault.
Nicolas, you are totally WRONG about gold stocks underperforming,check that list of Canadian gold stocks again. Nearly every single stock is up a minimum 100%. many are up 2-300%.
Once again you are mired in your approach and failing in your ability to think ahead and shift capital accordindly.
As for John, you are being flippant toward the massive amount of analysis John has posted and it’s significance.
Don’t lose sight of the fact that the US indices are struggling to make new highs and just marginal highs at that.
So you go ahead and buy your AMZN at price levels that are aburd beyond description because I will go on recird now for stating that AMZN will crash and likely not recover current levels in my grand childrens life times. $450 for stock with negative EPS?….I don’t care how bloody good the growth story is!
Valuations of FB,AMZN,TWTR etc etc are beyond absurd.
Allan, I can provide you with a list of biotech stocks that are also up 200%-300%-400%. I’m not talking about individual stocks here, i’m talking about the average. So, we can compare GDX and GDXJ versus IBB and QQQ.
We’ll see regarding AMZN. It’s one of the leaders of this bull market and a major component of QQQ. So it means it’s a target of central bank buying.
I don’t understand why some people are agressive with me. As I said, I respect John’s analysis, but at the end of the day he’s been way off with his predictions.
“I have a lot of respect for John,”… that is not a compliment to John. We can only hope that contra-indicators, economic illiterates and bag holders at tops such as yourself continue buying outrageously over prices amazon and the likes… go for it!
Glenn Neely in my opinion is one of the the best EWavers of all time. His view of the market is something worth taking note.
Click to access TRANSCRIPT-GlennNeely_IkeIossif_discuss_Gold_and_SNP.pdf
Sorry erick, don’t agree. The guy calls a top in 2011 and gets it right on the way down(not that hard) so everybody thinks he’s a genius at calling gold.
Frankly the 2011 top was easy to see, the rash below $1500 was even easier.
What is much much harder is seeing the signs that gold has bottomed and won’t continue to fall because like many US based analysts he needs to remove the blinders.
AL
You might not agree but it is possible. The weekly gold chart from its lows in 1999 to ATH has not retraced 50% yet. That is around 1090 mark. To me the chart looks weak and there is a possibility of retracing 61% to around 850. That is my target to buy. Hoping the AD will be around 85c when that happens.
More then likely I will be wrong but that is the plan.
Allan. I respectfully disagree. Gold is due for an 8 year cycle low. If gold breaks below 1140, it would confirm my theory that November is not an intermediate cycle low. Strictly from weave count perspective, gold could very well drop below 1000, which then will be considered a buy of a lifetime. I believe gold will ultimately reach 5000 within the next 8 years.
Erick, do you really think that gold is going to grant the opportunity for all those waiting for a drop to 1 k or under?…..C’mon mate.
How many are waiting for the buy of a lifetime?………. Literally millions I suspect.
Every man and his red dog are waiting for this final collapse in gokd to buy.
Sorry mate but opportunity to buy the lows will be missed by the vast majority and gold stocks will be many multiples higjer before many even begin to wakeup that the bottom was in months before. And even then many still won’t accept it.
Time to short the SP-500 again
I think it is very positive that Nicolas has given his first actual bit of information after literally hundreds of posts of just waffle:
AMZN @ 448.48see
Discussing whether certain stocks are up 100’s of percent is meaningless when no one knows whether any of the aliases on here even have any money or positions at all In the market. If people want to debate or share theories about the markets that is fine but if people want to get into performance then they have to start giving specifics otherwise it is not relevant or even honest.
No more “i bought QQQ or Australian gold miners with 8 figure sums and am up 100’s of percent now you plebs”. Tell us at the time when you take a position or just don’t tell us at all. It just skews the discussion when we don’t know what the truth is. We don’t need any amounts, just the price levels and direction.
AMZN 448.48
someone has just grown some balls and I wish him luck in the position. Let’s see how this pans out in real time if he dares.
J
From where I’m sat it’s clear as day that Allan has done what he says he has done (I recall he mentioned the Oz miners back in November too as a screaming buy).
Also, clear as day to me that Nic just having some online fun and his AMZN ‘call’ was a classic, and very amusing, piss-take. Surprised he hooked you jeg of all people.
FAS-stalking update. Inside week: http://schrts.co/R9hibJ
Inside day: http://schrts.co/ZmjZnt
The fall from late March to a mid April low
has been entirely invalidated and now a
sell off and marked weakness during this Q
earnings is rapidly going the same way.
John Li has referenced margin debt which appears
to be conveniently ignored by those who appeared
certain in an imminent and significant equity correction.
For me I will not change my own call,
or make any others.
Continually changing and pointing to yet another new date
is ridiculous and has no merit, as ultimately your
guess will be right if you keep changing timeframes.
We are all aware that a new bear market ultimately follows.
This Q earnings continue to look supportive to the
bull market continuing, you can have corrections within
this on sentiment shifts, but a correction is not a new
bear market.
There are events such as some rapid dislocation in the
bond market or a rapid worsening of geopolitical tensions
in the Middle East that could cause this market
to roll over shortly, however at this point macro earnings
continue to look supportive on the basis of the last week.
If earnings are to derail this incredible bull run over the
next few months, I would have expected to see more
evidence of this over the past week and that has, in
general terms, not been the case.
Have a good weekend folks.
‘For me I will not change my own call,’
Phil’s call is for the bull to end within a 4 month window later this year (July to October I seem to recall), but he loves to critices those who think it’ll be sooner. He loves it so much, he repeats the same statement every few days. And his window is 4 months long. FOUR MONTHS.
You couldn’t make it up could you?
Phil, you’re truly a sad individual.
First quarter triggered the October 2014 decline that was stopped by last quarter. Next monday first quarter and last quarter may 11th.
Not all quarters trigger these reversals- there has to be something else. Tomorrow I’ll explain what else there is today and why I expect a decline to start on Monday that will last until may 11.
Cheers,
Andre
Don’t get me wrong – I love debating big picture views and these should be encouraged. I just think it better to be more specific if discussing trading positions. We know where Allan stands in general.
Good luck as always.
J
I say watch the $USD, and watch fund-flow.
Lastly, watch China. From an AG society to global mfg., …what is Next for its quest? I suggest you google search the news on the intercourse between China and MSCI in the last 2 years. You can find the road-map. What may happen next?
The above is one of my trading positions.
PS. I am tired of reading discussions on the same ideas too.
Jegersmart – I’ll be buying May and June SPY 212 Puts on Monday.
Should be able to get May around 2.20, June 4.40
The Swing Trend Indicator is still on Full Buy, since March 20th, but the daily charts are still showing no trend.
If its on full trend indicator than why are you buying puts. Thanks.
Allan… I am not sure if it is true that millions are waiting to jump on gold right now.. Seriously, it is the most despised and most manipulated commodity right now, fully controlled by the bullion banks.
I think it is a difference in perspective. I am buying on dips, simply because of my unique situation that I am holding on to cash, sitting on the sidelines. I don’t day trade and can afford the whipsaw until gold reaches $5K. For most people, why buy gold now when it potentially could whipsaw and fleece both longs and shorts, or even hit the multi year cycle low below $1K? Wouldn’t it be smarter to wait until gold solidly confirms the start of a bull market? It wouldn’t make that much difference to buy gold at $1K or $1400, if we have a strong conviction that gold will be $5K ultimately.
erick, I love your approach to investing in gold. 😉
Thank you GM. Our patience in gold will pay off 🙂
More discussion on the same subject. Ugh!
I am history.
LMAO!………so you can post whatever you like on whatever you like, whenever you like, but nobody else can?
FEAR RATIO: found some an interesting ratio from another chartist on trading view.
http://charts.stocktwits.com/production/original_35900759.?1429946630
Below are 4 links to trading view. Specifically focus on the first two links: the daily and weekly charts showing the ratio of 3 month volatility to 30 day volatility of the fear index for the S&P 500
The ratio has touched (1.24) 18 days out of the last 365 and on the weekly chart 25 times out of the last 260 weeks. If you buy puts 2-4 months out at each touch of 1.24 you will be greatly rewarded more than not.
Alternatively, if you buy the dips when the ratio touches 1.02 or lower and buy long spy calls 2-4 months out you will be greatly rewarded more than not.
Fear as evidenced by margin debt at ATHs and well pontificated by Nicolas is at the extreme edge of the bell curve. Volume is drying up and smart money exiting stage left.
I for one, am currently long Aapl call spreads through mid may and long 210/205 Spy puts 5/29.
I hope to have my AAPL call spreads (128-133s) to be taken from me before 5/8 and turn the cash into more longer dates put spreads w/ the spy between 208-215
https://www.tradingview.com/chart/?symbol=VXV%2FVIX : weekly
https://www.tradingview.com/chart/?symbol=VXV%2FVIX : daily
https://www.tradingview.com/chart/?symbol=VXV%2FVIX
CBOE S&P 500® 3-Month Volatility Index Description
Introduced in 1993, the CBOE Volatility Index, “VIX”, is widely recognized as the premier benchmark of stock market volatility and investor sentiment, often referred to as the market’s “fear gauge.” In 2003, CBOE updated the VIX methodology, paving the way for exchange listed products, and establishing volatility as a new, tradable asset class. Today, VIX options and VIX futures are among the most actively traded contracts at CBOE and the CBOE Futures Exchange (CFE), averaging close to 140,000 contracts combined, or about $15 to $20 million
“vega”1 per day.
https://www.tradingview.com/chart/?symbol=VXV%2FVIX
In 1993, the Chicago Board Options Exchange® (CBOE®) introduced the CBOE Volatility Index® (VIX® Index), which was originally designed to measure the market’s expectation of 30-day volatility implied by at-the-money S&P 100® Index (OEX® Index) option prices. The VIX Index soon became the premier benchmark for U.S. stock market volatility. It is regularly featured in the Wall Street Journal, Barron’s and other leading financial publications, as well as business news shows on CNBC, Bloomberg TV and CNN/Money, where VIX is often referred to as the “fear index.”
Talk to me ..Andre….n
Thanks all, new post is out