

1. Non-Farm Payrolls out on Friday, a big number forecast. Note the two biggest prints of the last 20 years were March 2000 and May 2010, both market peaks. This is a lagging indicator.

Source: Trading Economics
2. US earnings reporting season starts on Monday. This chart shows that a contraction in whole economy corporate profits has historically produced a market correction within 0-7 quarters, ticking since Q1 2014.
 Source: Don Draper
3. We are seeing new all-time record lows in 10 year government bond yields in Germany, France, Italy, Spain, Portugal, Netherlands, Japan, South Korea, Australia and Switzerland, with the latter leading the race to zero (source Charlie Bilello):
 4. Russian CDSs rocketing, warning of potential default:

Source: Charlie Bilello
5. US Inflation Expectations now negative, for the first time since 2009:
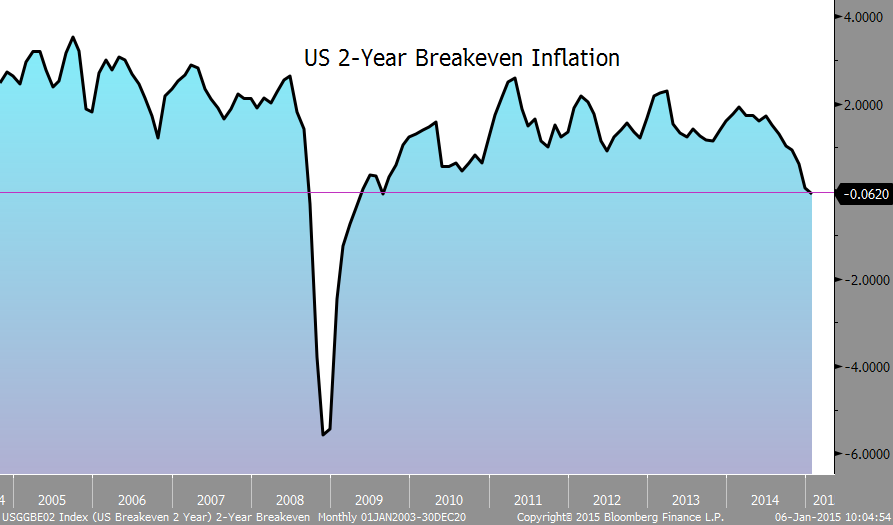
Source: Charlie Bilello
6. Eurozone annual inflation now negative, for the first time since 2009:
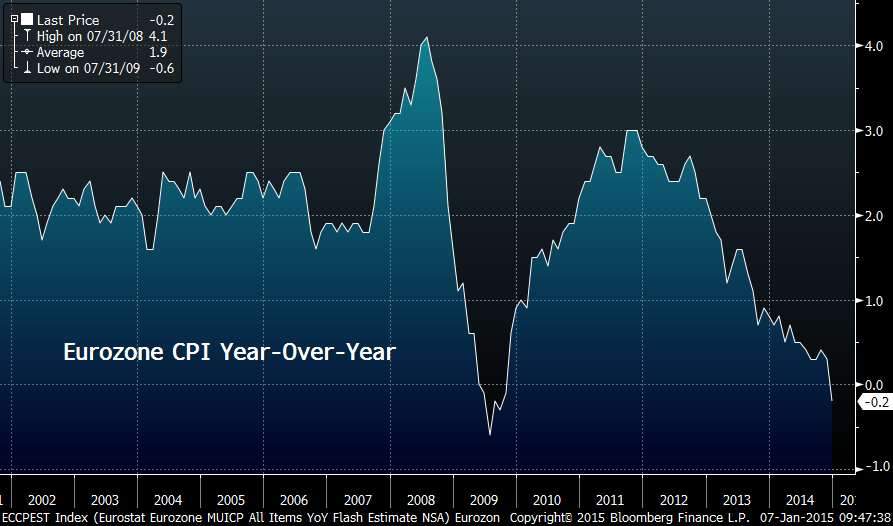
Source: Charlie Bilello
7. Global manufacturing PMI dropping sharply since mid-2014:
 Source: Markit
8. US factory orders annual growth now negative:
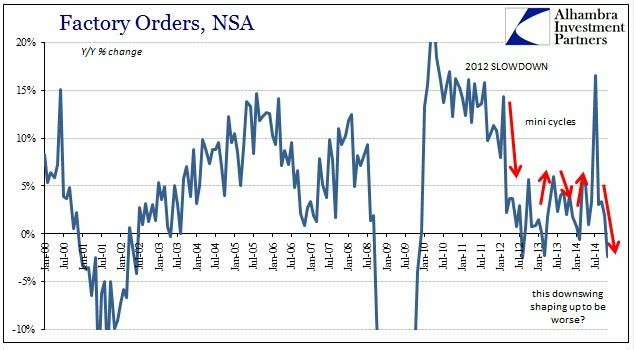 Source: Alhambra
9. Combined balance sheet expansion of Fed, BoJ and ECB reversed course as of mid-2014:
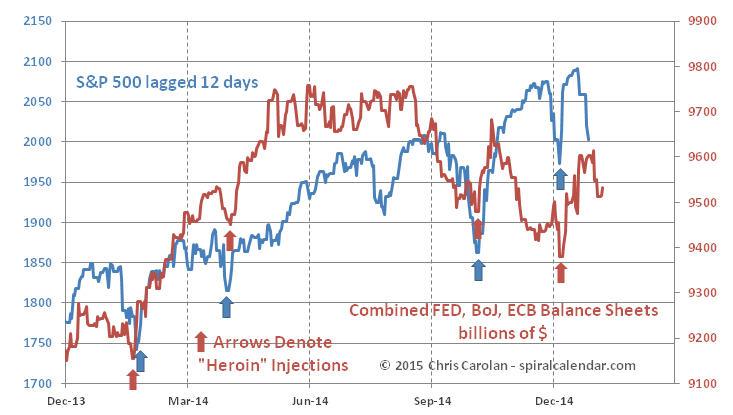
Source: Chris Carolan
10. Crude oil ROC and futures curve show a bottom should be close. However, a price bottoming process is likely before any long positions would be fruitful.

Source: Charlie Bilello
Source: Phomax
11. Treasuries to stocks RSI and treasuries to stocks sentiment both echo previous bottoms in stock prices the last 3 years.

Source: Andrew Thrasher
Source: Rory Handyside
So do stocks bounce again here? At some point the pattern fails and stocks break down hard. The question is, are we post-second-chance? I believe the key is whether stocks can rally back up into the Jan 20 new moon, or whether the earnings season is a sell from the outset.

John wonderful post yet again.IMHO SnP to TOP only around 2130-2155 sometime in MARCH/APRIL before a decent 15-20% correction ensues.
Fully agree. I think SPX 2170 is in the cards. Only if we breach December lows means that bull is finally over. IMHO now there is last opportunity to evacuate gold longs before final washout to 900-1000 happens.
Thanks for the great charts and updates John.
I say that we rally back up to the new moon and set up a head and shoulders pattern. 🙂
John, thanks again for gathering and presenting all this info in such an easily absorbable manner.
Regarding Point 11, which clearly is suggesting a bottom rather than a top, do you have any thoughts on what may possibly be causing this anomaly?
Always interesting to read the differing views here,
I’m in the one more ATH camp as outlined by Burnell
and viks above.
Yesterday’s geomagnetic storm and continuing disturbance should, under normal circumstances, cause selling of speculative assets (eg stocks) and buying of perceived safe-haven assets (eg gold); but the opposite has been happening.
(I see that as another sign that stocks buying will continue and accelerate towards the final stages of SC24 max, later in 2015 or early 2016. In the meantime, my lunar timing indicates more bearish or sideways volatility until 9 February)
Mark, what if people perceived stocks to be safer than gold? Our CBs have distorted everyone’s investment compass.
At the moment markets perceive stocks and govt bonds as safer than gold, and also *gold* is shrouded in all sorts of paper derivatives. Hence the gold price languishes, with one final washout low a possibility.
But eventually investors will not be able to avoid facts, as corporate earnings go the wrong way, as financial crises wash over the planet, and as currencies continue to be abused (apart from the Euro).
Gold will save the world, yet again, as a much higher physical price recapitalises the sovereigns. When? I don’t know, but the clock is ticking.
Agreed GM, again.
Fibonacci timelines for gold’s bear (accurate so far) show a minor turning point this week; a major one at the end of March and another last week of August 2015 – if nothing happens then, we could be in for a long wait…
That seems to be happening purvez; but its only getting started.
Looking at all these surveys, sentiment measures, charts and analyses purporting to show extreme stock market bullishness from retail and the public, I see total fantasy.
Anyone who actually believes that a large proportion of the public is already fully invested in stocks is seriously deluded, stark raving bonkers, 100% certifiable, mad as a box of frogs, clean mental!!!
Or maybe its me who’s living on a fantasy island in a parallel universe.
In studying %NYHL, I see a negative divergence to price since June 2014. $NYHL diverged for 11 months from Dec 2006 to Oct 2007 when higher prices have been achieved based on lower New Highs….and you know the rest of the story.
Watch the $NYHL. Unless it can improve in the coming rallies (and ATH?), the bulls will pay the price dearly down the not too far in distance….
This is my strive to pick the top…as well as the bottom.
Dr. Alexander Elder says” “Traders need to pay attention to three aspects of the $NYHL, listed here in the order of their importance: divergences between the peaks and the bottoms of $NYHL and prices, the trend of $NYHL, and the level of $NYHL above or below its center-line.”
vxx
http://stockcharts.com/h-sc/ui?s=VXX&p=5&yr=0&mn=0&dy=2&id=t52183349948&a=347142822&r=1420720244941&cmd=print
Slater I love vxx, best swing trading tool ever. What’s your target here?
Spx looking to gap open right at a converging 20dma and 50dma around 2040. No doubt a big nfp tomorrow, a good number likely spike up to 2050 area which is previous megaphone resistance. That’s where I’d look to short. In the meantime, still long spx
You’ve been wrong time and again. Tuesday’s 1992 was clearly an intermediate low which has been brushed aside. Look at the 60 minute chart. The trend is now clearly up and away again. We will see all time highs in the 2100s later this month.
Hey Simon, been calling for a short term bottom and positioned for this. I’m not convinced just yet we get to 2100 based on technicals, but if ECB truly fires his bazooka then yes. A huge binary event to me that can go either way.
Euro Yen stretching the rubber band again this morning. Back in January and September last year this fx pair hinted at the strong sell offs in stocks to come. Probably among the better leading indicators.
http://www.investing.com/currencies/eur-jpy-chart
In January and September Euro Yen sold off 5-6% same than we had recently. Corrections were 6 and 10% respectively. In line with this pattern 14% correction would be 1795 or an area of strong lateral support.
wave 2 in ES did 50% correction so free to drop in a wave 3 to 1870 area before wave 4 up.
failed attempt at a new high in IBB of note
Peg – If I’m reading this chart correctly, it’s telling me this current rally in stocks “shouldn’t” be happening… Or in other words, this rally is going to fail quickly and head back down…
Is that correct?
Thanks..
would say so. ES and $/Y in sync currently as measured from their respective tops. ES 62% retrace from wave 1.
martin armstrong is of the opinion that stocks will stay flat in 2015 and that govt bonds will go into a bubble. anyone agree? some bond funds have had nice 20%+ gains in 2014. A bubble would imply a further 50%+ gain in 2015.
However, that would mean gold would be lacklustre imo.
karl, I can see that the current deflationary wave downwards forces capital into the supposed safe haven of govt bonds, taking yields across the board into negative territory (i.e. yes, a huge bubble, and the end of the 30 year downward cycle in yields).
When the deflationary slide is met with another round of QE across the world (but even bigger than before), and that QE proves as ineffective as the others in the real world, then I see the bond bubble bursting, as yields start to rise, along with money’s velocity, and price inflation finally takes off. Stagflation, or worse, awaits.
That’s when gold comes into its own. Finally.
@Mark, thanks for those Fibs dates, duly noted.
$ continuing to strengthen.
The $ rose through the recent equity weakness
and it’s rising in the equity bounce back.
Least ugly at the ball, to paraphrase Buffett,
at least for now.
Barry,
astute call on highlighting the case
for an equity bounce back.
Thanks, Phil… Blind squirrel and acorn in action, no doubt… 🙂
Not too surprised to see 2053 (ATM), just didn’t think we’d be there 2 days later…
Market moves are crazy fast right now……on both sides….
Added back some shorts earlier this morning to build back up my short position….but yes, being nimble is a survival necessity lately…
Looks like another V-covery underway. I like Davinny’s chart though. I too am expecting a test of 1900 soon. I won’t rule out 2100 on this bounce in such an irrational market.
An interesting tidbit re. the U.S. market: over the last 43 years, if the first 5 trading days of the year show a net gain, there is an 81% chance of the full year following suit.
SPX daily – the fork that ruled last year continues to do so
http://scharts.co/1AupNC0
Last 4 weeks ES traveled 424 points or 21% measured on current level – shaking out both bulls and bears
2055 could be the 2nd chance top which retests the wedge ES has built all of 2014. Traget of this wedge is same area pinnated out earlier 1795ish.
http://www.investing.com/indices/us-spx-500-futures-streaming-chart
There’s that gap there that got filled as well – 2055-2060….
I’m thinking we just hit a pretty important top, but after moves like we’ve had lately, confidence in ANY move is tentative at best…. :-O
I’m doing what I think is the correct trading move, but confidence in it is another matter…
Lunar Chord and Seasonals:
Phase Declination Distance Seasonals
Thur + + –(today is apogee) +
Frid + ++(Equ Cross) – +
Mon + – – +
Tues + – – +
Wed + – – +
Thur + – + +
Frid + – + +
Summary: King Price is gapping up indicating pent up demand.
I am going long R2K at this time based upon mixed lunar seasonals
but strong price.
Explanation: Phase Full plus four days bullish until New plus four,
Declination strong at Equ Crossing every 14 days, and week from
crossing until two days after far southern declination which is on
the 18th.
Distance today at apogee should have been week and weakness
should continue three trade days after apogee.
Seasonals last two days of second week of month and entire third
week of month are price positive.
Recent short trade on R2K was small loser based upon surprise
rally following FOMC meeting.
thanks, Betafish. Good stuff!
My formatting was condensed when I posted. So + and – refer to column headings which are above. Visually you have to move the signals over to match up with the column headings.
Aaah Betafish I did wonder what the +/- were supposed to be. Thanks for that info/commentary. Yesterday was a bit of a ‘surprise’ for me too as I was expecting a small down day.
Over the last two years you could have made 800 pts on SPX (from 1500) by buying every time it dropped to 125 dma and sold after it went up 100 pts. You would have missed half of two 200 pt gainers, and the max draw down was 200 pts in Oct. (Plus 70 so far in Jan)
http://stockcharts.com/h-sc/ui?s=$SPX&p=D&yr=2&mn=0&dy=0&id=p52285654824
GM, good post. What i’m expecting for 2015:
1) stocks end the year flat; not precluding a 15-20% correction in between.
2) The US 10 year bond heads down to a yield of 1% or below.
3) gold consolidates and ends the year flat before rising in 2016.
I’m thinking of buying LSE:TLT and hold until oct-dec, and them switch into gold.
TLT has already had a near 30% gain in 2014, and there could be further gains to come. Its psychologically difficult to buy something which has already risen significantly, but I find its a good policy.
What a fascinating market we have here….
Went through charts tonight, fully expecting to get a buy signal from my trading system, and another whipsaw.. But not only didn’t that not happen, generally speaking, charts looked weak for the move we got today… Very weak, from a money-flow perspective…
On the surface, this looked a lot like the 2nd day of the rally from late December, only this one was weaker…. Not from a price perspective, obviously, but from a MF perspective….
So, added to some shorts today, but nothing really new to add commentary-wise…
Wicked fast market though lately……on both sides…. Good times… 🙂
GL
That’s funny. My trading system treated that 100 pt. drop like a blip on the screen. It is still on full buy, so I’m treating the move down as a wave 2 still.
When the major markets retrace over .618, 85% of the time they produce a new, higher high. But who knows. The market is moving fast.
Baz, an nteresting market but not one that I am prepared to buy, at least not one that I consider to be at historically overvalued levels, too much value elsewhere IMO.
One junior goldie just this week made a superb announcement in respect to earnings and I suspect that the gold sector in general will continue to improve.
As I mentioned several weeks ago crude is a huge cost to gold miners amd they are going to reap masive benefits to their bottom lines from sub $50 b oil.
Here is an alternative pattern to consider:
https://www.tradingview.com/x/O6Lkai7z/
Yes this scenario is quite possible. But trying shorts here is probably going against main trend which is up.
But what amazing chart on crude oil on site you have provided !
https://www.tradingview.com/v/YN5tHCj1/
I think oil will break that trendline but it is hard to predict if it happens this year or maybe in 2016, solid correction is required. Oil up and gold down looks plausible.
Gold looking to collapse!
JTTT, gold looking to collapse because?:
-sentiment is at all time lows
-gold beginning to show strength despite new dollar highs
-indian and Chinese demand continuing to improve
-unbelievable value in equities (sarc)
-because every msn and his dog just wants to hop on the let’s bash old bandwagon
-Shanghai Gold Exchange volume on track to eclipse US within 2 years
-bonds yields are so attractive and bonds are nowehere near a bubble(more sarc)
And about 50 other points
🙂
What? Which gold?
Nice purvez.
Just kindly remind that years end 5 very bullish. 2015 coud be a big rally
15-20%
Force Index, a tool invented by Alexander Elder flashed a buy signal at the close on Wednesday in the aggressive/sensitive time frame of 2 EMA. The longer time-frame Force Index signal (13 EMA) gave a buy signal after the close on Thursday.
The other Elder observations. New Highs 329; New Lows 29 for Thursday’s trading session. In Elder’s analogy, 329 officers led their troop charging up hill while 29 deserting officers who sneaked away. in the dark The balance between strength and weakness is pretty clear.
You may want to check out Elder’s work. Elder does not short against an up-trend. He only looks for BTFD opportunity. . It make sense from a probability standpoint.
VIX fired a distress rocket on Thursday and it gaped down into a bright red candle.
Has the market bottomed? You decide.
My God, this is the most skewed article I have read in a long long time.
The US pumps billions of barrels of new supply into the world economy amd this writer fires a shot at OPEC and implies it is them that should cut ouput. Absolutely laughable.
So why doesn’t the US just attack the ME since they have taken up weapons against the US?
Whatever happened to the “survival of the fitest” american ethic?
http://stockcharts.com/h-sc/ui?s=$BDI&p=W&b=5&g=0&id=p35484055718
Sorry wrong link
http://finance.yahoo.com/news/opec-weaponized-price-oil-against-102550131.html
The US has attacked the ME, and continues to do so.
Hahaaa…Touche,
Astounding article nonetheless. What is the rest of the world meant to do?… step aside and pick up the crumbs the US drops while it frenzially feasts.
Allan – remember too how Paolo’s oil cycle model accurately predicted oil’s sudden fall months in advance? This surely shows that it was typical market action, rather than a sudden decision by OPEC (or anyone else) to bring the oil price down: http://econocasts.blogspot.ie/2014/04/20140331-xoix-cycle-model-chart.html
Mark, I have no doubt that the collapse in oil is due to deflationary pressures not OPEC supply issues nor US supply increases. Just look at copper.
I was just pointing out how absurd the article was.
Cheers
big disconnect between ES and $/Y this morning. They cannot both be right!
of note big fibonacci 120.15 in $/Y has held first time yesterday. Also Biotech did a gap fill left at the top from a couple of weeks ago. Historical tops in $/Y have maxed out at 32 calendar days. We are running out of time at 32 days today.
Hi Geno-
I suppose we ~could~ have just see a Wave 2, with the start of Wave 3 forming now, but you might want to have an Alternate count handy too….
Which is what I hate about EW, BTW…. Always an Alternate count, or two…..and no matter what happens, the person counting the waves always says, “See there, nailed it….” They’re never wrong… The market just chose their Alternate count… *shaking head here*
And have to say, 100 S&P points is MUCH more than “just a blip” to me, so obviously we trade in much different time-frames…
But if it works for you, who am I to say anything… Good luck…
Barry – I use various indicators along with the Swing Trend Indicator to achieve the best EW count I can. You can only trade off 1 count, so I can’t have a bullish and bearish count at the same time like everyone else. There is no way to trade that.
I didn’t say a 100 pt. drop was a blip to me, I said it was a blip to my indicator. And rightly so since we’re right back up here 1.5% away from the all-time high.
There are numerous longer term indicators I use that currently look ominous for the US indices. They gotta keep moving up or give in.
euro yen pointing markets hard down
looking like the big one is getting under way!
Go long the Euro……GS looking for EURUSD parity. Remember how these guys nailed the gold top back in 2011 LOL!
It is of course no coincidence that these guys issue extreme forecasts at major turns….or is it?
$/Y may be forming triangle since Dec 8th top and now being at its lower bound. SPX 2039 is at 38.2% retrace of last move.
Until mid-December lows are taken in SPX and $/Y I am reluctant to accept big one is already underway.
Also VIX may be just filling gap from yesterday in 18-19 range. And will turn south afterwards
118.60 last line of support for bull market
again ES and Y/$ not in agreement – cannot both be right
Realized I overlooked something yesterday…
If any cares, my trade system was 50% short – from 2003 SPX, entered 1/06.
And I overlooked the second 50% entry yesterday that was to be triggered at 2053 SPX… Regardless, for tracking purposes, system is currently 100% short, from an average of 2028 SPX…
A blind man on a fast horse could probably have beaten my own system the past few weeks…. And I have!! hahaha
Hehehe….hope you were just blind folded….or was it the horse that had the blinkers?
I don’t short unless $NYHL goes below the zero-line.
And as Bunell mentioned, not getting toooo excited to the downside here, unless the Dec lows (1990) get taken out…
Make that happen, and then we’ll be getting somewhere… 🙂
Until then, it’s just like handing money back and forth….
Under 2020 would make the short side look better for me.
Over .618 retrace odds
http://unbiasedswingtrades.blogspot.com/2015/01/over-618-retrace.html
When I last ventured an opinion about 6 weeks ago, I suggested, into howls of vitriol and laughter, the market would continue to rally into early New Year.
Now that we are here, I think the market is about to have a correction that will last into early March.
The correction may have started, but could hold up until late next week.
It will set up the low for the year.
Years ending in ‘5’ have the best record of all, with only 2005 the exception in 100 years.
2015 will be another great year.
To the feral bears, you have been warned 🙂
Good call Daveg. Possibly to pick up steam during late January Mercury retrograde which are usually exciting volatile times in the market. Early March bottom might ease the way for Draghi inspired QE. Fifth years have been almost consistently winning years by a wide margin over all other years, though one possible reason for this might be the sunspot cycle over the last 100 years featured year 5 in the exact center or near the center of solar minimum. In 2000’s the solar minimum was delayed until 2009, so perhaps this 5 year will resemble more the behavior of other solar max end years which haven’t been as generous.
I suppose if there were to be a wrinkle that is as good as I can see. The main issue with the solar cycles is that we base them on an average and that the peaks etc are very subjective (as is the average) and the link to prices is obviously more curve fitting than verifiable fact or evidential of cause.
The risk of a major bear market in stocks is now higher than it’s been in years.
That, at least, is the message of an indicator that keys off the amount of risk incurred by the top-performing advisers. On average, the top 10 finishers in the 2014 Hulbert Financial Digest performance scoreboard recommended portfolios that were more than three times riskier than the stock market itself.
That is one of the highest levels to have emerged from the Hulbert Financial Digest’s more than three decades of performance tracking.
Addendum: From the HFD article today in MarketWatch
Interesting Gary, thanks.
John, good to have you back. It is nice to see like minded traders sharing thoughts. It is hard to be short in this environment (although getting easier by the day).
To your nice macro indicators, I would like to add materials and credit spread:
http://dv-dend.blogspot.com/2015/01/divergences-abound.html
I am in cash waiting for price to show direction on Monday. Seasonals and Lunar Phase are up next week, Lunar declination is down all weak, and Lunar Distance is up starting on Tuesday. So mixed week as far as Lunar Chord (Phase, Declination, and Distance) and Seasonals are concerned. My inner gambler says lower prices next Monday and Tuesday, and higher into end of week. Won’t go short until price closes lower than Friday’s close tho.
Looking back on a 100 year chart of sunspots year five managed to be at or near solar minimum in most of the decades of the last 100 years. Could that account for the outsized gains recorded during the year fives? Sure year there are other reasons (presidential pre election year, etc) but the solar minimum thing is easy verified by looking at a sunspot chart.
Concur. In my Trading The Sun PDF I try to show that the Decennial cycle is a red herring due to the way the solar cycles have fallen the last 100 years (solar maxes all fell between years 7 and 0).
Further evidence on Friday that gold and gold stocks will not collapse when the broader market collapses as is the commonly held belief.
And many analysts have shamefully driven investors out of gold stocks at a time when the should have been buying. Of course most of these same analysts were talking of higher gold prices in 2011.
Absolutely shameful!
http://stockcharts.com/h-sc/ui?s=GDX&p=D&b=5&g=0&id=p72024066770
We are heading for a high on Tuesday or early Wednesday morning. So expect a low this Monday for some more up movement.
After Wednesday it will be down into jan 22nd for a deep low. After that a recovery into early February.
Gravity long term is up, so markets should go down. In 2052 we see the perigee extremes of this century. Assuming lunar cycles take 19 years, subtracting 38 (2 cycles) from 2052 gives 2014. So we are now witnessing the end of a 19 year cycle. This should bring at least some volatile years.
First real cycle low around march 26. Long term down into 2017.
Everything I say is based on gravity.
Cheers,
André
Thanks, Andre’. It is refreshing to have a longer term perspective when it comes to electrical (sorry), gravitational effects on the markets which can be viewed as a subset of investor psychology or mood. It is remarkable how apogee and perigee and its effects upon the tide levels effect stock prices on a monthly basis. There seems to be a monthly cycle of sell offs during and after apogee, with a steady rise towards perigee and then a smaller sell off a day or so after perigee. This might seem odd however it is easier to understand when printing a tides chart and seeing how closely tide patterns match lunar distance. I don’t fully understand your methods of determining gravity however the Jan 22 date matches high tide for the month. Would you be so kind sometime to give a reference to the data that you use to determine gravity? It would be very useful to add this as an element of a market timing system.
Betafish,
I built a new gravity system that calculates gravity from the actual distance of the moon AND the actual square between moon and sun.
Apogee and Perigee are great for multi year trends. Short term, apo/peri can’t time right, as the angle between sun and moon is constantly changing. Remember we have neap tides at the squares. The timing of the squares relative to apo/peri is changing all the time as the elliptical orbit of the moon around earth is spinning. Look at new moon at perigee; it makes a cycle of 413 days. As the orbit is elliptical, the hook speed is variable, so different every single day.
So the reference you ask for : look at the sun moon angle. To be honest; even then it’s a major step to building a system as the true relative impact of sun and moon are very important. And the numbers you read are averages when in reality the impact of the sun weighs more when the moon is at apogee.
I still look at tides and I see the same; I have a local extreme high in the tides the 22nd, perigee the 21st and the new moon the 20th. But my theoretical gravity calculation gives a lower high in gravity, implying a higher low the 22nd and pushes the peak in gravity towards February 3rd.
As apo peri isn’t useful for short term timing, gravity and tides are useless for long term timing. The intermediate level are the lunar declinations. Right now long term apo/peri has turned down, meaning markets must go down. Mid term declination gives a High December 5th and a low march 26th.
With two major gravity cycles down, I doubt the markets can make new ATHs.
Anyway January 13th will be a significant high and then we go down into the 22nd. multi week gravity will give cycles all the time, but the dominant trend is down.
January 30th we have an earh-mercury conjuntion. This could be a magnet. So we probably go down into early Febrary in 3 waves; down 15 – 22, up 22 – 27/28 and down again for a low February 3/4.
Remember what I said earlier; we are seeing the turn in a 19 year cycle; the first time this century. This is a major development. The next relevant period for analysis should be seen in years; not months.
I have been quiet for a while as I needed to focus on gravity. Now this is done I will post more regularly again.
Cheers,
André
André, Thank you for your analysis. Do you perhaps your own blog? It would be great to follow you directly.
Eris,
No; don’t have my own blog. Just developed these tools for my own trading. But I post here to offer you all some help.
Cheers,
André
Good to hear from you again., thanks
The same thing happens at EVERY major top or bottom. Investors by and large acknowledge the extremes but very few expect the run to end anytime soon and are looking for either, one more new high or low, or a runaway market to new highs to ensue. And this is most often despite prices already being at overstretched historic extremes, as is the case now.
I just read that not ONE single mainstream high profile analyst expects a lower market by end of 2015.
Think about this. This is the seond most overvalued market in the last century and.a case can actually be made for it being THE most overvalued ever! So WHY should I anticipate higher prices when history tells me that the run is all but finished?
Certainly there is the argument that price should be your guide. Then again that argument can be countered by risk vs reward, but more importantly by history.
To wit here we are once again, with many investors acknowledging the extremes we are at, yet they still hold on to the belief that we have further to run.
Is it a case of when things are going well people can’t imagine how the situation can now change?
I have been surprised myself how long this market has taken to eek out a top. I shouldn’t be because history shows that tops are not created in a single day or a week or two. Most take several weeks if not months before sustained falls begin.
History also shows that markets can reach extremes beyond rationality. This market though has now fulfilled all that criteria and more.
Am I now to believe that this market can go on to break all previous historic valuations and extremes or does it do what history tells us it will do and turn down hard at any moment?
I have no doubt that we have topped beacuse I refuse to believe that history will be any different this time around.
Investors will take time to climb aboard the “southern express” but as we take out the previous lows one by one the panic to climb aboard will increase until it is hurtling down hill and all seems lost.
At some point I will be a buyer again, but not until we are at the very least 60% lower and possibly more depending on how bad it gets.
I have said it before and I will say it again. Many investors are going to get trapped in this calamity when it begins. There will be no exit, no escape. There will be ZERO bidders!
May not happen until presidential election is over in 2016, November. If market were to fall precipitously it wouldn’t be good for either party, especially the Democrats who are barely holding on to their majority. Politics may save the day at least as far as a near term market crash.
Agree completely with all that Allan
Emotion, the extreme thereof marks the top/bottom. When I look at Put/Call ratio and see that the 100 SMA has been steadily increasing since 2014, it says put buyers (skeptics) are resilient in their conviction that every 5% pullback would turn into a 20%+ correction. Hence, the perpetual short squeeze. We have shallow pullbacks and BTFD because there are just too many bears.
The October pullback featured $CPC at 1.5+ and $SPX dipped below 200 SMA after 500 trading days, a record. Buyers were rewarded 10%+ gain in less than a coupler of months. This result was predictable based on history… and more gains should be ahead.
Russell 2000 paused in 2014 and it rhythms with 1994. It may perform well in 2015 just like l995. Just watch if the inverse H&S going to play out.
In late March 2000 (when every Joe and Jane were buying), $CPC 100 SMA topped out at 0.45. Currently, it is trading at 0.97 and remains at an elevated (crisis) level similar to 2008.
My point is: keep an open mind. $CPC behavior says we could still be in the mid point of a big bull run as far as the US market is concern.
This is the most hated bull run.
I am more excited accumulating oil. we are witnessing a major price shock in oil…effectively planting the seed for a reversal down the road. If an individual has a long term plan and commitment (say 20 years), buying oil is a no brainer if one exercises money management control..
Oil certainly is cheap. You aren’t buying into the meme of cheap or almost free energy going forward (hydrogen fuel cells, lithium ion batteries, or more out there tech ideas)? The new Toyota Mirai is being introduced in Japan and other markets this year, runs on hydrogen, and while prices high will probably lower in the years to come.
Be careful with oil Newt, as the pricing will be entirely different (and much much lower) in a revised global monetary system where external national debts are settled, rather than tens of trillions of debts building up as non-settlement.
Briefly, dollar pricing will end, to be replaced (IMO) by Euro pricing, and those prices will simply never get back to the $80 -$100 level. Things aren’t ever going back to normal, this is a major planned transition.
Can’t agree with the most hated bull run. Investors Intelligence sentiment, NAAIM, Rydex allocations, household allocations, fund manager allocations, investor leverage and credit balances: these are all at new records or equal records. Have looked at CPC, the 200ma changed course in Aug 2000 and in July 2014, which I see as similar developments.
Yeah, pretty much what Allan said….
I’m not sure I’d look for a 60% drop, but Friday’s close sure did look weak…
As Allan mentioned, seems like everybody is looking for at least a new high, if not much more, and I suppose I’m also one of those looking for a little higher move, if for no other reason than to run all the stops at new highs…
That said, I’m at 127% net short, and was looking to add to that at higher numbers… But after Friday’s action, and after looking through charts last night, I’m less sure I’m going to be able to get those new shorts on at the higher levels….
GL
Chopfest in stocks. Post-NFP down move in SPX on Friday hardly a game changer just yet, as SPY tries to fill a gap and successfully defended 20DMA and 50DMA. It looks to me we want to hit 2075 which is the shoulder resistance. Meanwhile, the winner is clearly Gold, breaking above LT trendline, and is ready to break higher with positive January seasonality continue to provide the tailwind. I added to GLD position on Friday, and also looking at GDX which has a very compelling bullish setup after breaking above key swing point on the weekly, closing above 20WMA and MACD crossover – conditions which preceded previous upswings.
https://davinny.wordpress.com/2015/01/10/2015110-gold-tide-has-changed/
Thanks all, new post is out