
Alternative 1: The Bull Is Safe
Stocks are in a new secular bull market. This cyclical bull began from the low in 2011. The economy is recovering and we need a series of rate rises before the bull’s termination is likely. If so, the bull, right now, is faced with these:
1. Over 80 weeks levitation above the 200MA on SP500
2. Over 80 weeks with no 3% change
3. Biggest ever cluster of extreme Skew readings over the last 10 months
4. Biggest ever cluster of extreme Investors Intelligence bull-bear spread over the last 10 months
5. Lowest ever net investor credit and highest ever margin debt to GDP ratio
6. Highest ever Rydex bull-bear asset spread and cluster of fund manager equity allocations
7. 8 months of ‘risk-off’ behaviour in HYG:TLT, WLSH5:GDX, XLY:XLU
8. Best performing sectors being those defensive sectors associated with a market peak
9. Averaging 4 valuation measures the market has reached a par with the peak of 1929 in terms of expensiveness
In other words, this market needs a reset to continue. The duration and magnitude of these indicator extremes mirrors 1987. The market is a mean-reverting mechanism and like an elastic band it will snap back. Therefore a significant reset is on the cards, and every day it has gone without a washout correction has stored up a major correction when it occurs. Therefore, even if the market were in a secular bull heading much higher, it is over-ripe for a cleansing. The maturity of the divergences and readings suggest the inverted geomagnetic seasonal downtrend from August to October is the most likely window for that to occur. The secular bull break outs post 1930s and 1970s also saw a reset shortly after breakout.
Alternative 2: The Terminal Melt-Up
Stocks, although stretched, are heading for a blow-off top. The kind of unsustainable trajectory that everyone knows can’t last but no-one wants to miss out on. A crazy rate of ascent to crazy valuations, and then ultimately an even more devastating pop than stored up currently. Like the Nasdaq in 2000, the Nikkei in 1989, the Dow in 1929. Although neither a demographic peak nor an economic boom peak like those three events, the combination of QE, low rates and a goldilocks economy (neither too hot nor too cool) provides different ingredients for the same kind of mania result.
(Understand, I disagree with a lot of what I am writing in these first two alternatives, I am just presenting the opposition).
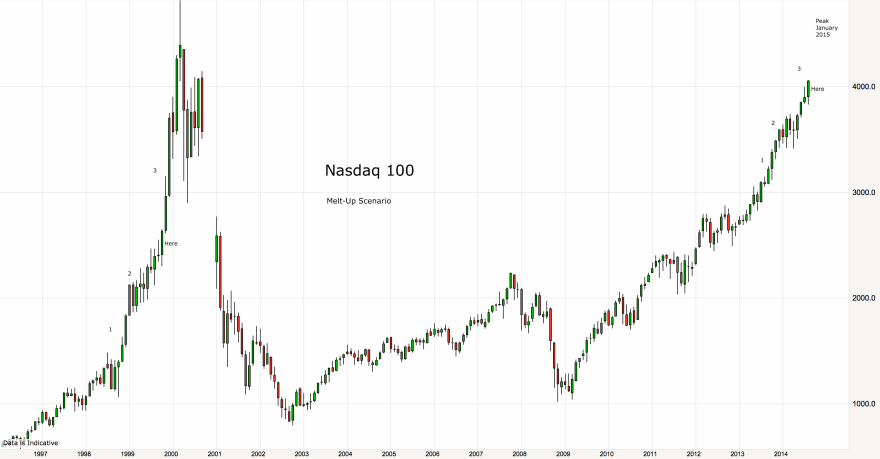
The most likely candidate for that currently is the Nasdaq 100, which is the most parabolic of the indices. I’ve labelled the chart to show a potential mirror with the action in 2000 and where we might be:

Label (1) in both periods shows a first burst to what participants expect to be the peak, only for a running correction (2) to give way to an even steeper final termination leg higher (3). 5 months of crazy gains from ‘Here’ would take us to a January 2015 peak, which fits well as the other inverted geomagnetic seasonal peak of the year. If the index did break into the kind of terminal velocity of phase (3) then, make no mistake, it would be the biggest stock market mania ever, because to accomplish it we would see the highest ever valuations, leverage, allocations, sentiment and more.
Apple is the dominant stock in the Nas100 and as shown it has just made a potential breakout on the monthly view above its 2012 high:

If Apple can finish August by consolidating this breakout, then it could be set for further gains in clear air above, leading the Nas100 higher. If Apple is repelled this week, it would keep the double top option in play.
Alternative 3: The Bull Market Ends Here
As you know this is my favoured option and I have detailed my case for this many times over, so if you are new to my site, read back through a few recent posts.
This is the alternative to which all the evidence fits the best. Valuations and demographics show us to be at a cyclical bull peak within an ongoing secular bear, whilst the list of indicator extremes and divergences are features of a major peak, rather than anomalies in a bull market.
In the same way as for alternative 1, the stretched elastic band that those indicators depict means a period of heavy selling will feature in the erupting bear market, and the maturity of the indicator readings and divergences imply their satisfaction is likely very close at hand, in the period Aug-Oct 2014. Therefore, I would argue that alternatives 1&3 are similar in offering likely >20% bear gains imminently, whilst alternative 2 is the threat to my bearish stock-indices positioning.
If alternative 2 fulfils, then, because of the demographic headwind, it will require all-new levels of leverage, equity allocations and skewed-positioning. In thin volume, like in 1937, a smaller group of participants has been able to rally the market to the current level by taking Rydex and fund manager allocations, margin debt and net investor credit to beyond those previous major peaks. In all 4 of those measures we already exceed the biggest mania of all time, 2000. So, with less people available to buy the stock market, the only way to achieve the current market highs has been to stretch individual positioning and leverage to record extremes.
All the big blow-off top stock index manias of the past required leverage to rise into the peak. Therefore, with margin debt having so far peaked out in February, one important development would be that leverage peak being taken out. Tying in with that we would see various speculative targets break upwards. Expecting margin debt to be down in July, due to indices being down in that month, this last week in August becomes key, and we enter that with various investments showing obvious lines in the sand.
If IBB’s bubble has burst then it should tip over here under negative divergence. If not, it should break upwards and re-take the March high.

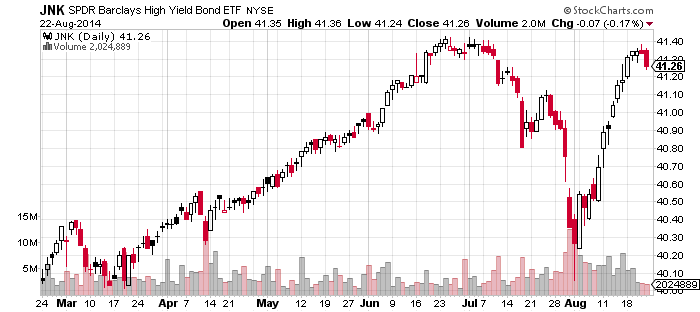
If JNK’s collapse in July was a true warning, then it should break down again here. New highs would invalidate.
The SP500 will either tip over here with a marginal higher high on multiple negative divergences, or it will ignore those indicators and cement an upward breakout.

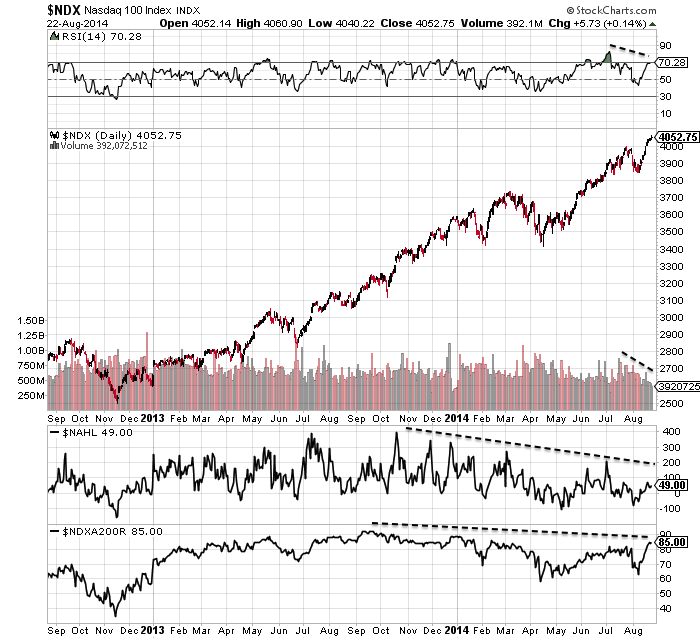
The Nasdaq indices are also operating on very clear divergences:

I believe the next 2 weeks will be highly revealing. It is the lunar negative fortnight and indicators argue for a retreat. DeMark sell signals were reached at the end of last week, whilst today is the new moon and the last likely seasonal peak of mid-year. If stocks retreat from here it will make the SP500 breakout a fakeout and Dow will put in a lower high than July. The February/March peak in speculative indices and sectors and margin debt will likely be maintained. All those indicators that have been screaming ‘correction’ will move further towards validation.
If, on the other hand, stocks rally this week and next and various speculative measures break or cement upwards, then the melt-up alternative will gain weight. At that point I would consider stopping my positions, moving aside and waiting, because it would put great doubt on the epicentre of the top as the speculation peak of Feb/Mar with margin debt, IBB, SOCL and RUT.
Some further charts to consider:
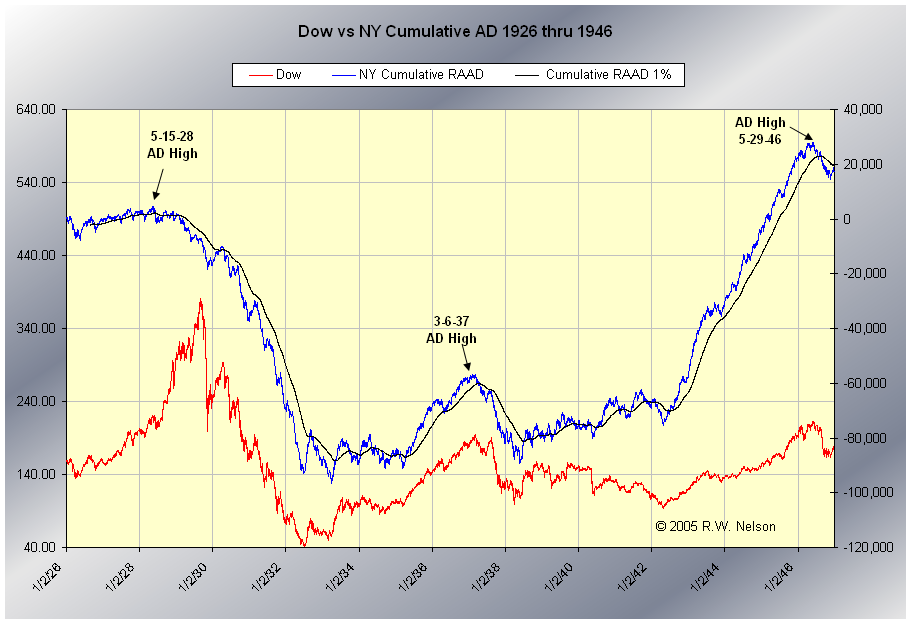
The Nasdaq chart above shows advance-declines have diverged. But NYSE advance declines continue to rise in line with the SP500. Does it need to diverge too before we see a proper correction? The chart below shows a divergence into 1929 but a simultaneous peak in 1937 and 1946. With other breadth divergences in play in 2014, I’m not convinced it does.
The Sornette bubble end flagged in July 2014, but the peak nominal level of DS LPPL reached so far is lower than for previous major events:


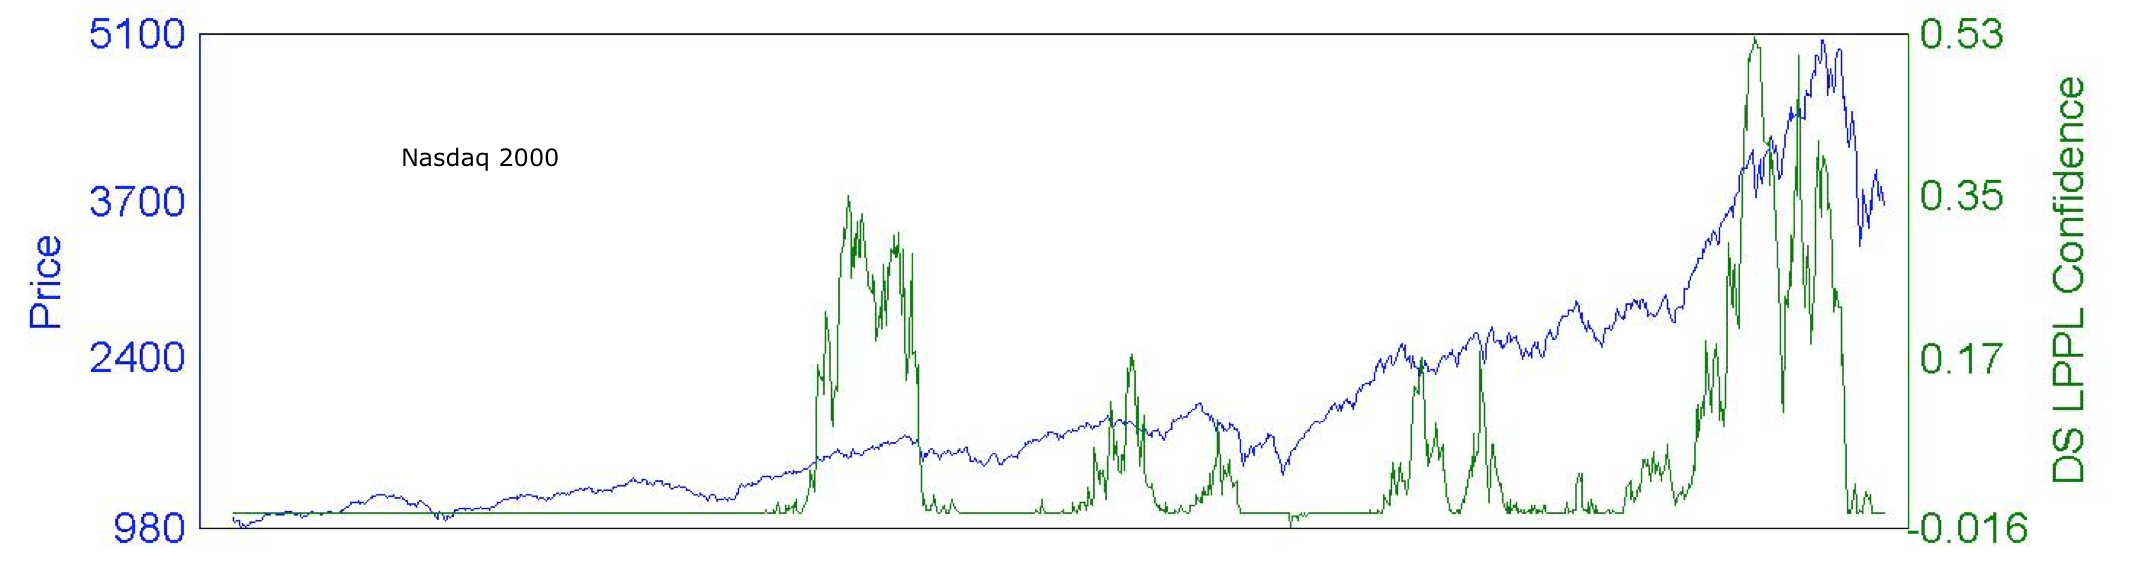
As the three historical charts show, the ultimate market peak was always accompanied by a spike in DS LPPL, just not necessarily the highest spike. That means either July was the ultimate peak, or stocks are heading higher and we will see another spike in DS LPPL ahead, probably to a higher intensity level.
Is the global economy chugging along nicely? Germany, Japan and Russia GDP readings came in negative for Q2, France flat. China’s housing market is dropping sharply:

Global leading indicators predict a growth peak at the end of Q3. Therefore, although the US has produced some recent good data, that may be about to roll over, and data from the other majors in turn worsen. Deflationary trends are strengthening again in 5 year break-evens and in commodities:
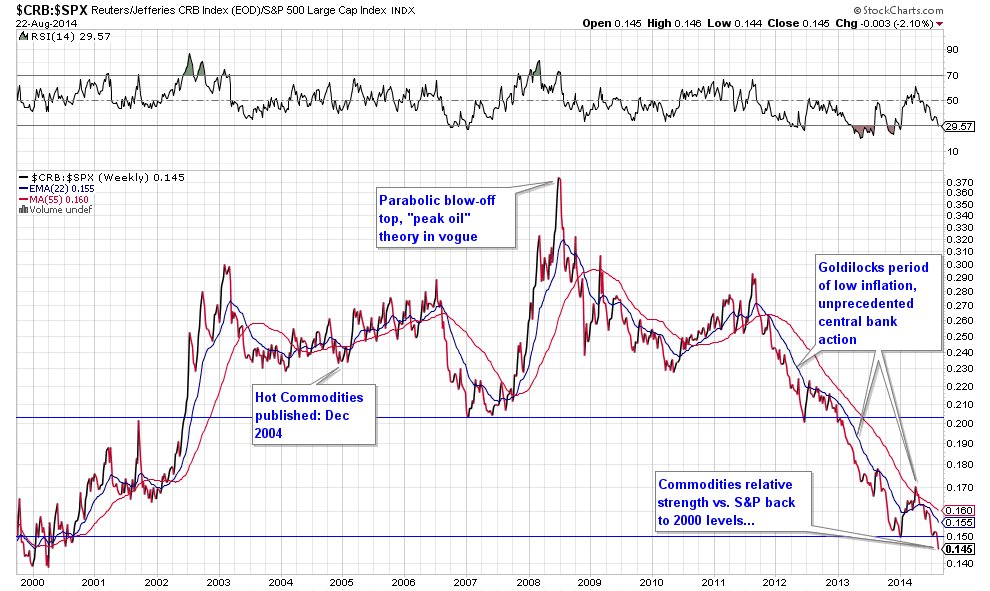
With Europe on the cusp of deflation, waning commodities prices may provide the tipping point.
I would argue that those who believe we need to see a series of rate rises before the bull ends are failing to see that we do not have the luxury this time. Rate rises help kill bulls because they help choke off the economy. The global economy is too weak for rate rises, the choking is occurring without them.
Lastly, there has been some debate about the validity of the high CAPE valuation for the market. So here is 5 year, rather than 10 year CAPE, produced by J Lyons as an alternative:
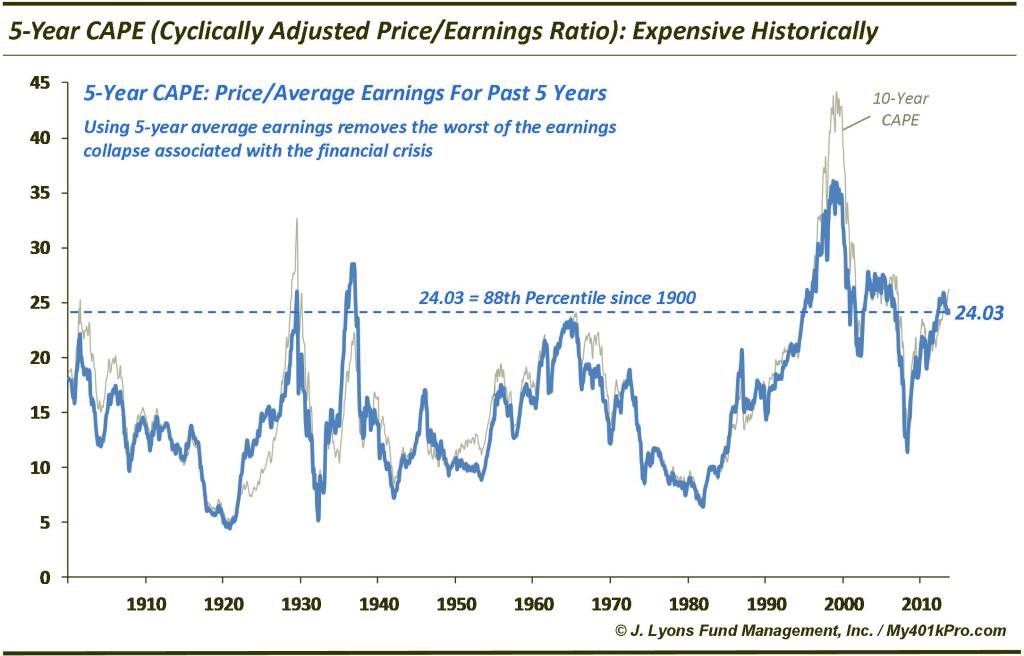 It still shows us having reached the same overvaluation as the 1929 peak, and this is echoed in Doug Short’s aggregate of 4 valuation measures:
Which brings me back to alternative 2, the melt-up. Can we really challenge the biggest mania of all time without a demographic tailwind nor a booming economy, and from already-record leverage, sentiment and allocations? I find that extremely unlikely, but if we really can, then we surely equally see the biggest crash of all time as that is unwound.
Instead, the evidence supports us being in a 1937 peak to the 1929 demographic/economic peak (1929 being 2000 in this case). 1937 did not see a parabolic blow-off, but rolled over with sufficient disconnect between valuations and the economy.
The evidence still supports us being here in the last gasps of a topping process that began Dec 31st with a peak in risk, then followed with a speculation peak in Feb/Mar, then a final peak in July. European indices appear to have decisively broken down, and US small caps are some way from their highs. The Dow broke down from its 2014 wedge in July, and volume has been very thin in US equities on this August rally back up. I have outlined my lines-in-the-sand above and see the next 2 weeks as the crucial confirmation or invalidation.

There is a week of geomagnetic disturbance predicted from 26 Aug to 1 Sep, adding to the mix.
An alternative option of the bull market continuing after a small siesta (7-10% correction) after a move to SnP 2000++ seems more viable at this point.Perhaps as Jigs mentioned Alibaba IPO in the next few weeks may indeed be the turning point for a 7-10% market correction.
I don’t see any middle ground. 7-10% correction would break everything technically, and the record stretched indicators both in time and value argue for it to washout much deeper under such technical breaks (per second chance peaks on analogs).
John my longer term targets for DOW are similar to yours i.e a retest of 2009 lows and much more below that.But i feel that breaking point is atleast 12-18 months away and this upmove on DOW is likely to continue after a 7-10% fall which could start anytime in the next couple of weeks or so.A nice fall would cool down things a bit and also act as a foundation for the next move up after some consolidation.This thing is not going to end without a nice melt-up sometime in end 2015.
When the 4,5 year lunar cycle turns, the market can make one more swing, but it can’t ignore this trend for a long period. Once the market turns with the lunar trend it must be at least 3-3,5 years down. So my best guess now would be 4 months down into November, and then 8 months up into july 2015. And then the big decline will start into 2018 at least.
This would fit Viks’s 12 month period.
That would perfectly be in sync with my scenario Andre.Though price wise DOW may not be able to make great headway, perhaps about 15% higher than the one we make in the next couple of weeks.
Viks,
I fully agree. The last swing up will be without the support of the lunar cycle – and now the lunar cycle will be in sync with John’s divergences – so I don’t see a lot of room upwards. Who knows; it could be a double top. Last waves can truncate or throw over.
I take it your top out last Tues and low tomorrow is off the table Andre? ie the tides were wrong this time?
Marketguy15
My Sunday post explains.
Cheers,
André
I must’ve missed it Andre…do you have a website you post one? tia.
Well folks if you are heavily in the bear camp
currently, then today or tomorrow would appear
to be pivotal days.
Reblogged this on thedarklordblog and commented:
Thanks John. Lucid and well researched as ever.
The “lower high” soon to be produced in The Nikkei supports the near term view, and its my feelings that the current geopolitical backdrop is NOT supportive of the blow off top scenario.
With Yen driving the rally in the U.S ( via Carry activity in USD/JPY ) the wheels come off in Japan first, just as they did back in 2007 a full 6 months before western markets topped and fell.
Yen futures are as oversold as they’ve been all year with USD topping out here at solid overhead resistance.
It’s “text book” lower from here…..and I favor scenario number 3.
The divergences in risk measures, such as HYG:TLT, are 8 months mature and under previous such divergences we saw corrections of at least 17% (2011, 2010, 2007)
II sentiment two extreme peaks and the divergence between the two aligns with 1987, 2011, 2007: i.e. at least a 20% drop
The readings and progression in both Rydex assets and margin debt position us in Q3 2000, i.e. at the end of the topping process. The SP500 lost 18% from there into the end of 2000 and then continued in a bear.
The last such period of levitation above the 200MA ended with a 19% drop in 1998.
These indicators and more tell the same story: we are due a correction of around 20% or more. If not, either by time (it doesn’t happen in 2014) or by price (a shallower correction), it means there are a lot of historically reliable indicators with different angles on the market that are going to fail or print anomalies this time. For one indicator to print an anomaly, OK, but for many: I don’t buy that.
So, if we are going to see such a sized wash-out in 2014 (circa 20%) then in turn the decline in both valuations and margin debt from current levels do not have a historical precedent of coming again. Such sized falls from here mean bear market, or, again, print a historical anomaly.
Then there is the solar maximum, which is on the wane since around Feb/March time, and all recent solar maxima in the era of global, comprehensive, instant, have all delivered the market peak within 5 months. So the July peak, with the Sornette bubble end flag, as the last general peak, fits.
Draw it all together and either a mild correction in 2014 or a higher peak in 2015 implies a variety of indicators with different angles on the market all fail.
Sounds bang on to me.
Hello John,
where do you look these geomagnetic disturbance predictions.?
http://www.swpc.noaa.gov/ftpdir/weekly/27DO.txt
There are 70 SURVIVOR stocks dating back to 1/3/2000 that remain in the NASDAQ 100…the PE on these 70 are well below the peak of 2000…the EPS today is way higher than 2000…19.86 (excluding APPLE…since it carries sooo much weight) vs a mere .86 in 2000 at the exact peak…there is still plenty of upside before we get to comparable peaks…the one fallacy is NOT USING THESE SURVIVOR STOCKS, and forgetting the new additions and their weighting skew the charts…sometimes terribly…look at most any etf…and the top 10 holdings (From YAHOO FINANCE)…and you can see, SLB be almost 20% of the weighting …going back to survivor stocks remaining paints a much more interesting technical picture…the distortions are quite significant in many cases…FWIW
Keep in mind, the three drivers are still…interest rates, inflation and earnings(yes, I know…I know…the buy backs…)…and yes, the rubber bands are stretched…the longer it takes, to start, the deeper and longer the depth…we have the pending correction…then a final blow off top…then, the peak to trough, will be…nothing less than a bears delight…
John, sorry but I fail to see how you can make that assumption. Afterall if you are going to use that approach why not compare what was in the DOW in 1937 or 1929?
Furthermore, this market is by many indications more stretched than 2000.
Forget about the 1937 parallel At least for now. The 1937 recession was caused by a policy mistake (tightening too soon) due to the urge to normalize interest rate. Current FED policies makers emphasize lessons learned from the past.They have walk their talk so far. Most importantly, the mass believes central bankers are in control. That’s good enough for the bulls. Bears can’t win in this current environment..
Well. until and unless we see policy mistakes being made, any market corrections should be shallow. Bears (it is fun to be one) must be patient. Without rate hikes, the economy must deteriorate significantly and very quickly for the market to sink…amid likelihood of further loosening by the ECB
herebelow is Economist’s article on the 1937 policy mistake.
http://www.economist.com/node/13856176
Fed is winding down QE: that’s tightening.
I must say that bears have shown very little effort to protect the previous ATH and even possibly SPX2000 now.
Im agreement with John about how the end of this month plays out is key. Im close to scapping the idea of a correction and the SPX going to a target of 2150.
The trade volume is absolutely “enemic” with divergence literally “everywhere”.
Everything is up on every “decreasing volume” so..bulls? bears?
Everyone is outside of their cubicles thowing frizbies with the dog.
Sept will bring volume in the expected direction – that being lower.
you meant to say “anemic” (a decrease in the amount of Red Blood cells)
or……”enemic” ( combination of “enemy and anemic” ) that being the volume.
Yes of course….thank you for the correction.
Haha where I come from it is anaemic 😉
2,000 on the SPX
biotech made a 2nd lower high which is bearish for the continuation of the mania. USD/Yen made 2 touches on each side of its multi months trading rectangle. Can be reversal or continuation. Would lean for a trend reversal.
This is probably the peak but I am 100% stopped out of my shorts. Good luck guys. I will catch the next ride down. I don’t need the unlimited loss potential if this is parabolic up, but I would not lose too much if it crashes now as it always starts slow and give second chances.
Good luck guys. I know this is a sign of a top, but at this point, I don’t care too much of missing a few percent. Hopefully this information is helpful to you and keeps you in your shorts — I don’t have the deep pockets and guts of most of you.
Reversal in USD/JPY no question along with everthing else JPY related now seeing their reversals of this correctional rally.
Currencies lead…..Japan being the source of 200 billion per month so….I continue to just follow the money ( and soon to be contracting money) around the planet.
JPY converted to USD to continue the American “gong show” – “proxy BOJ” as the debt of Japan is primarily held domestically, so the printing has little impact on “sovereign debt obligations” etc…
Patience has been the key here…as this continues to go on…and on…and on…
would not be surprised to see a wild reversal shortly. So much one way bets placed here on margin across equities, FX, short bonds, long junk bonds, long real estate, long corporate bonds, long central banks fixers etc. Chinese real estate is reversing which John pointed out above which may have a more material effect on dampening animal spirits shortly. After all the Chinese were leading the bubble and its burst in precious metals in 2011 and may bring the party in US/European stocks to an end as well?
Either a reversal about here or this will melt up
in parabolic fashion in my view.
As Jesse Livermore noted decades ago, round numbers are attractors, so SPX 2000 had a certain inevitability about it. Now that’s done and all the gaps on the upside have been filled. It’s also worth noting that very strong advances like this rarely run longer than 13 days, and today is day 12. It’s also worth noting capitulation is in the air; traders are talking about “letting their winners run” and SPX 2150 and. Bears are questioning their positions. These 3 factors suggest to me this is a near-term top. Also note that there are 8900 calls on the VXX (short-term VIX) volatility, i.e. bets that volatility will rise, and 18,520 puts, i.e. bets that volatility will decline from here. The boat is fully loaded with bulls expecting lower volatility and higher stock prices. That’s a set-up for a tradable top IMO.
Commodities sinking – negative world trade growth ahead?:

2000 instead of 1987? Even more significant! Today would be ideal for a top, new moon. Crashes sometime start on a new moon and have a sharp correction to the next new moon, Sep 24. It then rallies to the full moon (2nd chance top) which is Oct 8, total lunar eclipse. Then the crash begins, partial solar eclipse, Oct 23 plus it is Oct. New moon to new moon seems to be impt, and the 2nd chance top seems to occur near a lunar eclipse a lot (Oct 8). Nothing bearish seems to work any more though!
James Flannaganof Gannglobal says WD Gann’s Master Time Factor (MTF) is the 60 year cycle. The 30 and 60 year cycles are remarkable. One just looks back 60 years and major tops and bottoms parallel. Commodities topped in 1951. Add 60 and one gets the recent top in 2011. A last chance top was suppose to be Apr 19th, 2014. Pretty close. Commodities per this scenario should be down through Dec, 2015. I mention this because I think the most probable chance for a bear mkt is deflation. 18 more months of a commodity bear fits. Is deflation possible? Just think of capex in mining. In the early 1990’s, it totalled 5 billion. It reached over 150 billion annually @ 2005-2007. To pay for all that, means they have to produce. Same for high farmland prices and new equipment, as farm commodity prices have crashed.
how would one square this view with the recent sharp rises in many steel issues and the year long rally in major US aluminum shares or the fairly decent performance in copper shares (presumably fwd looking)? As too overinvestment in mining capex –that’s clearly being unwound per BHP’s recent admission of defeat via demerger? With respect to Gann 60 year cycle there is a rather good discussion on Kondratieff Cycle archived on this site which you might enjoy. Cheers!
Good point blaze. The early 1950’s saw a great bull stk mkt really get going, a 20% drop in commodities, mild but consistent inflation, steady rise in interest rates from very low levels like now, and a strong economy as the world rebuilt after WWII. The strength in industrials would indicate an almost exact replay of the last MTF 60 year cycle. I am judging that due to demograpnics, debt level, and world doesn’t need rebuilding, it will be a different cycle this time. Ie, the 60 yr cycle represents a cyclic turning pt, not just an exact replay. So far the approximate replication has been more correct than my judgment as to the stock market.
commodities sinking isn’t a good sign for bears, every time we leave a commodity peak stocks skyrocket from what I can gather. Also AAPL and CELG look really strong and are breaking out above ranges, I’m definitely not confident in my September decline bets right now….
OMG, Kurt. 1st, Blaze points out a deficit in my stock mkt bearishness (known to me). Now you. As I always try to do, I go back and look at the data. So commodities peaked in 1781 – bull mkt. 1815 – big bull mkt. 1864 – big bull mkt. 1920 – terrific bull mkt. 1980 – you got it another great bull mkt.
Another bullish factor. The absolute relentlessness of this mkt in face of all the incredibly “bearish” correlative indicators. Being the geezer that I am, the take off in1982 was similar. It is what Briese says in COT Bible, ignore sell signals in a bull mkt! Well, I have go do some real soul searching. Thanks for the input.
John, this may have been you best post so far. Thanks for sharing your research.
There is one more variable to the mix: market volume is now driven by computer trading and it seems that this having some effect on prices. Last dip was quick but quickly recovered. I think there is a case four a forth alternative: 4. Computer driven market tops differently than historical market peaks.
good point. We really are in unknown territory here. We’re all trading against computers. We have no historical data to look at for computer trading (other than the past decade or so).
The $CRB commod index has pulled back perfectly with the inverse and obvious correlation to the stronger dollar.
I see this as a “higher low” on weekly charts of $CRB and a pretty good spot to start getting long….if of course you are of the mind set that The Fed and U.S Gov “cannot possibly have a strong dollar”.
Fed to kill USD – no matter what.
Commods to surge in coming years.
This is the first reasonably objective article that John has written in quite some time that at least takes into consideration some alternate scenarios, rather than stubbornly weighing all-in 100% on a bear only scenario.
I mentioned about one month ago how the moon went apogee on Jul 28 at the furthest distance away in a 3-year range (2013-2015), and that the market would experience a brief dip that would amount to no larger than 10% and more likely closer to just 5% over two weeks. The reason was an analogy to the late Jan 2014 period when moon was at apogee for the 2nd furthest distance and it dipped around 5% during the next two weeks into early Feb. The low came in at Aug 7 and the correction was only around 4% making a compelling entry point anywhere from there leading up to the Aug 11-12 range.
What did the market do previously after it hit a Feb 5, 2014 low to end the two-week dip? It melted up 120 points for essentially the next 12 TD’s from the low to form a new 52-week high unbelievable to most participants. What has occurred so far from the present action from the Aug 7 low? Yes, a 100 point melt up in 12 TD’s (as of today) from the Aug 7 low and also to a new 52-week high and likely also unbelievable to many too. Today’s range is essentially a fractal of the trading activity occurring earlier this year.
If anyone was short then it would have been prudent to close all shorts prior to mid-Aug 2014 and at the very least go flat.
What might happen later this year? If history is any guide and the same fractal continues to play out, it might stall today and consolidate for the next week maybe dipping 20-25 point range in SPX. If so then that implies possible 1985 area in one week (measured from 2005). But bears beware because it would proceed to rally/grind 50-55 points upwards in volatile, choppy sideways worry type action implying target approaching closer to 2040 by early Oct. Then it is almost guaranteed that negative, bearish sentiment creeps in the media in early Oct about possible Oct crash time and the markets will likely dip and probably below the previous 1985 support to around 1960 within two weeks. If this level holds then this would be likely the LAST great opportunity for hard core bears to CLOSE out their shorts and either book short term profits (from 2000+ levels) or take your lumps and accept your losses from earlier positions BEFORE YOU LOSE YOUR SHIRT!
Because the market is poised to rip substantially higher towards 2150 before the end of 2014 after this one, last dip to near 1960 in mid-Oct. This is what the fractal implies if it continues to follow the pattern. It is not worth shorting this insane market to capture maybe 50 points on the downside when you can easily get burned for 100, 150, or 200 points going the other way. It is much easier to stick with the trend and let its power reassert itself during periods of weakness when it dips.
Steve, don’t take this the wrong way but why is it that only John must put forward an “objective” article?
Afterall you seem pretty set with your conviction of market direction, should John be any less so, especially given his relentless research?
Objective analysis is a necessity especially when the markets have surged to new 52-week highs three times now in 2014 (Mar, Jul, and Aug) since end 2013 high (at 52-week high back then too). Each new interim high occurred after an impressive rally from a big dip that had temporarily declined below the 20-week MA and each time bears were relishing the fact that it would be the market reversal. Bear markets typically do not act this way. If one was bearish then you need to reassess and listen to what the markets are telling you.
I am not saying that I necessarily agree with this market’s valuation but from my observation it appears there is a global flight towards the last perceived “safe haven” for funds of big players and that is USA equities. Because in all likelihood and prior TA, yada yada, there “should” have been a substantial market correction at least in the 15%-20% range in early 2014 … but it did not happen. So it would be prudent and wise to not conform stats and price action to support any one fixed theory such as a pending market crash.
Steve, I too have an upside target of 2150 to the end of this year but I also have downside targets too. In my opinion, what happens next two weeks will tell us where we are going.
John has presented a lot of indicators that are calling for a correction and this is what has me siding with a correction rather than melt up. However, we need to see support trendlines broken and not focus on volume and diverengences which havent worked since this bull market began.
I fear that expectations are too high on the downside if we do get it. Im looking at 1800 (was originally 1700 but bears have shown weakness in the last correction and defending previous ATH)
John nice to see you have an exit plan if the market does continue to melt up but I hope you are right and we get the waterfall declines.
Thanks Steve. I agree you have been right about your bullish views. I recommend you post more and also add your logic of moon-apogee for all of us to learn.
newt, I wasn’t making a comparison to 1937. I was making the case that you can’t say that this market has much more upside now based upon the survivors of the dot.com bubble and what they did in 2000.
I am in the camp who think there are very few reasons to either sell or buy the market. …I am waiting for a change in sentiment. Cheers.
To use an Australian colloquialism. “come in spinner”.
Once again we have opening hour up and then sideways. The retail investor is getting duped yet again.
This event could change everything, BUT not until we get the blow off top as Armstrong discusses. I see this transformation taking 1-2 years before earnings are affected.
And now you have CNBC spouting this “funnel market” will charge higher due to passing 2000 SPX. Low rates, commodity deflation, buybacks, good earnings Q2 all play a part.
http://armstrongeconomics.com/2014/08/25/china-to-replace-microsoft-apple-and-android-by-year-end/
If we look strictly at the pattern we see the drop to 1904ish was an abc wave 4 and now in the wave 5 up. The wave 5 up still needs a 20 to 34 point drop followed by one more impulse leg up. We should see the correctional drop start today/tomorrow and last for a few days. It should be an abc correction. Then our last leg up that should make one more new high. Perhaps it could achieve the 2015 to 2025 area.
just released http://www.nyxdata.com/nysedata/asp/factbook/viewer_edition.asp?mode=table&key=3153&category=8
Thanks. Margin debt down from June as expected, but net investor credit hits new low.
John,
Do you have any way of tracking:
1. Institutional selling/buying
2. Capital flows (international; by sector), but specifically from emerging markets and Europe into the US?
$USD intermediate target is 85, which provides a tailwind to US equities. The argument about “where will capital go” if you sell stocks is pervasive now.
Not specifically what you are after, but this monthly update might help with the picture:
http://fat-pitch.blogspot.co.at/2014/08/fund-managers-current-asset-allocation.html
S&P’s retreat from 2002 level (2001.95 exactly) reminds me of that turnaround moment in battle of Waterloo , with famous prince’ s Welligton shout: “Now, Maitland, now is your time”. You can watch bulls repulsed at
http://www.youtube.com/watch?v=oKmqRqY0RLg 1:51:14
Now seriously, 2002 could be top of impulsive wave that started last February and S&P 1750 may be revisited in Sep-Oct. There could be another attempt at 2002 today or tomorrow but I see it as rather strong barrier.
Gold may have chance to rally now but its overall weakness may indicate that its move to 1500 is corrective only.
http://www.zerohedge.com/news/2014-08-25/feds-mission-accomplished
Did you notice the bizarre headline in the Gallup poll referred to here?
“U.S. Investors Seem Unaware of Bull Market’s Strong Gains
Fewer than one in 10 aware that stocks averaged 30% increase in 2013”
While we are being told by other popular surveys that retail bulls outnumber bears by 30%, or even by a ratio of 3 to 1, according to Gallup only 41% of “US Investors” WOULD invest an EXTRA $10k IF they had it.
And 83% are nervous about investing their own money in the market right now!
Yesterday: New highs, but on second lowest volume of the year, and in the end reversal candles at the new moon – but only potent with follow through today/tomorrow, so let’s see.
Does it need to top out on the day of the new moon or a day or two either side acceptable?
Both normal
We won’t see a significant market decline until we get an inverted yield curve and/or a oil surge 40-140% YOY. That won’t happen this year so relax and enjoy the uptrend. The perm-bears are your friend as they keep the short interest up and provide the fuel for the next up leg.
Both those have been historically typical. However, I maintain the difference this time is the dominant theme is deflation not inflation. Hence falling commodity prices, and 3 times post 1989 Japan entered a recession without an inverted yield curve.
Agreed John, deflation is the real threat. The problem is that Central Banks are impeding recovery via artificially low interest rates, which are detrimental to restoring economic health and is slowly destroying the global economy. Have we learned nothing from Japan?
Most people can’t see how higher rates are positive but the fact is that they are.
The apo-peri cycle is down. Reedy Point gave a high on Sunday, Sandy Hook on Tuesday. After today all tides are in sync with apo/peri.
Yesterday we had the moon in Virgo and mars conjunct Saturn. This happening on the same day is remarkable.
Found this book : Astro-Cycles and speculative markets by L.J. Jensen. Says that earth signs are reversal timers : Taurus, Virgo and Capricorn. The high in july was moon in virgo, the low in august moon in Capricorn, both very sharp.
So, today last possibility for a weak leg up. Tomorrow should be down at least into September 3rd (moon in capricorn).
There was a daily reversal on the vix yesterday. Based on futures the bulls dont seem to care
Hi John. Thank you for sharing your thorough and insightful research.
There is an interesting article, “Are we in a bubble?” written by Dan Ferrera in the May Traders World. http://www.tradersworld.com/members/issue57/issue57.pdf
Wish you well. Perhaps some risk control measures to keep your powder dry for the real waterfall?
Closing my short at a loss. Bears have shown zero effort to defend SPX2000. Sliced right through precious highs and 1990s without a fight. SPX2150 looking likely.
Another day, another new high for the SPX.
Notice how bulls have control of SPX2000. Any attempt to move it below is being rejected. Only took a day for bulls to gain control. Given the assent from SPX1904, the fact that the market is overbought, yesterday had a reversal candle on both SPX and the VIX. Given all this, bears cannot even turn the indices red. I was expecting a fight at 1887, then 1991 and then 2000 but nothing from the bears.
If this was a ball game, and you are picking the stronger team, your technique would certainly work.
Thanks 🙂
Only thing that can save the bears is news from Russia. The market buys everything else – good or bad.
Unfortunately, what I thought was a second chance rally is proving to be a new high rally. Therefore, bears need to stay safe, and if they miss the peak, they still have a new second chance coming.
Dow is close to making a ATH or double peak if you are a bear 🙂
I had asked the bears here examples of double peaks that are bubbles. I have yet to have gotten a reply. Do bubbles double peak? I am talking about indices and not stocks.
both gold bubble in 2011 and 2000 stock market bubble burst end August/beginning September. Both were bubbles associated with solar peaks. Would give it a chance here as well.
margin debt chart… nothing to worry about here… move along, the melt-up can continue unabated…
Opened short
Ftse 6820
Dow 17150
SPX 2003
Putin may blank ukraine leader later.
Looks like another bear run!!! When will they stop? Where are most of the stops 2002-2010??? But probably need a parabolic end to this at this point and where that will end is anyones guess. Let’s wait for price to tell us before stepping in front of this train.
The ongoing bull market of stocks has the potential to be the most spectacular one, ever, in history. This is the first time, ever, that stock market participants are not afraid of systemic risks. This is awesome.
I don’t know how high could it be, or when will it end. The only suggestion is to buy any dip. ONLY after you made some money by going long, you could change your bearish views.
Bears or bulls, they all build up their opinion on facts. But those are different facts. There are so many facts in the world. People just tend to see what they like to see, and neglect others.
Another new high may be, but look at the pattern. Highs in the first 1-2 hrs of opening and then distribution the rest of the session. This has been going on for two weeks.
Retail investors are going to get absolutely annihilated yet again.
Trannies at this stage not confirming these highs just as was the case at the July peak.
double top in gold in 2011 had similar look to the biotech index double top – the latter only stretched over multiple months rather than 2-3 weeks as for gold. Gold put in a 2nd top which was 0.45% higher its first one. We are at those levels in Biotech at its 2nd top this am. Let’s see what transpires. Biotech in my view is what the gold/silver complex was to the commodities bubble in 2011. Once it breaks the whole market goes.
I saw the double top in gold too, but I am unable to find double tops in equity indices. The only one I see that might be a double top is EWZ in 2008. But overall, they seem to be rare.
SPX in 2000 and 2007 which turned into a pretty dramatic double top….
I guess your definition of a double top is different from mine. In 2000, NDX was the bubble and it did not double top. In 2007, we were 1-2% higher on that second top.
New highs for HSI, EEM, SPX, INDU, IBB, QQQ. I am glad I am stopped yesterday. Even if THIS is the peak, I have a stop order to reenter quickly and various levels below. But the upside from here is unlimited even if unjustified economically and fundamentally — that is the definition of a bubble.
EEM’s participation tickles the fancy of bulls who must be thinking it will eventually catch up with SPX.It is a strong candidate for stock rotation rather than the end. Not a good development for the bears.
Central bankers policy trumps demographics.
Its up again…. its getting pretty sick to look at it. 20X PE for SPX probably arrives by month end. I just hoped its not another year 2000 and keeps running to 30X PE.
DJT may not be but the RUT is ATM.
Falling wedge on the daily VIX. Its do or die time for the bears. They need Putin now!
Just as a Devil’s Advocate thought: the market move that is widely viewed as least likely is a sharp drop from here “for no good reason.” As a result, this becomes the most likely move, as “what everybody already knows has no value.” Put another way–the current low volatility stability has built up complacency, but low volatility leads to high volatility ‘for no good reason.” It’s a function of systems.
Is there a case study that this price dynamics exist? Even in 1987, we started slow off the peak, allowing bears who were stopped out plenty of chances of short possibly at prices higher than their stops.
Alternatively, the markets are fully rigged by HFT, offshore proxies of the Fed, dark pools etc. i.e. the market is a simulacrum rather than an open market, and as a result it cannot go down.
On the surface, the bears look like they are in trouble. However, so far the markets are reacting exactly what is expected during new moon period. Markets hitting new high, getting to overbought territory, then retracing hard. I still fully expect a strong reversal by the end of this week, 08/28, 08/29.
Agreed with John’s comment that there are plenty of opportunities to short when the markets start crumpling. Very shrewd move to stay on the sidelines.
I love articles like the one below when the market is making new ATH’s. I especially like the comment about risk appetite. Yes the old risk appetite, one of those fickle indicators that analysts like to talk about to convince investors that now is truly the buy of a lifetime and ya better get in quick.
An indicator that is as useful as a fart in a colander.
http://finance.yahoo.com/blogs/talking-numbers/why-s-p-2-000-could-just-be-the-beginning-214017135.html
On current large complacency I would agree,
it is difficult to view this otherwise.
If you are a believer in the omnipotent FED,
then it’s unlikely you will see a parabolic move
from here – very much doubt the FED will want
further large short term gains from these levels.
If you subscribe to the free(ish) markets view,
then anything can happen.
this should sell off pretty quick to below april levels and then make an attempt at the highs, failing and then the October panic ensues…
http://stockcharts.com/h-sc/ui?s=$TYX&p=W&st=2011-11-01&en=today&id=t83096414374&a=352286267&r=1409068181805&cmd=print
POMO Total Par Amt Accepted (mlns) : $2,275
even with this the vapor lock of low volume, distribution and selling is getting hard for the machines to ignore.
self eating algos up next
The US had a bear market and recession in 1937 despite QE 1934-1937 and ZIRP. Japan had bear markets and recessions in the 2000s despite ZIRP and QE. There is nothing different this time.
Thank you John. ZIRP does nothing other than compounds the problems. The longer ZIRP continues the deeper we go down and the longer it takes to recover.
The arfument can also be made that Japan has never exited their recession, soon to be depression.
It’s total foolishness.
http://www.zerohedge.com/news/2014-08-26/it-begins-council-foreign-relations-proposes-central-banks-should-hand-consumers-cas
Central Bankers are proof that manure can grow legs and walk!
Would be pretty much the same as when we all received a check in the mail from the Treasury a few years back, no? The only difference would be the source. Then all those checks increased the Federal debt. If the CB’s start mailing checks to the people, instead of increasing the Federal debt it would increase the size of the CB’s “balance sheet”.
If it’s foolishness now, it was foolishness then, no? How many were screaming about how foolish it was back then?
Bottom line IMHO is this: If we are facing a deflationary storm that’s the result of more than 100 years of our fractional banking system (where banks–not CB’s printing–create money out of thin air by loaning money they don’t have), then QE and other forms of money creation are attempts to slow down or stop that storm. The deflationists say that those attempts will fail and we will get deflation, serious deflation, maybe worse than what happened during the 1930’s.
The basic problem IMO is that the whole system is flawed. Get rid of the banking system that we have, get rid of the CB’s, get rid of the concept that we have to have economic growth in order to be prosperous, in order to be happy.
http://www.safehaven.com/article/34930/6-month-cycle
2011
http://stockcharts.com/h-sc/ui?s=!AVE52SPX&p=W&st=2009-09-03&en=2012-03-29&id=t09022299022&a=365228383&r=1409076915979&cmd=print
now
http://stockcharts.com/h-sc/ui?s=!AVE52SPX&p=W&st=2012-02-16&en=2014-08-26&id=t09022299022&a=365228383&r=1409076915979&cmd=print
flat-lined participation and outrageous divergences!
The following have put in new yearly highs today. If this was the top of the bull market surely some of the risk on indices would have topped out.
IBB
JNK
XLF
SPX
INDU
NDX
is that what happens at tops, they “top out”?
do you see the narrative flaw in that?
2011 jnk just before the fall looks EXACTLY Like jnk right now – more to the point, compare the indicators especially the confidence ratio (jnk:tlt)
impressively similar – saying new highs will be met with new highs is actually a sign of a top imho
you are right that the confirmation (after the fact) will be a CIT move one way or the other but all I see are double tops lagging small caps and lots of divergences…
http://stockcharts.com/h-sc/ui?s=JNK&p=D&st=2010-11-22&en=2011-11-22&id=t45651210312&a=357560080&r=1409073948626&cmd=print
look at the divergences now and compare historically
spend a little time with the 30 year yield chart I posted earlier and see how the time frames and cracks in the 30y line up to a fall at least as significant as 2011 – Sept 1 or anytime before
there are a number of charts indicating that the cyclical bull is done here and the secular bear now continues down to the bowels of, well, the place where all good narratives go…lol
http://stockcharts.com/h-sc/ui?s=FAGIX:VUSTX&p=W&yr=20&mn=0&dy=0&id=p84597161011&a=359370287&r=1409080943451&cmd=print
The Dow’s KODR seems probable today
KODR (Kiss Of Death Retracement) — an issue that has broken an uptrend and comes back up to kiss the underside of the uptrend its just broken only to be turned away and tends to roll right back over to the downside shortly there after. it is a trendline break to the downside with a snapback rally.
RUT = interesting – http://scharts.co/1ARAiiJ
Ditto the weekly – if she’s going to turn down, here is as good a place as any: http://scharts.co/1ARDMS9
Have to say, I am not betting on it though.
S&P top at 2005 would be even more perfect then at 2002 as it gives us that 7 which was famously predicted by IMF.
Gold gives signs of life at support, that looks promising.
SPX… http://scharts.co/1ARG9EP
IMO This market is setting up a bear trap tomorrow … BTFD!
Trap has been set. Possible we gap down tomorrow – bears will lose their gains by end of the day.
you mean buy the all time high
thats the new narrative meme
I don’t mean to rain on the bears parade, but I have been reading a lot about the 1920s and although everyone compares 2008-09 to 1929, there are a lot more similarities to the 1920-21 depression. In that case, The DOW dropped about 50% to 64 (x100 for 2009). Then took about 3.5 years to retrace to new highs, then had corrections of 20% and 15% (2010, 2011). Next, a parabolic 5-wave to 160 (x100 for 2014) in 1926. 5 years from the bottom. Then there was a 15% correction, rally, 10% correction, then final blow-off for three years to a top in 1929 at 380 (x100 today = 38000), then crash to 40 over three years.
http://stockcharts.com/freecharts/historical/djia19201940.html
Interestingly political climate was almost 100% opposite with rally from 1921 lows fueled by supply-side economics with final blow-off off fueled monetary support. Perhaps if Reps take over congress maybe this time the final push will be from supply-siders. Also 1920s had prohibition and now we are legalizing maryjane. This is not a prediction – just an example of a true blow-off if analogy continues.
supply side econ in 21?
hot tub time machine!
Supply-side economics developed during the 1970s in response to Keynesian economic policy
Hmm but where’s the fuel coming from?
Take it everyone has seen this…
http://www.zerohedge.com/news/2014-08-26/it-begins-council-foreign-relations-proposes-central-banks-should-hand-consumers-cas
tired of these idiots.
WHICH ONES?
confederacy of dunces meets the multitude of idiots
Another minor thing for the markets to ignore. … http://www.theguardian.com/world/2014/aug/25/french-government-resigns-francois-hollande-manuel-valls
John,
poss three peaks and dome on Daily Dax chart dating back to Aug/Sept 2013 we maybe? nearing point 27 for a rollover leg down?.
Been a fan since Amalgamator days and low hits on the site you should be rightly proud of your achievement, so thank you and your contributors (passed and present) for this thought provoking forum.
” build and they shall come”, right sentiment for this site (job done I think). take it easy on yourself.
p.s. can you give me the name of the manufacturer of your spine of steel please!.
Thank you
as the cliche has it, they don’t ring a bell at the top: the top is only easy to identify in hindsight. Just recently, few called a top on July 24. If it was easy, everybody would go short at the top and cover at the absolute bottom, and do so every swing. I doubt the next top will be any easier to call, and it’s likely most of those wanting to go short will have waited for a clear signal that rarely appears.
It’s gonna be fun watching the crowd head for the exits on this one 🙂
http://stockcharts.com/h-sc/ui?s=BITA&p=D&b=5&g=0&id=p35188267683
And I thought the above one was horrendous:
http://stockcharts.com/h-sc/ui?s=BITA&p=W&b=5&g=0&id=p58396761786
John,
A major turning point that grows closer and presents a stronger possibility of your scenario.
Additionally, as I studied the 1987 Crash…Oct. 19 (Dow dropped 22%), I learned an interesting fact that I was unaware of…the markets had not corrected more than 10% for the prior 3 year period. Sound familiar?
If any knows of this time/price correlation with regard to prior crashes, please post.
http://armstrongeconomics.com/2014/08/26/economic-confidence-model-rules/
I feel bears need to focus on recent developments that has dampened their case further …
1) Risk-on indices IBB and JNK put in new highs yesterday. IMO, second chance peaks always fall short of the previous high and rarely double top. Secondly second chance tops are fast and the reversals are faster. From my perspective, these are in clear up trends. Higher high, higher low
2) AD line more often than not tops out earlier. Yes, there is an example i 1937 but that is only one case and many more tell you that that is rare.
3) Bears have shown little effort to protect keg levels. Bulls have always put up a fight at each support level.
Does all this mean we cant correct? No! We can but chance of a severe decline are slim. More likely a 10% decline that comes along every couple of years.
As per the new highs that Duncan lists further up, not a good day for the bears yesterday. However, beating Monday’s extreme, yesterday was the lowest volume non-holiday trading day in a decade. It doesn’t mean these gains will be reversed, but you can’t trust this action. We are still in the realm of double tops / marginal new highs on divergences on SPX, Dow, IBB, JNK so I stick with my plan of watching and waiting this week.
John, with respect this 5 year bull market has been moving on ever declining volume. See below for an article published in Dec 2009 that argued for a bear rally due to declining volume. I certainly agree with you on a lot of other indicators you have published over the months but imo volume is something to ignore.
http://www.moneyandmarkets.com/a-low-volume-stock-market-rally-and-a-burst-real-estate-bubble-6-37144
The longer term declining volume reflects (1) demographics and (2) a shift to other products. Thin volume advance, either short term or longer term, is more prone to reversal. Many historical examples of this. The chart I showed of current SPY down day versus up day volume recently aligned with previous major peaks.
I do have to agree with part of Duncan’s views volume does not really matter this market been rising on low volume for ages. Not many wants to trade stocks on the hope for higher returns on stock held so it’s easy to push this up. Bulls biggest worry is high volume or a rush to the exit.
Anyone noticed a flash yesterday, I did not but it happened, this is a snippet from the link below…..
“But apart from that… and the year’s lowest trading volume… stocks are at all-time highs so that must be good right… until someone decides to sell that is… to lock in that ‘wealth effect’.
http://www.zerohedge.com/news/2014-08-26/retail-trader-lockout-todays-market-issues-were-worst-flash-crash
Aaron, it’s along the lines of what I have been saying from day one. The bulls think they will cover themselves when the real turn comes and maybe they will.
However they also risk getting taken down in a lockout flash crash that sees the indices plummet triple figures or worse with no way of exiting.
That is WHY I refuse to long this market, the easy long money was made months and months ago.
A lotta folks are gonna get very burned very soon.
Something interesting ive come across on the VIX daily. I personally dont think it will play out but you may find this of use if you are expecting markets to fall.
Ive noticed a cup and handle pattern. It starts mid april to present. There is a falling wedge formed in the last few days too. If confirmed vix could go into 20s soon!
I notice three interesting things in this BofAML chart (from the link provided by Alexa above): http://www.zerohedge.com/sites/default/files/images/user3303/imageroot/2014/05/20140501_rotation.png
The most immediately obvious one is the marked distribution of US equities from Institutional to Private Clients (Retail) over the past couple of years (difficult to say exactly when, as the x-axis is not very clear).
The second is that Institutional has been reducing US equity investment, since even before the current cyclical bull began! The so-called smart money has been increasingly standing aside throughout. They’ll need incredible patience to wait even longer for significantly cheaper prices; or will they feel obliged to join in again?
Thirdly, if Institutional, Hedge Funds and Retail have less money in US equities now than they did in December 2007 as shown, then who has been doing all the buying since then? There must be another “Client Type” not included in BofAML’s analysis.
Would that be the “HFT, offshore proxies of the Fed, dark pools etc” mentioned by Charles Hugh Smith above?
Or am I missing something?
Breaking news
http://abcnews.go.com/Business/wireStory/imf-chief-christine-lagarde-official-investigation-negligence-corruption-25140668
Is this about her tip number 7 tip off last month?
Proabably. Just a shame the article didnt come out tomorrow …
28, Aug 2014
2+8+8+2+1+4=25; 2+5=7 😉
I can’t wait until the day all these bankers start turning on each other to save themselves.
It is going to be the greatest spectacle on Earth. If we did in fact spring from apes, most of them didn’t spring far enough.
Not much of a bear trap, US futures slightly
higher, UKX about unchanged.
Only the DAX off marginally following
huge recent gains.
Would not rule out some weaker sessions,
but not short.
Yup I thought we would open lower because of the shooting star candle on most of the US indices. That and the falling wedge on VIX daily chart. Bears have had a number of perfect oppotunities to reverse the market but have failed to do so.
Had a thought recently about an article recently published on Fat Pitch. It compared the pullback we have today againt those in the 1990s. We have much shallower pullbacks than they did then.
So that got me thinking. Whats changed? Fear and greed have always been in the market but whats different this time? Well thats where imo the rise of Short EFTs and Spread betting play a part. The general public have only recently started to use these over the past 10 years. Pick up the Evening Standard or finance section of a newspaper and spreadbetting adverts are everywhere.
The internet age has definately given the public a means to bet on the markets, but the spreadbetting firms are suffering: http://www.investegate.co.uk/london-capital-group–lcg-/rns/interim-results/201408270700260604Q/
2014 H1 “revenue…down 39%”. Hence the agressive advertising.
banned by elvis all your charts are now mush……………….could u please repost them thanks btw really appreciate ur data and charts……….
how are they mush? the links seem active this morning
here is the 30 year the weekly confidence indicator (bull/bear) and an FLD chart that will show the cycle translation on this move…
you people really need to review the 30year yield chart – the time projections are very accurate and the latest possible one (like Ed Carlson’s Lindsey projection) targets Sept 1
http://stockcharts.com/h-sc/ui?s=$TYX&p=W&st=2011-11-01&en=2014-08-27&id=p93251537240&a=352286267&r=1409149663624&cmd=print
http://stockcharts.com/h-sc/ui?s=FAGIX:VUSTX&p=W&yr=20&mn=0&dy=0&id=p84597161011&a=359370287&r=1409149845008&cmd=print
http://stockcharts.com/h-sc/ui?s=$SPX&p=D&yr=0&mn=4&dy=0&id=p33348566345&a=363777322&r=1409149378690&cmd=print
tnx again
Since Feb 2013 there have been 12 major distribution days and just 1 major accumulation day. I can’t find a similar period looking back for when major accumulation days were equally scarce.
It corresponds to the same period noted above for when institutions became sellers and retail became buyers.
The 12 major distribution days tended to correspond to the bottom of the v-bounces which have been the common theme in this period: i.e. they were evidence for shallow capitulation (the shallow pullbacks also referenced above).
Yet, looking back before this last 18 months, the bottoms of mild corrections tended to always lift off with major accumulation days: a voluminous buying surge. No such major accumulation days on all the v-bottoms of the last 18 months bar one in Oct 2013.
Perhaps this is my own ignorance, but I find it silly that we even look at “accumulation and distribution” when we all know that dark pools alter the reality of volume. You can look at the tape and see a million shares sell at a price point and the stock doesn’t even move. Without a computer factoring that in I have no idea how anyone would know where the A/D line really is relative to that stock.
people dont really understand dark pools – these are mostly used to keep from printing trades on public data feeds SO THAT SHARES CAN BE ACCUMULATED WITHOUT DRIVING PRICE UP. Now the private large block trading is a manipulation to be sure but most of the dark trade do not (initially anyway) drive UP prices.
Nah I don’t buy it, it’s printed on the public feed regardless so that can’t be why. Why does it need to be accumulation..how do you know it’s not distribution?
the trades are not printed on a public feed…initially
do your research – its not that hard to verify
as for accumulation the idea is to acquire shares surreptitiously to keep the price low
even if surreptitious block sales are done it would be to support price not increase it
again I am not saying DPs arent manipulation and they do stop price discovery but if you think the stock markets were set up for any other reason that monetizing cash flows so that equity could be moved while leaving debt behind you are crazy…
DPs are just another tool for doing that more effectively but they dont really drive prices up
buy backs, MA’s, margin, zirp through investment banks….
USD/JPY back into range with the standard correlation of JPY UP = NIKKI DOWN = U.S EQUITES DOWN = USD DOWN
I’m at odds with how several relatively “big picture thinkers” here still seem to be looking for some kind of “silver bullet” to mark / validate one chart / concept or another.
Simply put – It’s the 200 Billion Japanese Yen printed per month has ( via BOJ proxy for The Fed ) that’s been the fuel for this rally ( as the correlation is so obvious ). and turning a boat / ship of this size takes considerable time.
A day’s trading here…a day’s trading there most certainly won’t “mark the top”, in viewing some small indicator such as Vix or even the entire NY Stock Exchange for that matter. A single stock exchange in a single country.
Consider the top back in January with JPY printing at the high and NIkkei at 16,450….then consider a full 7 months retail distribution ( and accumulation of Yen by the big boys ) as larger players prepare for the next “real move” to come.
Sun…..moon….YEN?
Yen, Yin, Yang?
lol.
Point being…
From the top down…..if we consider “the sun” the top…
What possible “human force” on Earth could have more influence / sway in markets if not The Central Banks?
You can’t “purchase or sell an asset” without the use and exchange of currency so currently we’ve got an extra “200 billion” flooding the planet per month.
In my view this sits pretty high on the totem pole with respect to “macro factors” to consider.
Just another perspective. If it helps at all.
It does, thanks
Your commentary and explanation of the forex carry trade are much appreciated, FK. It’s clearly the 800-pound gorilla in the room (please excuse reference to your moniker). I have one small request–could you please speed up the unwind? we’ve already endured 7 months of drip-torture .. 🙂
An absolute grind as I’ve not been able to trade aggressively for yes – count ’em….7 straight months.
We are very close in my view as…..
A quick look at a 25 year chart of Nikkei sees us up at the top end – touching the massive downward sloping trendline at the highs of 16,450 back in January.
It would be absolutely impossible to consider this downtrend “reversed” at this point without “at least” a massive correction lower – likely spanning years.
So….we now enter a time of monetary contraction with the latest “attempt” to keep the balls in the air….now completely out of air.
Obviously Japan has it’s own limitations as to “how much they can do” and it’s pretty clear here these days that this “latest round of easing” has done little to improve economic conditions.
It hasn’t worked in the past…and it didn’t work this time.
I expect to see Nikkei roll over here “literally” next week, and the next major leg down to begin.
A break of 101.20 area in USD/JPY key.
I wish I could make it go faster but these things ( especially these days ) seem to go on forever.
Are you short the Nikkei yet? Do you plan shorting it in the future, or will you just stick with the US stock market?
I will be long Yen ( effectively the exact same trade ) within days yes.
Stock guys can look at shorting “EWJ” – options are cheap, cheap.
I rarely participate in the U.S stock market.
thanks, Kong. Yes, those EWJ puts look like a good play. As you said, they are cheap, cheap, cheap!
Get out as far as at least Oct.
I’d pick up the Oct puts / strike price 14 for around 1.20
The stock only needs to move like a nickel to break even.
I imagine EWJ under 11 bucks at least.
Bears fight back! 🙂 … but for how long?
PS. IMO we havent seen the top yet.
Yesterday we HIT the 12-Year TOP Pitchfork line and ENDED with a Gravestone Doji 1995.04
$SPX below 1998 and we increase selling pressure quickly
yes this chart shows 1985 as the support
http://stockcharts.com/h-sc/ui?s=$NAHL:$NATOT&p=D&st=2014-03-31&en=today&id=t42962787394&a=344670944&r=1409152565175&cmd=print
ty so much appreciate ur awesome charts
BANNED BY ELVIS all your charts became mush i don’t no why except the RAGIX:VUSTX……………….could u please repost them thanks btw really appreciate ur data and charts……….
I did repost some but I think wordpress blocks more than two links or links that have already been posted on the same thread…that post will probably pop up later
here is the most important chart again – the 30 year yield cycle gives you very accurate projections on significant highs in NYA
http://stockcharts.com/h-sc/ui?s=$TYX&p=W&st=2011-11-01&en=today&id=t23406480331&a=352286267&r=1409150283325&cmd=print
the lastest top date for the cycle is Sept 1 (similar to Ed Carlsons date for the SPX)
fld chart that will possibly show the move here – note the $NYHGH:$NYLOW bar.
if price doest fall fast then we will get a fast move higher that will end in sucking everyone in before the crush
http://stockcharts.com/h-sc/ui?s=$SPX&p=D&yr=0&mn=4&dy=0&id=p33348566345&a=363777322&r=1409151417508&cmd=print
tlt is likely to be a determining factor in how people view prices today…projection on it is bullish until Dec 1 per Money Flow
http://stockcharts.com/h-sc/ui?s=TLT&p=W&st=2012-01-19&en=today&id=p26427376069&a=317189217&r=1409152638952&cmd=print
http://stockcharts.com/h-sc/ui?s=$SPX&p=D&st=2000-10-21&en=2014-08-25&id=p67917473124&a=357241271&r=1409153485725&cmd=print
support, overthrow or just back code on stockcharts annotations???
http://stockcharts.com/h-sc/ui?s=$SPX&p=D&st=2014-04-23&en=2014-08-27&id=p67917473124&a=357241271&r=1409153485725&cmd=print
I hate stock charts annotations – they have the most deficient code on the planet
ok i will try it
These are no good please repost the analysis
011
http://stockcharts.com/h-sc/ui?s=!AVE52SPX&p=W&st=2009-09-03&en=2012-03-29&id=t09022299022&a=365228383&r=1409076915979&cmd=print
now
http://stockcharts.com/h-sc/ui?s=!AVE52SPX&p=W&st=2012-02-16&en=2014-08-26&id=t09022299022&a=365228383&r=1409076915979&cmd=print
flat-lined participation and outrageous divergences!
Amazing time and price chart from the 87 crash. Also note the 50% retrace level from the 2003 level would effectively be to a price level the same as the increase from the 666 low ie. 1336. Food for thought.
http://citdates.blogspot.co.uk/
Crashes like 1987 or 2008 are abrupt because they are not at the solar max. Solar max crashes tend to be more prolonged — which also means they leave lots of time to short.. This is my observation anyway, which is why I am comfortable not being max short right now.
ok –
http://stockcharts.com/h-sc/ui?s=!AVE52SPX&p=W&st=2012-02-16&en=2014-08-26&id=p09022299022&a=365228383&r=1409155560666&cmd=print
http://stockcharts.com/h-sc/ui?s=!AVE52SPX&p=W&st=2009-11-08&en=2012-08-04&id=p09022299022&a=365228383&r=1409155560666&cmd=print
Total POMO Par Amt Accepted (mlns) : $1,031
and still NO BOUNCY
look at TLT go go go
Sorry for the lengthy message…
Dimes on Black and Dynamite on Red
John Hussman, President, Hussman Investment Trust
The stock market is presently a roulette wheel with dimes on black and dynamite on red. We continue to have extreme concerns about the extent of potential market losses over the completion of the present market cycle.
At the same time, we have very little view with regard to short-term market action. If one reviews market action surrounding major pre-crash peaks such as 1929, 1972, 1987, 2000, and 2007, you’ll observe a sort of “resilience” in the major indices on a day-to-day and week-to-week basis even after market internals had already corroded. In 1987, for example, the break following the August bull market peak was largely recovered over the course of several weeks before failing rapidly in October. In 2000, the market actually experienced a series of 10-12% corrections and recoveries before a final high in September that was followed by a loss of half the market’s value. In 2007, the initial break in mid-summer was fully recovered, with the market registering a fresh nominal high in early October that marked the end of the bull market and the start of a 55% market collapse.
As economic historian J.K. Galbraith wrote about the advance leading up to the 1929 crash, the market’s gains “had an aspect of great reliability… Indeed the temporary breaks in the market which preceded the crash were a serious trial for those who had declined fantasy. Early in 1928, in June, in December, and in February and March of 1929 it seemed that the end had come. On various of these occasions the Times happily reported the return to reality. And then the market took flight again. Only a durable sense of doom could survive such discouragement. The time was coming when the optimists would reap a rich harvest of discredit. But it has long since been forgotten that for many months those who resisted reassurance were similarly, if less permanently, discredited.”
None of this implies that the market will or must collapse in short order. Stocks remain strenuously overvalued, overbought, and overbullish, but those conditions have persisted uncorrected much longer in the present instance than they have historically. That doesn’t encourage us to abandon our concerns, but it does make us less aggressive about investment stances that rely on any immediate unwinding of what we continue to view, along with 1929 and 2000, as one of the three most reckless equity bubbles in the historical record.
Our perspective is straightforward: on the basis of measures that have been reliably correlated with actual subsequent market returns in market cycles across a century of data, we estimate that the S&P 500 Index will be no higher a decade from now than it is today. On the basis of nominal total returns (including dividends), we estimate zero or negative returns for the S&P 500 on every horizon shorter than about eight years. See Ockham’s Razor and the Market Cycle for a review of the total return arithmetic behind these estimates, and Yes, This Is an Equity Bubble for additional background on our present concerns.
At the same time, we don’t have strong views about immediate market prospects. Still, even a run-of-the-mill completion to the present market cycle would wipe out more than half of the market’s gains since the 2009 low, so whatever gains the market experiences in the interim are likely to be transitory, and few investors will retain them by exiting anywhere near the top. Frankly, we doubt that the present cycle will be completed with the S&P 500 even above 1,000 (a level that we would associate with historically normal subsequent total returns of roughly 10% annually). We readily accept that 3-4 more years of zero interest-rate policy would justify market valuations 12-16% above what would otherwise be “fair value” (see Optimism vs. Arithmetic to see why), but we also recognize that the vast majority of bear markets have overshot to the downside. I n short, an informed view of market history easily admits the likelihood that the S&P 500 will lose half of its value over the completion of the present cycle.
We could certainly observe very constructive or even aggressive opportunities without that outcome. Those opportunities are most likely to coincide with a material, if less extreme, retreat in valuations, coupled with an early improvement in market internals. But here and now, we don’t observe any investment merit in equities, and with market internals deteriorating, any remaining speculative merit has also receded quickly.
As I emphasized last week, “While we’re already observing cracks in market internals in the form of breakdowns in small-cap stocks, high yield bond prices, market breadth, and other areas, it’s not clear yet whether the risk preferences of investors have shifted durably. As we saw in multiple early selloffs and recoveries near the 2007, 2000, and 1929 bull market peaks (the only peaks that rival the present one), the ‘buy the dip’ mentality can introduce periodic recovery attempts even in markets that are quite precarious from a full cycle perspective. Still, it’s helpful to be aware of how compressed risk premiums unwind. They rarely do so in one fell swoop, but they also rarely do so gradually and diagonally. Compressed risk premiums normalize in spikes.”
Those spikes will make it quite difficult to exit in the nice, orderly manner that speculators seem to imagine will be possible. Nor are readily observable warnings (beyond those we already observe) likely to provide a clear exit signal. Galbraith reminds us that the 1929 market crash did not have observable catalysts. Rather, his description is very much in line with the view that the market crashed first, and the underlying economic strains emerged later: “the crash did not come—as some have suggested—because the market suddenly became aware that a serious depression was in the offing. A depression, serious or otherwise, could not be foreseen when the market fell. There is still the possibility that the downturn in the indexes frightened the speculators, led them to unload their stocks, and so punctured a bubble that had in any case to be punctured one day. This is more plausible.
“Some people who were watching the indexes may have been persuaded by this intelligence to sell, and others may have been encouraged to follow. This is not very important, for it is in the nature of a speculative boom that almost anything can collapse it. Any serious shock to confidence can cause sales by those speculators who have always hoped to get out before the final collapse, but after all possible gains from rising prices have been reaped. Their pessimism will infect those simpler souls who had thought the market might go up forever but who now will change their minds and sell. Soon there will be margin calls, and still others will be forced to sell. So the bubble breaks.”
Why not just post a link to Hussman’s website?
A Uranus cycle may give us a once in a Century decline between 2014-2018 (http://astrocycle.net/?Storm)
Big things happen when Uranus is in either Libra or Aries (opposite sign, 180 degr.) Uranus is now in Aries from march 2011 until may 2018. Midpoint = October 12 2014. Remember this date.
tlt
Mount Everett summit has been reached…Many climbers would down and yield to fresh enthusiastic fresh legs hiding in the bushes waiting for their turn.
A pulse at this juncture makes sense. May be.
Everett? Mount Everett at 2,602 ft…MA
I knew people in Massachusetts hid in the brush waiting. That’s why I never visit! lol
Humor me John, check this out
https://www.thefinancialist.com/is-the-bull-market-over/
Heliospheric Current Sheet has now dropped convincingly below 70 degrees (so the SSN peak is almost certainly behind us): http://wso.stanford.edu/gifs/Tilts.gif
In SC21, 22 and 23 this angle dropped away in May 1980, October 1990 and July 2000 – very close to the corresponding gold, Nikkei and SP500 market highs.
The SC24 HCS drop is now confirmed to be December 2013, closely matching John’s view that that was the real US stocks top.
So stock markets could fall very soon if they follow strong solar cycles 21, 22 and 23 and weak cycle 14. Or if they follow weak cycles 10,12, 13 and 16, they could double from March 2014 (SC24 SSN peak) until sunspot numbers finally fall away from their plateau (typically that could be anytime between November 2014 and 2018).
Very informative and refreshing. Thank you.
Regarding weak cycle 10, when was the market crash? I don’t have the data.
For cycle 11, would that be strong? The peak was 1871 and the crash was 1873, so it would add contrary evidence to your suggestion that strong cycles do not have late crashes.
For cycle 12, the SSN peak was 12/1883, and the Panic of 1884 followed in a rather timely fashion. I would put it in the “very soon” category.
For cycle 16, I agree that we crashed a year out in 1929 vs the peak in 1928.
Look forward to receiving the cycle 10 data, but it seems to me that the worst case is 2 years after the solar max — and so we might be looking at 2015, but I do not see the evidence for 2018.
Thanks John. 1800s Dow data: http://www.chartsrus.com/charts.php?image=http://www.sharelynx.com/chartsfixed/USDJIND1800-1900.gif
You’ve probably seen recent comments about the “sketchyness” of this old data, but I personally have no doubt that it is valid enough to rely on. It shows the Dow surging from a value of 8 from early 1860 (which was also the SC10 SSN peak), to 27 into around mid-1864 (which was also the final miniature SSN peak. Dow then fell from 27 to 21, a 22% decline over approximately 18 months. So that was a 4.5 year tripling of the Dow – after the SSN peak. IF weak SC24 were to mirror weak SC10, then the eventual speculation peak would be late 2017 or shortly thereafter.
I’m not trying to suggest, by the way, that all strong cycles must have early crashes, nor that all weak cycles must have late ones, nor even that the speculation must necessarily result in a crash at all – I’m suggesting that the typical general rule is for speculation to increase into the SSN peak during strong cycles; but to really go parabolic between the SSN peak until the final mini peak during weak cycles (SC11 was a strong cycle exception; SC14 was a weak cycle exception).
So is SC24 going to be a weak cycle exception? Its a pity we don’t have HCS or polar field strength data going back to the 1800s – that would have given us a major clue.
I’m glad you mentioned the Panic of 1884 – I hadn’t realised that it happened during May of that year, so you’re right in that it was closer to the SSN peak (December 1883) than the final smaller peak (February 1885).
Also, 1884 was a minor lunar standstill “panic” year – as is 2015…
My view is that autumn 2015/spring 2016 is the most likely timeframe for a big panic, but that it could happen at any time between now and early 2018.
Thank you for the data.
Bloomberg data only starts from 1900, and so I had to resort to history books for the 1800s. The downside is that I miss the 1860s, while the upside is that it is a more global perspective. Vienna was the largest stock market in the world when the 1873 crash occurred.
Hello John, now there is stronger geomagnetism http://www.swpc.noaa.gov/rt_plots/kp_3d.html.
When should we see weakness in the markets? Is it approximattly six days after geomagnetic storms?
From immediately to up to 6 days
Thanks all for the links, comments and suggestions
On 8/27 the S and P completed 2,000 days up and closed at 2,000. So the market is square with time.
Long Term monthly charts tell the story. Converging Geometric angles on the monthly S and P chart, particularly the 1982 and 2007 $5.00 per month angles moving up would suggest a return to trrend and reversal. And the top on 7/24 capped a 15 year cycle top from 7/19/99, crashing to 10/18/99. The $ 2.50 a month angle from 3/2000 crisscrossed the $5 angle from 10/2007 on 7/24. Therefore, this s/b the beginning of the setup for a panicky decline. Additionally, there are some very big time cycles approaching in Sept and Oct., particularly the monthly square of the 2009 low on 9/26.
But, in case I’m wrong, to be out of the market now is a bit premature, I think. Set stops below your individual support points and buy into exhaustion for a further move up.
I just came across this sight. Very interesting informative and civil.
Thank you