
Friday was a bullish fightback, but I still think the roll over is in gradual progress here. Here’s why I think the markets are at the second chance peak, rather than earlier in the topping process.
It’s fairly clear on RUT, IBB and SOCL: the nominal peak was Feb/Mar and second chance lower highs have since been made, in keeping with historic norms.
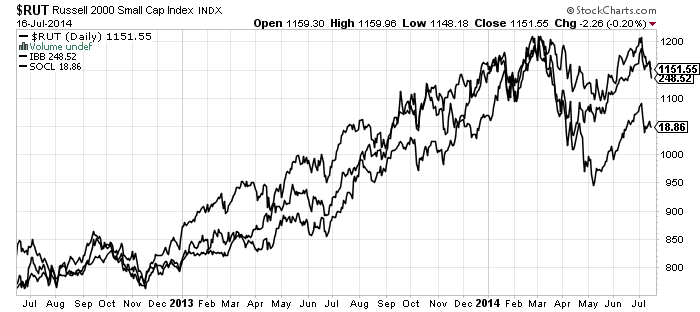
Source: Stockcharts
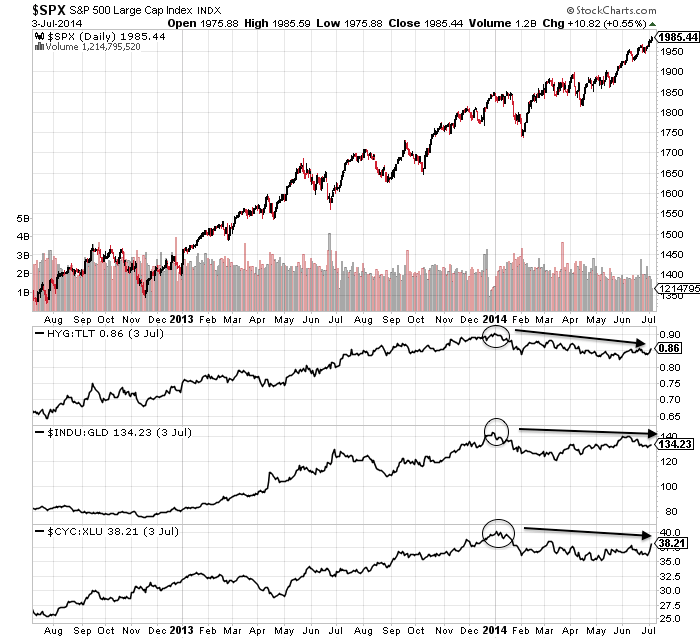
It looks acceptable on COMPQ too – a marginally higher high on negative divergences is not uncommon. But the large cap indices of SPX, INDU and NDX don’t appear to conform, making significantly higher highs, which are not in keeping with, for example, 2000, 2007 or 2011.
Nonetheless, we can see divergences initiated at the turn of 2013 into 2014:

Source: Stockcharts
Bubble end flagged once around then and again now:

Source: Financial Crisis Laboratory
In II bull-bear spread, we have seen two extreme peaks plus a divergence between them, which positions us where the markets tanked in both 2010 and 2011 (rather than earlier in those peaking processes).

Underlying source: Jack Damn
Ditto the HYG:TLT divergence. We are more like where the markets finally rolled over in 2007, 2010 and 2011, than earlier in the process.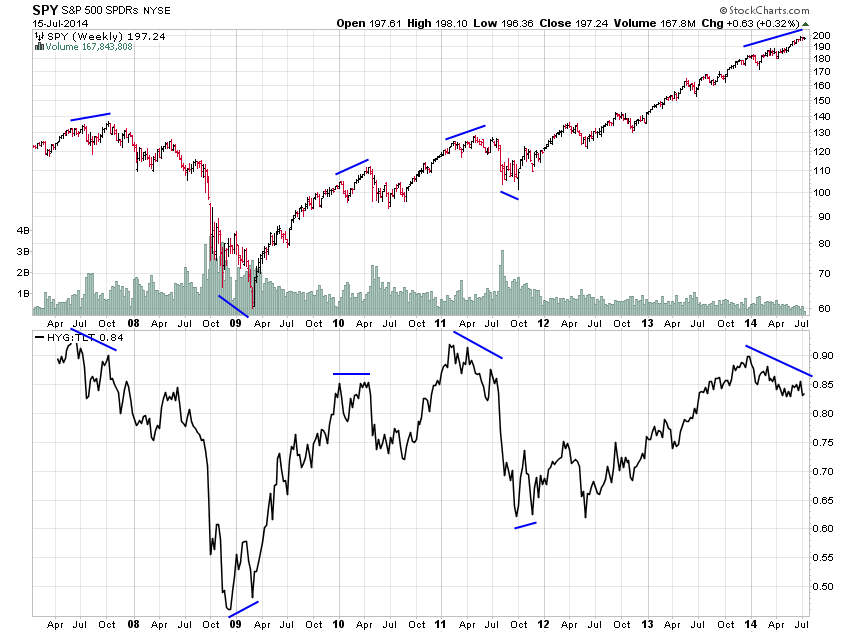
Source: Jesse Felder
Put/call and Skew tell similar tales.
We also have seen extreme peaks and divergence in Rydex assets, which would position us where the wider markets finally broke down in Autumn 2000, rather than earlier in the topping.
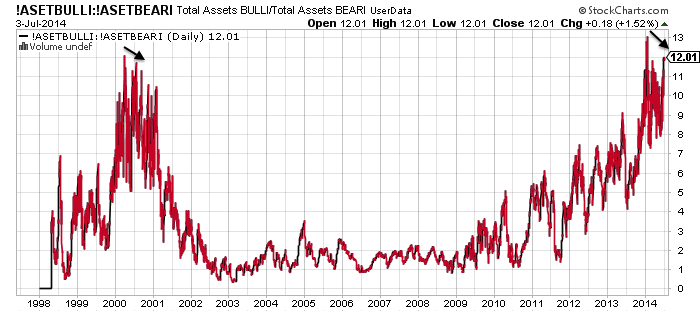
Source: Stockcharts
Margin debt peaked out in Feb. The 2000 and 2007 analogs again position us at the second/final peak, with July 2014 being 5 months after.
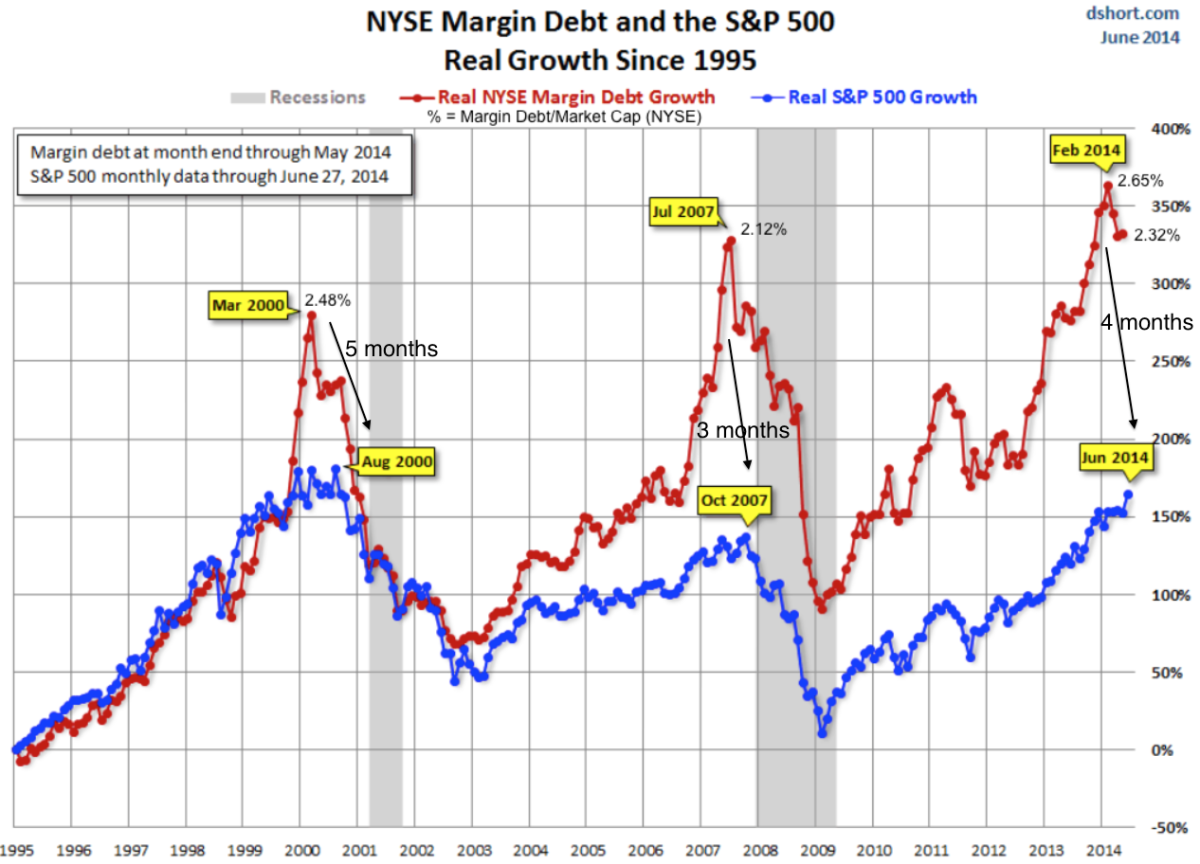
Source: Dshort
We are likely now 4-5 months or so after the smoothed solar maximum. That would also position us around the second chance peak of 2000, rather than the initial peak (March 2000).
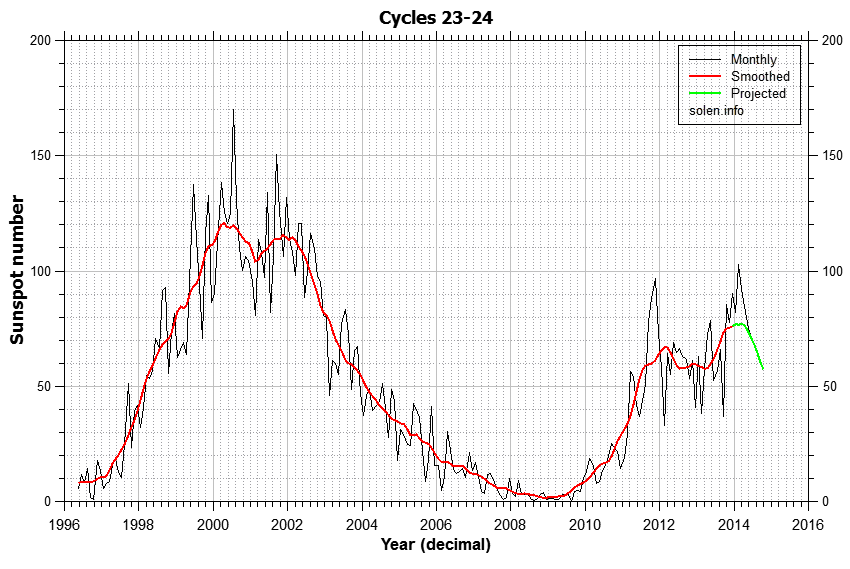
Source: Solen.info
So what happened next in each of the applicable historic mirrors?
In 2011, the markets fell heavily over the course of 2 weeks. In 2010, the markets fell heavily over the course of 3 weeks, including an intraday flash-crash.
In 2007 and 2000, the markets entered definitive bear markets at this point. Bears firmly in control, with periodic heavy selling. I suggest 2000 is a more compelling mirror than 2007, because this is a solar maximum like 2000, with RUT and biotech p/es reaching similar craziness levels to internet stocks in 2000. Rydex, market cap to GDP and q ratio all look more similar to 2000 too. What’s missing here in July 2014 is that by this point in 2000, the speculative targets of the Nasdaq indices had already suffered waterfall declines, washing out that excess leverage that had built up. That hasn’t happened yet in 2014 (RUT, SOCL, IBB or COMPQ have seen no heavy selling) meaning it’s still ahead.
Going further back in time, I maintain 1937 as the closest historical mirror. As then, if this is the second chance peak, it falls around 5 months after the smoothed solar maximum. At this point in 1937, two months of heavy selling erupted.

Drawing it all together, the messages are that heavy selling should be imminent, at least in the key speculative target indices and sectors, and that in the wider markets there should be no second chance retrace peak ahead for the bulls, but that we are rather currently rolling over into the definitive bear trend, at the end of a topping process that began in January. Yes, US large caps have made significantly higher highs versus Q1 2014, but the divergences and indicators tell the hidden story of this being the second chance peak.
I believe the definitive bear process has initiated on US small caps and European indices, since the turn of July. US cumulative advance-declines also peaked out then, and Vix bottomed. SP500 has yet to beat its start-of-July high, and although the Dow and Nas 100 have, they have done so on negative RSI divergences. Therefore, Friday’s up day should form part of the rolling over process for large caps, and nothing more.

john, the second chance from the high was about 6 months after a really good sell off, weve had no sell off and the time is 2 weeks from the high. so how can we b in second chance now?
See the RUT/IBB/SOCL chart, that’s roughly what’s happened. My point is, look behind the large cap price action and we can see the two peaks.
If i compare to your chart from 1937, the best strategy would be to buy aggressive put options that cover all the way till the end of October? Or is there a chance to time and play the waterfall zig-zag as well?
If we see waterfall declines soon, then we should get the subsequent slower significant retrace, as it will meet the pattern. August to October falls would fit very well with seasonality of geomagnetism and historic examples.
John, whilst I believe there is a case for a run of the mill correction (10-15%) I don’t believe this is imminent. Divergences can manifest for months so until there is technical damage the trend is still up. As mentioned earlier, what significantly damaged the bear case has been higher highs in the second chance peaks. Unless it is different this time, the bulls are still in control.
There is still QE in the system, but perhaps when its further tapered there could be falls in the traditionally weak Sept / Oct months.
Chris does some daily stock commentary that I think is useful http://youtu.be/e47L1uZtsBM
Hope you don’t mind me posting opposite views on your blog.
Duncan
Fine with that Duncan. There is going to be an anomaly one way or the other. If things work out as you say then the variety of indicators presented further up the page are going to be printing historic anomalies. If I am correct then the second chance higher peak in large caps will be the anomaly.
Thanks John. I appreciate the indicators above and agree a correction of sorts is coming as there are too many indicators to ignore. I would like to see the trendline support between 2000 and 2007 tops tested. A fall through that would be very bearish.
Here is my guess: a small correction 5-10% is imminent in agreement with John’s work but this is not yet the big one in this teflon market. As long as the corporate earnings are rising, it seems that nothing can shake sense in bulls. If this earnings season surprises down (its been up so far), it is too early for the major short.
Earnings growth rate for Q1 was 2.2%. For Q2, so far, it is 5.5%, so yes it is up. However, to justify the run up in valuations over the last 2.5 years, earnings need to grow 10% annual. Accordingly, analysts are predicting earnings growth rates of around 10% for both Qs 3&4. That is a major leap up in performance required, and to achieve 10% annual, given H1 will fall way short, Qs 3&4 would need to come in even higher. At the current rate, based on H1 so far, we heading for 4% growth, not 10%. So, like in 1999, 1987 and 1937, at some point markets will reprice to reality.
John, I retweeted your excellent post to my 3200 followers. I think something that’s often overlooked is the quant-bots that execute most of the trading are programmed to recognize technical patterns and systems, so declines may not follow previous patterns. In my view, a decline will be unlikely to proceed in a fashion that allows everyone who wants to ride the decline down a chance to get on board. That is, perhaps there will be no convenient 2nd peak to broadcast a signal everyone can hear to “go short.”
Another overlooked factor is the possibility that those with leverage are already short and will either manufacture or allow a decline. Those familar with how low-volume markets are manipulated know it goes both ways: once markets get heavy and cannot be pushed higher with the usual tricks, then a decline becomes the logical trade to nudge. I think your charts demonstrate distribution of long positions, and short positions may have been built with the proceeds.
Finally, almost no one expects a sharp multi-week decline, as this has been reckoned “impossible” in the era of QE. But correlation (for example, JPYAUD and the SPX) is not correlation, and all sorts of correlations that have worked for years can stop working without any pre-announcement.
Jesse Livermore famously noted the market will take the fewest possible number of participants along for the ride, and right now skepticism of a decline is high: exhausted bears have given up and the relentless rise to new highs is giving no signals of reversal. I doubt the market will make it that easy to go short.
The market melt-up could easily stretch out to October, but once again, that’s what everyone expects, so the likelihood of it being that easy to ride the melt-up and then go short when a bunch of easy-to-read signals appear is very low IMO.
Many thanks Charles. Yes, the implication would be we turn and fall relentlessly with out the obvious chance to get in/out.
I insist, the market is mature, between jul-sep´14 will see the top, maybe this week, or past, within a mid correction in summer time, but for the Dow 17-17.5K is a great opp. to be short (is my option, of course).
The structure is similar to 1909-16-19 for the DJI or similar to S&P 68-73-80-82.
Best case 0,5 fib. retracement from these levels.
Regards to Charles, I bet he doesn´t remember me
@apanalis
Wired title. First-chance peak would be better.
I do think the broad US stock market might be near its peak for this year. But collapse? Someone must be very confident, sometimes overconfident, to make this bet. Needless to say, you win big if you ever win, just like other tiny chance bets. The market is always fair.
If you look at historic examples, the same ingredients are there for a collapse: excess leverage, overvaluation, lop-sided sentiment and asset allocation, thin volume, stretched levitation, post solar-maximum. Waterfall declines may not happen very often, but when they do, the set-up looks like the current.
Add to that mix that last week showed a desperate deep pocket attempt to stop the gold rally (please define ‘fair’) , the last bears going into hibernation and people starting to say the market can’t go down and we have the ingredients of a significant top.
Monday/Tuesday will see volatile consolidation as the last dip-buyers are absorbed. From Wednesday on the downtrend will accelerate.
Next few weeks/months will be down.
I’m with John on this one.
Andre, Have you changed your last view of peak on 5th Aug?
Yes; I think I have.
The timing of highs and lows stay the same naturally. So this is about trend.
My current view is that july 23rd is a key date. My indicator gave a market top today. But my TPP (see post Saturday) runs till Tuesday. So Europe will open slightly higher tomorrow (as S&P futures/ Asia). Then a nice drop down. Monday will give a top and bottom. Tuesday will be up. On S&P it may hit 2000, but European markets may set lower highs.
Anyway, a major decline will start Wednesday, that will run for weeks. August 5th will give a high but it will probably be a lower top.
Even I learn more everyday in reading the tides 😉
Cheers.
p.s. no advise; just what’s in my head…..
I am relatively new to the information and insight offered by you and John. Slightly different approach, but it seems to be very complimentary. I’m very appreciative of your insights. I’m currently trying to get my head around your approach, so please keep posting, and eventually I am sure that I will see the path that you are shinning the light on. If the tides don’t wash me out first 😉
Are you saying the following: there are gravitational, magnetic, and electrical forces that influence human emotion and therefore the markets. A proxy for gravitational forces are tides. If the preceding is true, what would be the corresponding proxy measures for electrical and magnetic forces.
John analyzes electrical and magnetic force; I don’t. The advantage of gravity is that it is the most predictable force of them all.
Not all forces behave the same. Gravity gives cycles; not trend. Solar acivity is – imho- more suited for trend. Trend and cycles; that’s all we need.
So I think the biggest challenge now is to accept this way of thinking and discus how to turn it into a practical approach we can work with.
All I do is add the gravity edge. The integration into one unified approach is something we can all think about. This would be the only site that would make this happen.
Andre, a chart or two showing correlation between gravity and the stock market would really help – if you have or can produce I can upload to the site.
John, I’ll have to work an that one; but I’ll do it with pleasure. Few days will do it.
Something really interesting here guys.
Occult Message in Speech by Christine Lagarde of IMF https://www.youtube.com/watch?v=QYmViPTndxw
This video is claimed to contain hidden or occult messages from the IMF to the elite. Many times the Elite like to use numerology to plan their False Flags and to send messages to each other. She keeps on talking about the number 7 and the month of July. Many are saying that she is predicting a Market Crash around July 20, 2014 – coincidence?
Thanks Mae, that subject has been covered and reported here previously.
Mae, I do believe in all conspiracy theories but in this case If you read full transcript available for that video, you would notice this number 7 was just a brief mention and I doubt it was more than just describing 2014 with numerology.
Even in case I were to believe “7” I guess it has something to do with Lunar month 7 NOT normal July. Lunar 7th month starts on 27-July and ends on 23-Aug 2014 and seventh day of Lunar 7th Month (Qiyui) is 2-Aug 2014. I guess so many here have suggested peak of Dow Jones in first week of August 2014 :-).
Sunday entertainment : Gates of Hell.
-‘You don’t believe that’ – ‘I doesn’t matter. They do’ – jeremiah johnson.
What if the elites practice witchcraft?
Nice despe906, it may fit with the Christine Lagarde’s IMF magic 7’s speech. The Chinese Ghost month as I posted before falls on that exact same date when Hell is open up letting those spirits visit their descendants.
Ramadan ends on the date of July 27.
It does align with the geomagnetic dates John posted on his geomagnetic chart. Maybe it is the opening and closing dates of the freefall?
Could this also reference the pits of hell opening such as Fukishima losing all containment?
Symbolically, the fact that the 777 (Magic 7’s) was shot down rather than dropped naturally could be taken to mean that those in power (IMF, BIS, Fed) will intentionally bring the elevated back to earth.
http://www.zerohedge.com/news/2014-07-08/fed-going-attempt-controlled-collapse
The video mentions the return of the messiah and the golden age (currency reset with new gold standard)? New BRIC monetary standard?
It will be interesting to watch it play out, now that the head of the IMF is giving out “magic dates for 2014”.
295 passengers. 2+9+5=16. 1+6=……
7? That’s a holy number. How about 6? What’s 3 x the crash lows of 666? Sounds more eerily a nefarious top lol just be careful and hedge. No one can predict tops and bottoms and the tea leaves are usually all wet sitting in the bottom of a cup mixed with someones saliva. Ponder that ….
298 = 2+9+8=19 1+9 =10 1+0= 1… uh ok… lol
I know…. but it was entertainment. Sill, got my number from another site.
Original statement :
http://www.belfasttelegraph.co.uk/news/world-news/malaysia-airlines-crash-295-passengers-killed-as-amsterdam-flight-mh17-shot-down-at-ukrainerussia-border-30439882.html
“The death toll from MH17 has now been increased to 298 — because there were three infants on board who weren’t previously counted, according to a statement from Malaysian Airlines.”
http://www.vox.com/2014/7/17/5914055/mh17-death-toll-increased-to-298
It’s so nice to see that Charles tweet John’s analysis. I’m a long time follower of both. Very positive synergy.
Specie, I realized it was time to move from lurker to active promoter of John’s work, which is far more unique and coherent than much of the TA distributed by analysts charging big bucks per month. I tend to be early in my calls, to my detriment, so it’s actually a bit of relief that others share the same plight.
I mis-typed one word in my post: it should have read correlation is not *causation*.
I think most thinking people are early. Better to be early than late. Most people who aren’t paying attention are late and just react without any planning. I would expect next two weeks to be the tell.
andre, your very entertaining. 295 dead
Thanks. I said passengers. So with 1 pilot and 2 co-pilots, you have 3 people that don’t qualify as passenger. 298-3=295 and the sum of……. 😉
You have to be creative to get 7. And numerology isn’t my cup of tea anyways.
The problem for the bears as I can see is that fear jumps even at the smallest fall. For example, CNNs fear and greed index fell to mid 30s and Vix shot up over 30% during a small 1% pullback on Thursday. So why is this a problem for the bears? Well the market insures most people lose. So if there is a huge demand for protection it is unlikely to crash.
A better result would have been for complacency during Thursdays drop. The kind where investor think they don’t need protection because the market will just bounce back.
We are in uncertain times. Disbelief as the markets moves higher and the fear that a correction/correction is just around the corner.
The VIX may have shot up 30% but even after that it is hardly off the canvas.
When the VIX is finally nearing or in tripple digits I will begin to think about going long again.
In my opinion this occult talk is a load of Mumbo jumbo, well I hope it is as I closed my shorts waiting for the magic 2000 + on SPX.
Maybe she has thrown a curved ball so we can all load more shorts to get burnt, but I did notice Russia and Israeli exchange is down today and Dubai has dropped 6% today after retail was told everything is great in Dubai.
No doubt we will see soon enough, waiting and watching.
I only just noticed but Dubai did have a second chance peak very similar to 1929 and 1987. The chart is about a month old but it give you an idea … http://www.zerohedge.com/sites/default/files/images/user3303/imageroot/2014/06/20140624_duibai.jpg
Yeah, 7/20/2014 is the numerology date, and to think we thought the market was closed on Sunday. Not for Dubai!
Israel is also open. Tel Aviv stock exchange closed red, this Sunday.
Maybe that’s the problem, it’s hard to control every single market, here is a snap shot of one year for DFM, notice anything familiar?
http://www.bloomberg.com/quote/DFM:UH
Here is 3 years
http://investing.businessweek.com/research/stocks/charts/charts.asp?ticker=DFM:UH
Tapering is Now Tightening – http://www.ritholtz.com/blog/
Yes, Fed is slowly tapering but ECB is about to begin…..
Which is why it’s interesting European markets have been relatively weaker than the U.S. —
Be prepared from this week. The top from jul to sep´14 is on motion within a mid correction, 2nd of the current year, about 8% for the Dow (10%), similar 2007 structure.
Be tuned.
Best regards to John and you all.
@apanalis
National and world historical events influence the market to a neglible degree. Element II of the price-motion model, JM Hurst, The Profit Magic of Stock Transaction Timing. P 34
Serendiptiously ran into 12-25-2015 connects to 1896 Silver Panic, 4-28-42 bottom, 5-26-70 bottom, and 10-20-87 crash bottom. The Spiral Calendar by C Carolan, p52. It is the full moon after the winter solstice. Solar and lunar eclipses are in Sep 2015.
http://www.timingsolution.com/TS/Articles/tidal/index.htm
Posted for information and research ideas. I am not endorsing the software, don’t own it and never will.
No correction can occur without a daily close below the 20day moving average. Three times recently (Jun 25, Jul 10, Jul 17) it approached very close to it and each time it got support at the 20day MA and rallied significantly.
At this stage the analysis is quite simple and very similar set up to what occurred during the May 15-21 window when it traded near the 52-week highs and formed a triangle consolidation within a tight range (SPX 1870-1890 with high around 1900 and 20day MA around 1880). The breakout was upwards and rallied 100+ points.
Now current Jul 17-21 window also has a tight triangle consolidation with SPX 1960-1980 and trading near 52-week high around 1990 with 20day MA at 1970. If it cannot close below 1960 later this week and if it breaks out upwards again to new highs over 2000 then it would be unsurprising to find SPX around 2100 by early autumn.
It’s been in a huge raging bullish trend since the critical point of May 20, 2014 when the market could have resumed a significant bearish correction to support the bear case of a failed double top but it did not. Personally, I think it is madness to even attempt to short this market by fading the market price action when all recent price corrections have been very shallow relative to the upswings and also extremely short in duration too.
Completely agree. The only thing that pays is price. Price is above all moving averages, no technical damage has been done. There will ofcourse be a correction at some point but in the meantime we have to look for higher prices.
It looks like we now have a “symmetrical triangle” forming in the SPX. Woth the likelihood of a few days more sidesways action before breakng.
Which way it goes nobody knows.
http://stockcharts.com/h-sc/ui?s=$SPX&p=D&b=5&g=0&id=p98783221816
USD/Yen keeps pointing in the right direction with the anchor pair of the global risk on carry trade in its 6th month of holding pattern. Over the last couple of years such holding patterns of such length are not uncommon and fortunately price behavior towards the end of such patterns gives a clue as to the direction of prices once the pattern concludes (towards the end of such holding patterns usually the USD/Yen trades in the direction of the resolution rather than performing a price reversal). The short case remains very much in tact reading the tea leaves provided by the Yen. Tallies with John’s 1937 chart which gives another 1-2 weeks before market volatility to resumes.
Last week, I attempted to stick in long positions in USD/JPY and GBP/JPY, I was shaken out three times with an overall small gain; the pairs surprised me to the downside. I will attempt again when the price gets above 100 ma on hourly TF. Pegasus, you’r my motivation to try to go long. If anyone is 65% into a market, I am happy to take the opposite side 🙂
Sunspot Number Drops to Zero
Space Weather News for July 18, 2014
http://spaceweather.com
The resilience of the market continues even with ongoing bad geopolitical news. Every dip erased. Seems like markets cant stay down for even a day without being brought right back up again. In my opinion these markets can continue higher. Why? Because global central planning on this level hasn’t been done before. Central bankers have shown they are willing to do whatever it takes and 5 years after the crisis they still are. I suspect there is a correction on the way to reset the indicators John has highlighted but not a crash. Central bankers will in my opinion bring back QE and this time even more than 85bn. We are probably headed for a 1929 style crash but maybe when things have gotten more out of control.
I agree. I wanted a big drop to show central bankers QE is not the answer but it hasn’t happened. Only lesson now would be a small correction and further advance as the printing presses fire up again.Then a multi year bear market which will take us below 2008 lows. In the short term 17500 dow might be hit to flush out yet more bears.
According to N. Walayat, if the correction doesn’t come, we will have a blow off top and the end of the Bull. So the correction must come, if we want to continue going up into 2015
http://www.marketoracle.co.uk/Article46535.html
Walayat argues for a strong correction soon which I agree with. About 15% seems about right. Max would be 20% which would next the breakout of the 2000 and 2007 tops.
I would like a correction, too. But it doesn’t feel like it wants to correct. Personally I don’t believe in forecasts or predictions, also I am immune to postdictions. My job is to see what the market is doing and what it is suggesting as a next move. I have no idea where will be the market in a year time, nobody knows, too many unknowns, so I don’t believe in forecasts. What the market is doing : it doesn’t want to correct.
Nd100 at all time highs again. still waiting for a sell signal. I am affraid that N. Walayat’s nightmare is not going to come true. I had dreams like this : vertical moves up and down, I was clicking buy buy buy and sell sell sell, getting rich in a day.
Pardon, Nd100 ath was in 2000
Has AAPL just had the “kiss of death”?
Targett raised to $135
http://finance.yahoo.com/blogs/talking-numbers/why-apple-could-be-hitting–the-law-of-large-numbers-192158114.html
But not so fast….
The daily chart has negative divergence galore along with bearish volume in recent weeks…….
http://stockcharts.com/h-sc/ui?s=AAPL&p=D&b=5&g=0&id=p85545898902
The open gaps in the NAZ and SPX leave the quality of this advance open to doubt. Gaps have been filled sooner rather than later recently….
Charles,
Really good to see you posting here.
If the market ever gets boring we can always discuss healthy food.
Disappointing action in JNK today
Today we are going to close lower. I expect a decent drop, and if price reverse, as I expect, today is the beginning of the drop.
You expect the dow to lose its 70 point gain? Would require a nuclear missile fired from Russia to do that. Actually that might only make it drop around 55 points as its not so bad really looking at recent events…I think we will need to wait till end August/September for a correction but I would hope we trade quite flat until then.
IMHO and this is only a guess on my part but today could mark an intermediate top. Enough people believe the market cant drop so I’m expecting a 3% pullback on the Dow I’m expecting this to be a quick pullback so may feel like a crash after the last few weeks of grinding higher. But this isn’t the top!
No Krish, I mean lower from where is now. Yesterday was an Inside day, with gap. Today the gap has been filled and the inside day has been broken for the upside. I expect this is a false breakout, only to clean some retail positions.
John,
I think this a great site and certainly enjoy reading every article. But i’m struggling with the idea of a second peak in the speculative indices. For example, the Russell should be falling hard by now. But the trajectory is very similar to the first decline. In the 1937 example its clear that failure of the second chance peak to create a new high gave way to aggressive selling. Same with 1929 and 1987. Also, its made a marginal higher high and yet to make a lower low.
What we continue to see is the bear struggle to hold their gains on down days and bulls keep hold of theirs for most of the day. Today is a good example, bulls have held price at the high of the day for most of the day. Bears gave up theirs within an hour of trading yesterday. Im actually bearish over the next week of so but not expecting anything other than a mild pullback.
R2K will accelerate once large caps turn. Final part of the topping process for a major historic top – that’s what I see.
So Mr. Softee reports and rises 60 cents, and AAPL reports and drops 59 cents…. I seem to recall that when the NAZ is being hyped to new highs, the Big Boys ramp big-time after reporting earnings. This looks pretty tepid. Given the narrowing leadership of the NAZ rally, it’s hard to see more advance if the Big Boys can’t launch off their earnings reports.
This narrowing of leadership and declining volume on up days are classic signs of a top. Once the remaining leaders roll over, the indices roll over, too. Netflix reported stellar earnings and dropped almost 5% today. Another one bites the dust in terms of large-cap leadership….