

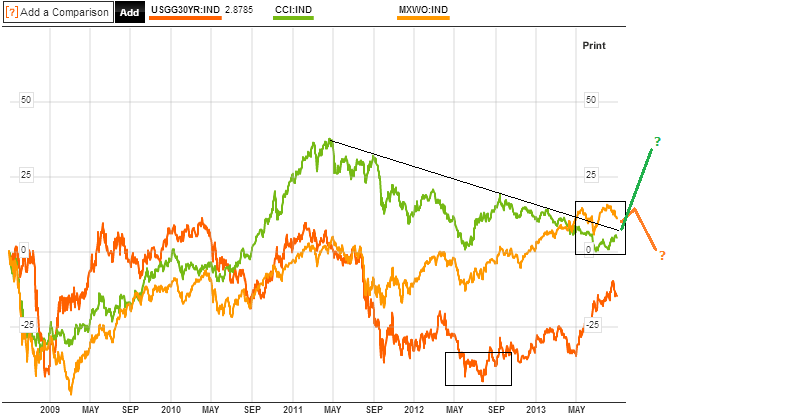
Is this a cyclical top in equities, the end of the bull market since 2009? If it is, then by the normal topping process, bonds should have topped, stocks should be making a topping range over several months, and commodities should take over and top last, if we are to comply with historic norms. On the below chart the CCI commodities index is in green, the MSCI world stock index in orange and 30 year treasury yields in red.
 Source: Bloomberg
Treasuries look like they topped in mid-2012 (yields inverted), and if equities are topping out then I have extrapolated how I see things should unfold. A completion of the topping range for equities, with at least one more rally up, and that rally being weighted towards late cyclicals, such as energy producers and basic materials companies, as commodities themselves outperform, to ultimately make their top as the economy tips over.
The next chart shows a longer term picture of the CRB commodities index versus the SP500. I have highlighted the last two cyclical tops, showing the multi-month topping price ranges in boxes and the lagged commodities peak in both cases shown by the lines. We potentially have the first half of a topping process on equities now, evidence for which I will detail next, and we see the commodities index tentatively turning up.

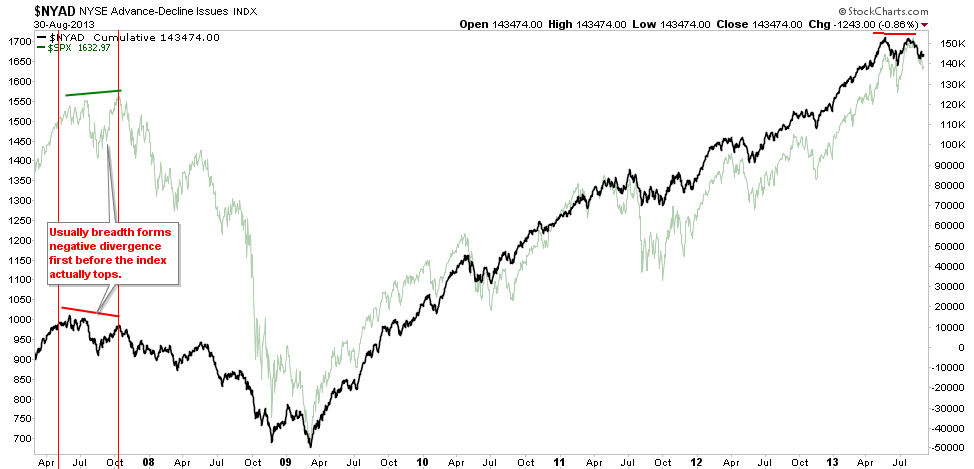
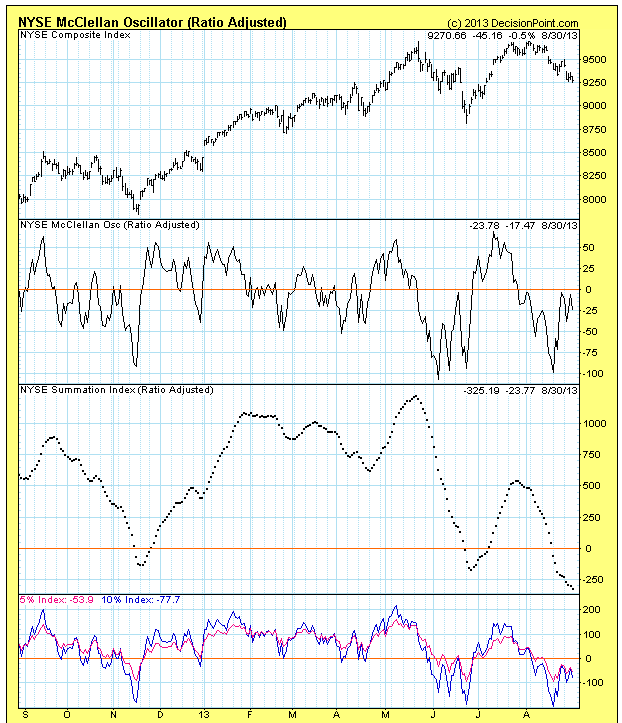
So let’s look at typical cyclical topping features. On US equities we saw a peak in May and then a marginally higher high in July, but on breadth divergence, which is one such sign. Below are two breadth measures showing the divergence (the Summation Index on the 2nd chart):
 Source: Cobra
 Source: Stockcharts / DecisionPoint
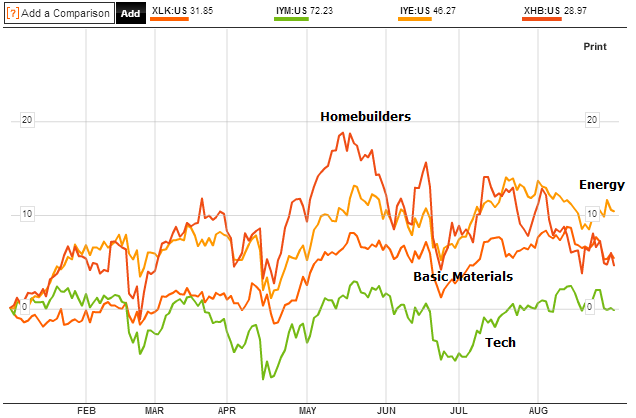
We should also see the batton being passed from early to late cyclicals in the process. As yields rise, interest sensitive groups start to underperform. Below I have compiled two early cyclicals: Homebuilders and Technology sectors, versus two late cyclicals: Energy and Basic Materials sectors:
Source: Bloomberg
We can see that since the start of the year Tech has performed flat whilst Homebuilders have been on the decline since the May peak. Energy has taken over, but Basic Materials have not yet joined. Drawing in other early and late cyclical sectors, the overall picture is one of a shift from early to late sectors to some degree, but tentative. I would like to see a more compelling shift develop to add futher weight.
Also in a topping process we typically see 90% distribution days and a shift from stocks making new highs to stocks making new lows. We saw such a 90% down day last week, but do not see strong evidence of a shift to percentage new lows.
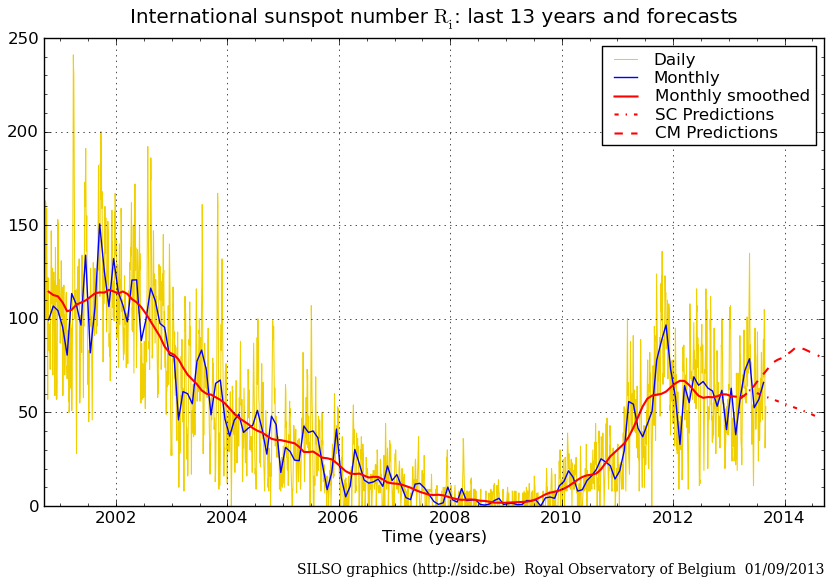
Other historic norms in a topping process are a tightening of rates through bond yields (check) and excessive inflation developing. We do not see excessive inflation, but that could occur if crude oil becomes a speculative target. If equities have stalled then under these easy money conditions it is possible that speculative money flows into oil and other commodities, linked to geopolitical developments or solar maximum. The solar maximum is historically correlated with both conflict and speculation, so they could materialise inter-related. However, whether the smoothed solar max is ahead or behind us continues to outwit the experts, frustratingly. Here is SIDC’s latest update, still running with the two possiblities:
 One more signal of a cyclical top would be the rolling over of leading indicators. Typically commodities top out once indicators are already in decline, sucking the remaining life out of the economy, whereas stocks are forward-looking. Currently, we see a mixed bag of indicators. Conference Board leading indicators have largely weakened of late, but manufacturing and service PMIs have shown general improvement. ECRI leading indicators for the US show a clear change of trend but this needs to continue to weaken and drop beneath zero, as per the action prior to the last two recessions:
 Source: Dshort
What I believe should occur is that commodities start to make strong gains here, taking the reigns as late cyclicals. Stocks should rally again, with the commodity related companies providing the thrust. Then inflation starts to be evident, and a demographically-challenged global economy starts to roll over in leading indicators, at which point stocks end their topping process and begin to decline, whilst commodities go rally to a peak in early 2014. In short, it would be historically normal for commodities to outperform here and in doing so puncture the global economy (which is weak due to collective demographics), which would tip over collective leading indicators into the negative. If this is a cyclical top in equities, then all this should happen promptly, i.e. this thesis should be quickly validated or invalidated.
Two investment banks have recently come out with crude oil targets of $125 and $150. Clearly geopolitical (Syria currently) is a wildcard, but the evidence shows that the previous peaks in crude oil have been speculation-driven. As mentioned above, in these conditions of easy money, if stocks have lost their momentum, then an unloved commodities sector (and ditto emerging markets which are also fairly bombed out) could become the new target and quickly bid up. Disclaimer of course: I want this to happen, as I am long a basket of commodities. However, I believe the evidence now looks much more compelling for this to happen. Martin Pring echoes this and believes commodities have begun a new bull. China is displaying improvement, which is as the largest consumer of commodities, is important to the backdrop. Latest PMI today is back up:

Gold has the potential to run up some way higher, as sentiment is still languishing despite the recent rally:
 Source: Acting-Man / Sentimentrader
Chris Puplava speculated that the US Dollar could break down from its range. Such a development would also likely be a catalyst for commodities. But, the FOMC output in the middle of this month, with potential QE tapering on the cards, is likely to influence the markets, as will developments regarding Syria. Nonetheless, I would take the stance that either a normal commodities late outperformance and broad rally is on the cards, or it isn’t. I.e. QE and geopolitical will provide short term movement, but I’d suggest won’t ultimately decide the course. I see increasing evidence that we are seeing the pieces fall into place for a commodities sustained rally, but again note the disclaimer and also note the timescale I believe is applicable, i.e. it should happen without delay, and the recent upmoves in precious metals and oil should continue shortly and spread over to other commodities.
Let’s take an updated look at Japan. The Nikkei has formed a triangle on the weekly, hopefully evident to all:
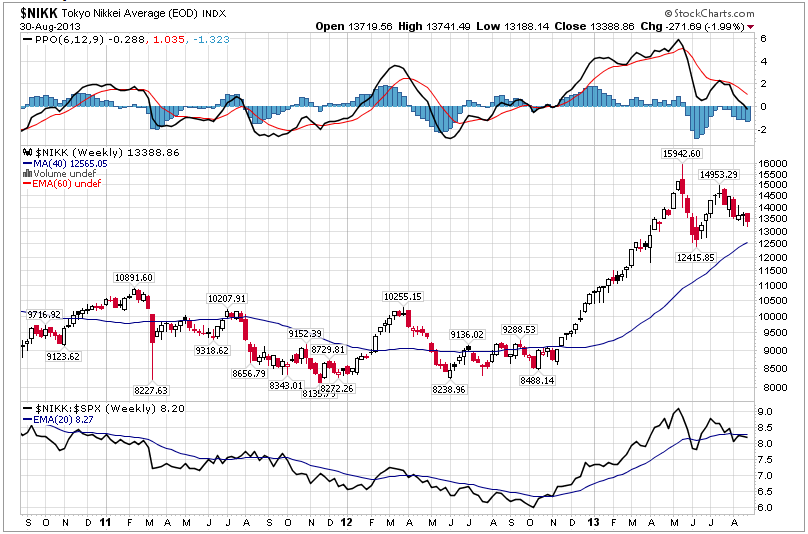 Source: Stockcharts
I don’t believe it’s clear which way that’s going to resolve. However, a similar but inverted picture on the Yen shows a candle last week that could mean this is a bear flag before further drops:
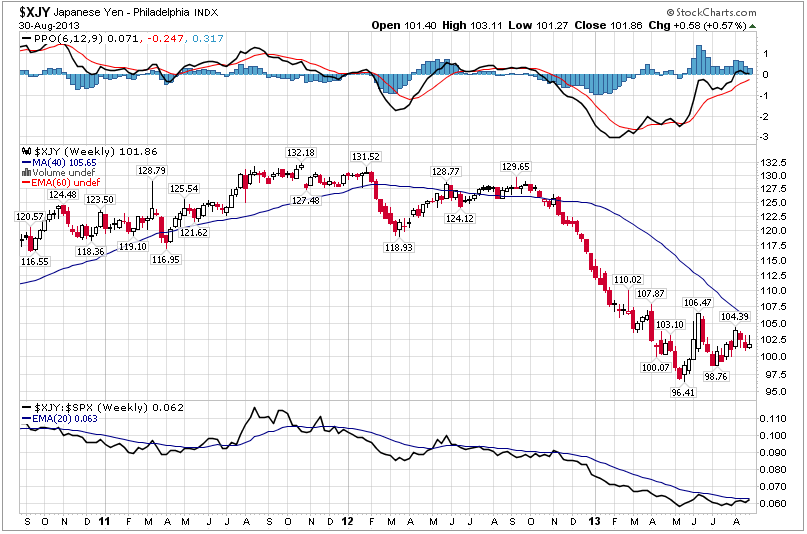 Source: Stockcharts
If the Yen breaks down that should benefit equities. However, the cheaper Yen has made imports to Japan more expensive, and Japan is a big energy importer. The Government’s aim of reviving inflation looks to be going well:
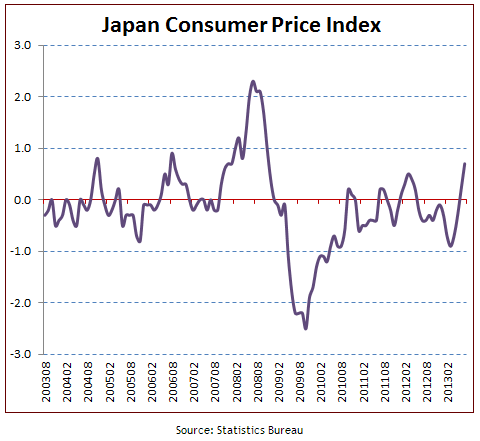 Source: Sober Look
However, this is largely the result of fuel and utilities going up as imports become more expensive, which is clearly no good for the economy (however, note that its exporters have benefitted). If commodities were to rally hard then Japan would suffer. However, as that development is just my speculation at this point, there is also positive evidence in the Japanese economy, which is what I would expect given their current demographic tailwind. We see the latest PMI shows strength, and makes last month’s drop look more like a blip:
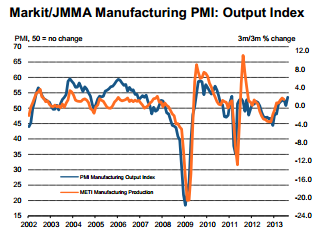 Source: Markit
So, until or unless commodities, particularly oil, start to rally hard, I would side with Japanese equities breaking upwards. However, if US stocks are making a cyclical top then I would expect global equities to turn down once the topping process is complete and I would not see Japanese equities going the opposite way. Once again though, if US equities are making a cyclical top then we should see commodities rally again to provide the tipping over, and Japan would then suffer accordingly. In short, I will hold off adding to my single Japan long position, pending further developments.
This week we have the new moon on Thursday and the end of the lunar positive period at the weekend. I expect stocks can mount a rally this week and that may well be the next leg up in the topping process. I have updated all models this morning and the geomagnetic forecast for the next 3 weeks is overall down to flat.

John in a earlier comment I suggested adding oil to your analysis as being as important as demographics. You thought that it would be too subject to new technologies. However fertilizers, fuels, plastics etc. are not going to be replaceable in the near future. Oil peak is past, fracking is not cost effective and this coming crisis is having a huge effect – as much as demographics. That is why Syria and then Iran have to go down – there is no other way for USA to control oil supplies whatever the world says. Russian oil is on the way down and China has none. Do you still feel the same about this idea.
You may be right John, but I believed the slack in oil inventories was a sign of the demographic-inspired easing in demand across the key countries, plus the US is now in a better position in terms of energy reserves self-sufficiency. If an oil spike is ahead in the next six months I would believe it to be speculation-inspired rather than a demand squeeze. However, there is no doubting the key role of oil in the world and definitely as important as demographics.
John, for the demographic ideas do you have data supporting it going back longer i.e. South Sea bubble etc? Would be interesting to see. Even though the concept makes sense I am a bit skeptical to only a few observations in history…
I don’t. I published as far back as I have.
Reblogged this on thedarklordblog and commented:
Super detailed report John.
Once again, gratitude for sharing your excellent research.
TDL
Many thanks TDL
Amazing PMI print for the UK today
http://www.markiteconomics.com/Survey/PressRelease.mvc/89b62348c597490698dae25b0324e7a7
zenyatta000
my cycles have a general bearish bias to November, possibly January. When we get there, we can evaluate the damage, whether it looks bearish or not.
My SPX work in weekly and monthly data suggest at best a sideways market into next summer, but most probable a soft landing (~20% down) or the start of a hard landing (longer bear).
And if/when SPX goes to ~1550, I dont expect any rally to new highs, at least not before the cycle lows are done in Nov-Jan.
I will present some longer term vies in my next weekly update – I will post a link here like the last one 🙂
Robert
I havent done statistical work on PC-ratio, TRIN or others. It is just visual observations and experience. Given that this clearly is a correction (of several weeks duration and broken below 55EMA) my experience says we should see some high PC-ratios, and high MAs of the PC, before we can trust any low.
Jan: The problem with that is that since you have not tested it statistically you are using your bias to come up with a conclusion. Whatever those indicators show you – you will interpret them bearish as you are a perma bear. I have seen a study that shows there is no significance in the options. So why use it?
Watch this: http://www.ted.com/talks/michael_shermer_on_believing_strange_things.html
I may be wrong and there is significance but then show the numbers. Otherwise it just becomes another TA showing some nice pictures and people around thinking that it looks smart but it does not make any cash. Just my view and it is not critical just debating. Think about Picaso, Dali etc painting and the effect there where people see what they want to see….
Happy about my NOK position today. BBRY is next. Noah effect at its best.
This one is good too… http://www.ted.com/talks/michael_shermer_the_pattern_behind_self_deception.html
A trading system is scientific if it is falsifiable, refutable and testable. Given any two solutions to a problem, all other things equal, the simplest solution is the best. Ockham’s razor.
According to the Joseph Cycle we crash in 2015. 7 good years, 7 bad 😉 as per the Bible. Any thoughts on that theory?
Robert
I also like to have statistics to lean on, and think I have some PC-data somewhere that I have to update and look at.
I took a quick look at the PC-data at Stockcharts, and used a 5MA at all corrections since 2009 (15 of them).
Of the 15, 13 had a put/call-ratio of >1,0 at the correction low. August 2010 had only 0,92 (but as high as 1,02 before the low), and November 2010 had only 0,94
Current correction low at Aug 27 had a 5MA PC of 0,90
On Friday it climbed to 0,96 and probably fell today with a PC-ratio of 0,74
However we have not made a new correction low since Aug 27.
I think this backs up my bias for saying not to trust the current correction low, before we get a new and lower low, with a PC-ratio of >0,90
Jan 🙂
when it comes to downside target, I do observe that SPX has been 198 TDs above 200MA, which gives a bias for breaking below soon (as in 1-6 weeks, but could be longer).
So if SPX breaks below 1630, it can potentially go below 200MA (1563 today).
And if it doesnt, there will be an even stronger bias at the next correction… but they typically comes at least a couple months apart.
In this secular bear market (say since 1998) SPX has typically made up to ~220 TDs above 200MA, except in 2004 we had just above 300TDs.
In the previos secular bear market 1966-1980 we had no rally of more than ~210 TDs
secular bear market since 1998? you realize we’ve had higher highs in 2000, 2007 and 2013 (not even getting into what small caps have done).
Thanks
Secular bear market? Are you sure? Price seems to show something else?
How did it perform in the run before 98 say from the 90s?
https://www.tradingview.com/x/YRQyUxaW/
Oscillators = squiggly lines get stuck. 97 looks a bit like 2013 ;). Humans are pattern seeking creatures.
http://stocktwits.com/message/15558891 =)
Hi,
US Senate concluded the decision to move ahead with Syria strategy with conditions. It will be a 60 day mission with little to none troops on the ground. Objective is to degrade and destroy Assad’s infrastructure, and support rebels to continue with the fighting afterwards.
Senate is set to vote in the next few days with support from key leaders, and the voting process appears to tilt toward a war resolution.
So, climate for a commodity rally is in place for a short-term rally.
Robert
You are not convincede that US are in a secular bear market? Do you think they never were, or that it is over because of the ATH this year?
Have you studied historical data?
If you have… you will have noticed that an ATH is the norm, even in a secular bearmarket.
Since 1780 DOW has made 6 secular bear markets, spaced by approx 40 years
And within these secular bearmarkets there are cyclical bullmarkets, and they “allways make ATH”… or are close to make one.
1809 made a marginally lower high
1852 marginally lower
1937 lower
1976 marginally lower
So the definition of a secular bearmarket is not the absence of ATHs, but the 15-25 year range bound trend. The 80-year secular bear tend to be long 20-25 years, while the 40-year secular bear in between tend to be shorter 15-20 years.
Hey Jan! Love debating with you. You are smart. We need to catch up one of these days when I am in Norway and drink some vodka.
Sure, I have studied all that data. From the time that I wake up to the time I go to sleep I study data, trading systems and trade.
I do not like the concepts of bull and bear. They are social constructs. I believe in only one thing when it comes to the markets. There are only 4 data points that are real. These are real as the system was set up this way and that is the Open, Close, High and Low. These are not indicators or cycles or anything else that pattern seeking creatures fills the gap in. They are truth. Every day the market opens. Every day the market closes. Every day the market will trade at some high point and every day it will trade at some low point. This happens on a one min bar to any loopback period you want say 100 years. So you are asking me are we in a bull or bear market. I would say that there is no such thing.
There is no trend. It is social construct that may not even be real. Are we trading at the all time high. Yes. Does my system tell me to buy the all time high. Yes. So I buy it. Will I be right? I do not know. I do not have a clue. If I am wrong I will be stopped out and take a small loss. If I am right, I make just another profit. Does it matter? No. I will keep doing this time after time after time. Profits will accrue. Do I know the exact moment when the markets will crash? No. Can anybody know on a consistent basis? I do not think so.
I only trade systematically in the spirit of Ed Seykota or invest in specific stocks in the spirit of Ben Graham. Both approaches have rules set in stone based on thousands of observations. I think the lunar cycle is tradeable if you know how to set your stop losses and exits. I have been trading it since I found John. Write a computer program and then just follow the signals. Do not mix funnymental data or other indicators into it unless you have done the same rigorous testing on those as you are introducing new degrees of freedom. Especially in conjunction with the lunar phase. They may work well separately but not together. Test the filter together.
As for the longer time cycles and you telling me that you have seen 6 times in history that we had a trading range for 15-25 years does not mean much to me. I will give you that the usually for most indicators/patterns the longer loopback period we have the more reliable they are but not always. The problem is that the 7th time this happens, we may get the Noah effect as described by Mandelbrot and this beautiful theory gets invalidated. The range may be shorter this time or longer. I believe in price and that everything gets incorporated into price eventually, even the cycle. So why not just follow price. I think it is pointless to predict. Choose a system. Study its results and draw-downs. Trade it. Accept the losses. Do not be Yale student. Be a trader. Follow the rules. Know when to break them (very seldom) but if I had a string of 6 occurrences, then my mean-reverting mind would probably say to break the rules this time ;). Problem is that we may not live long enough to see if this theory is scientific or just simply humans seeking patterns as per the videos I posted.
I know that it is FUN to search for indicators and draw charts etc as it stimulates our brain – in a sense it is addictive but I question the meaning. When everyone does something it usually mean it is not profitable. A statistic that is true, is that 95-98% of all traders including fancy money managers do not make money in the long run. Hence doing what everyone is doing is probably not a good thing. What most people do is read news, run from strategy to strategy – chose the one that has worked the best in the past and the same goes for traders. They have a good system for example lunar phasing but do not follow it. The rules are public domain and have existed forever but people just will not use it as they can not accept a few small losses. 6 observations does not mean much in my book.
But I will give you something. You will pick the crash and I will trade it short when my system says so but the rest of the time 95% of the time I will trade it long.
Need to get some Vodka. Cheers!
No point to argue with anything you write 🙂
And 40/80-year cycles are rather irrelevant for short term trading.
And the lowest risk trading is long/cash, no doubt about that 🙂 Specially in an uptrend…
This is another interesting discussion thread in the comments.
I absolutely agree that Robert is spot on in terms of what he says about trading, being disciplined is the most difficult thing about trading and one that I am just about getting to terms with (although this hasn’t been tested under extreme market conditions yet).
However I also agree with Jan and find his work most interesting, largely because I also follow cycles, as do most on here.
Investing is different, longer term timescales require a different approach IMO, stop losses restrict the ability to let profitable stock selection run.
There are many ways to make money from the markets and over many timeframes, hence many approaches. We all approach the markets differently and as long as we make money then there is no point in trying to convince someone that one approach is better than another.
John and Jan generously share their material – why knock it?
It helps to have conviction to “trade what you see” and that come from research.
Regards,
Kerry
Robert, I think your thoughts and comments about trading successfully are spot on!
It usually takes a lifetime of trading experience to understand and emotionally
accept these simply truths. And hopefully one has been able to remain solvent
throughout this learning process. I also think that it is our beliefs, not only about
the market, but ourselves–at the deepest core of our being–that when mixed
with a degree of innate talent; which puts us in the minority of consistent winners.
I enjoy reading your posts on this topic; although many who try and ‘predict’
will argue with your conclusions. For example, even a random entry system has
been shown to be successful; albeit for emotional reasons, difficult to execute
and follow.
There is no negativity to anyone’s work here =). Just saying that test before your trade and make sure you have enough observations so that it does not become a mirage pattern/indicator formed by your market bias. Also remember that all indicator/strategies go through cycles and you need to adapt. This is a good way to look at it http://en.wikipedia.org/wiki/Red_Queen_hypothesis
“Fundamentals that you read about are typically useless as the market has already discounted the price, and I call them “funny-mentals”. However, if you catch on early, before others believe, you might have valuable “surprise-a-mentals”. Ed Seykota
“If you want to know everything about the market, go to the beach. Push and pull your hands with the waves. Some are bigger waves, some are smaller. But if you try to push the wave out when it’s coming in, it’ll never happen. The market is always right.” Ed Seykota
“I don’t think traders can follow rules for very long unless they reflect their own trading style. Eventually, a breaking point is reached and the trader has to quit or change, or find a new set of rules he can follow. This seems to be part of the process of evolution and growth of a trader.”, Ed Seykota
I completely agree with this, it is all about indivdual styles (personality).
Is there an Ed Seykota book you’d recommend Robert?
According to Jack Schwagers Market Wizards, he increased one clients account from $5,000 to $15,000,000 in just 12 years…
You need to test a trend trading system yourself so that YOU BELIEVE… yourself in your own work.
Or you stop what you are doing i.e. looking for the holy grail and magic wiz bang indicator or system and just use lunar phasing that John has put up here and get your PhD in that. Should be enough to become a billionaire in some years if you really focus I think =).
Robert, I neglected to cite sometiing more important; not even mentioned by Seykota: a system with an edge. (:-) If I recall he designed a commodity breakout
system; and one that also sported huge drawdowns. Meaning of course that one had to have the ability to handle big drawdowns. And then the next ‘devil in the details’ is his system of money management as where to take profits and where to take losses. So, not so simple as reducing these elements to a few simple rules.
No. But the rules are always the same. You can use a random system if you like. All trading/investing is about draw down and how you handle them. You get what you deserve.
Risk does not equal volatility or sharpe etc.