
Global economic surprises remain flat to down. Leading indicators for Euro-land fell to minus 0.8. Globally, some countries have slipped negative, others remain positive. ECRI US leading indicators came in at 0.1. Draw it all together and the picture is one of weakening but mixed leading indicators and current data disappointment. Add to this fear over Greece, with impending elections in June, and Euro CDSs still on the rise, and it is perhaps not surprising that we sold off and moved down to oversold and overbearish in pro-risk in a variety of indicators. However, now that we have hit those levels, a snapback rally should occur. Regardless of outlook, a period of mean reversion should come to pass.
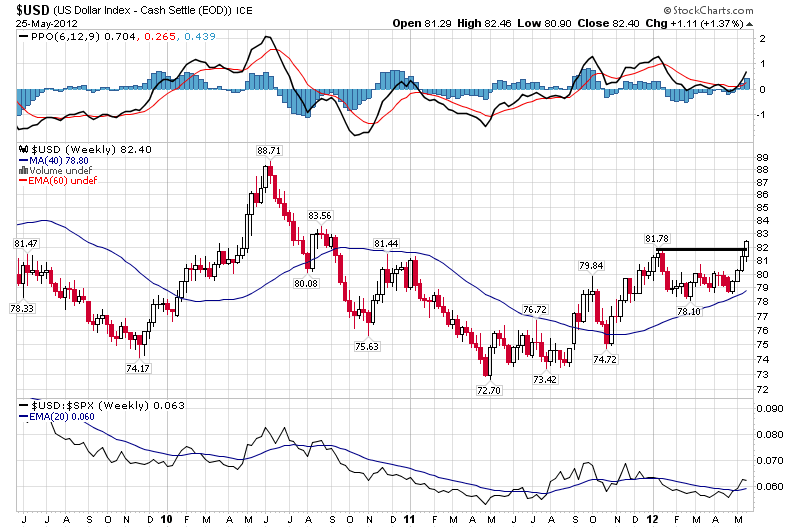
I consider two possibilities for how this will arise. The first is that we bottomed with the Capitulation point I wrote about a week ago and that the tentative pull-up from there that took place is cemented as the low. The second is that we need to make a lower low, with a positive Nymo divergence, before we rally. In doing so we would perhaps hit oversold/overbearish extremes in those indicators that haven’t yet delivered, such as Investors Intelligence sentiment and Rydex market timers. The full moon occurs a week today and we normally see downward pressure into it, which would support the lower low option. Supporting the rally-from-here option, we are particularly stretched in the Euro-Dollar, with its pro/anti-risk implications. MACD positive divergence, excessive Euro shorts, extreme Dollar bullishness. Here is the USD index chart:

Source: Stockcharts
The US dollar is trying to break out on those extreme contrary readings, which suggests it could reverse here and make that little break to the upside a fake out. If it is to do so though, it needs to occur right away, which would support the rally-from-here option. Clearly, newsflow has the power to trigger here. Since capitulation a week ago, stocks rallied without any real positive developments on the macro front. For this reason I suggest the rally was thus far fairly weak. But should some positive news come to light, then the mean reversion should accelerate.
So let’s see how this week pans out. No position changes for now. If we make a lower low with positive divergence into June, I will attack on the long side again. If we rise up from here I will alternatively be looking for negative divergences and weak internals if I am to take profits on longs. I believe the macro picture make it likely the ECB will cut rates in June and China will ease/stimulate in some way. The FOMC is just 3 weeks away and Twist expires then. I suggest the Fed will also deliver ‘something’, as nothing would amount to tightening (given Twist will expire). The President may also be keen on something to juice the markets, as the chart below makes clear:

Source: Big Picture / Bianco Research
Several technical indicators that I have previously referred to (such as nominal Nymo, insider buying) point to this being an important bottom, suggesting we can rally into mid-year. By solar cycles, we should see a natural turn up in growth and inflation and speculation. I expect that to occur, but boosted by central banks intervention in this soft period. The secular position that I wrote about supports upside too. So, I remain a bull, with longs. But the acid test will come as we make the mean-reversion rally ahead. If this is supported by central bank actions and improving leading indicators and economic surprises, then I expect to be proven correct. If however the picture remains weak and negative divergences abound, then I would alter stance and sell into the rally.

John
Thanks for the update. It is my expectation that we will see 1 more day of dollar strength before a 2-3 day sharp reversal before heading higher into late June.
Thanks
Anthony
ChangeInTrend
All models on the models pages updated. Note that next Monday, 4th June, is a combination of a full moon, geomagnetic disturbance (forecasted) and the start of the Puetz crash window. A bearish coming together.
Its intresting to note that :
MC Cellan’s euro cot indicator pointing to low in mid June,
Bradley turn date is 12th June,
Armstrong turn date is 19th June,
Puetz crash if were to occur is 2-3 weeks after the start which is june 4th (-3 days to +6 days ) also arriving mid june.
4 delta cycles due around/from mid june.
There is a high chance of a rally into US elections in November.
Whilst i would be suprised at new highs a notable pull back would certainly be on the cards.
Great amalgamation, thanks Aarif. There’s a clear possibility there for all to come good, whereby we crash from current oversold/overbearish into real amazing extremes by mid-June, plus fulfliment of the missing ones like the II and Rydex. Then the Fed/US gov delivers at the FOMC, both pressured and enabled by the falls, and the Greece/Euro situation is resolved post elections, leading to an even greater snapback to mean reversion.
Hi Aarif, I am a follower of Armstrong and use his cycle work. However I was wondering where you found out his turn of 19 June? I had 25/29 May for a turn using his cycles.
I also have a 360cd cycle for mid June, which fits in well with your dates.
Thanks, Chris
Some short term contrarian signals and indicators:
– US equity Put / Call ratio recently reached bearish extremes. Usually, this type of sentiment readings tend to bottom the stock market if the price is in an uptrend or above 200 day MA like we have currently.
– Hedge funds are now shorting the Aussie dollar for the first time since March 09 lows. Since Aussie is the global poster child of risk on barometer, this type of sentiment reading could mean majority of risk assets are close to or at an intermediate low. Aussie finds itself on a major support level around 97 cents.
– According to EPFR Global fund tracking company, investors pulled $1.18 billion from commodity funds last week, the fifth consecutive drop and the most this year. Gold and precious metals outflows totaled $631.7 million, also the biggest exit this year. From a contrarian point of view, we could have experienced a washout last week and a rebound could now be underway. Continuous Commodity Index is technically very oversold on the daily chart and slightly oversold on the weekly chart. Rebound is now overdue.
– Crude Oil bearish sentiment is reaching short term extremes not seen since August and October of 2011. Last week, Daily Sentiment Index reached a very very low reading of only 9% bulls. Single digit DSI readings majority of the time tend bottom an asset at least in an intermediate time frame. At the same time Treasury Bonds, German Bunds and British Gilts reached bullish extremes last week, of around 95% bulls respectively.
– Emerging market equities, tracked as MSCI Emerging Market Index, is now down 10 straight weeks in the row. This type of losing streak has not been seen since 1994, which is almost two decades ago. Considering that majority of emerging market stocks are now close to major support levels of October 2011 bottom (Russia, Brazil, India) we could stage a counter trend rebound sometime soon.
– Shanghai Composite continues to buck the trend against other risk assets, as it moved up strongly over the last few sessions. This type of price action is most likely discounting further easing policy out of China and also ongoing rumours that Chinese government is about to engage into 2008-type of stimulus package to proper up internal economy and demand, as Eurozone slows down meaningfully (Europe is Chinese biggest trading partner).
Comprehensive quality as usual, thanks Tiho
Morning,
I accept that the Euro area is the area in focus but it’s worth mentioning that in the US the Citi Surp Ind has broken trend to the upside.
I’m expecting global economic surprises to buck their downtrend, but too tentative to call at the moment.
Would the Puetz crash window at this time of year confirm a repeat of 2010 in 2012?
Puetz crash windows have been unreliable, hit and miss, so I’m not placing too much weight on it. But if we assume Steve Puetz is correct in that the biggest crashes have occurred in such solunar circumstances, then I would read it that if fear is to overwhelm this time and we crash from oversold then this is the time for it to happen – the first two weeks of June.
A lot traders want more downside and a complete wash out in prices with a spike in bearish sentiment. That way, we get a extreme correction type of an event but not a bear market, like in May 2010 or August 2011. Sharp corrections are common in longer term bull markets, like the one we have been in since March 09. This asset reflation move since late 08 is now running out of steam. The great run up in prices has been built on sand, so eventually it has to come to an end either in 2012 or 2013 or 2014.
My view is that we are most likely already here and in my opinion is the bear market top has started. Therefore, there won’t be any fast steep corrections that climax and signal automatic bottoms. They say that bear markets slide on a wall of hope, as investors constantly expect next next low to be the bottom. Every oversold low will have something to hope about, including extra stimulus from governments or another round of money printing. Same was true during 08, as governments and central banks tried trick after trick. In the mean time, prices just go lower and lower.
It wasn’t until market capitulated and crashed in October and and spilled into November 08 that a healing process began. Eventually programs like QE were deemed successful and Bernanke earned a person of the year on the Time magazine front cover. What a load of you kno what! My advice to investors is to learn to sell short as soon as the current bounce plays out into June/July. 🙂
And if I’m wrong, the bear is just waiting around the corner afte elections in 2013 anyway…
Interesting give and take about the Euro and game theory:
http://www.economist.com/blogs/democracyinamerica/2012/05/debt-ceiling-and-euro-crisis
Hi John, looks like my buy-signal from Friday was confirmed today. That should implicate a minimum of 2-3 weeks uptrend and SPX up near ~1390. Could be alot more time/price if things are bullish. But first we may dip around the week-end, which should be a buying opportunity.
Jan 🙂
Tiho made a good point. The momentum behind the 2009 rally seems to be slightly tired and kinda stimulus-driven. In some countries, like Spain, new lows are being made as we speak. My guess is that what will really end this bear market is a black swan oil spike event like the late 70s, and some kind of market correction which is the bear to end the sideways market
Thanks guys