
Leading indicators released this week for France, Australia, Germany and China all came in positive. China manufacturing data underwhelmed. Global economic surprises data has been neutral the last 2 weeks – the downtrend has been arrested but no uptrend has emerged. The Euro continues to decline, but under extremes of overbearishness and oversold readings (elastic stretching). Commodities have been accordingly pressured, but with the exception of oil most remain above last week’s lows, and the same applies for most stock indices. So the question is whether pro-risk will follow oil and the Euro to new lows.
The Nymo positive divergence that I last mentioned 16th May was removed by the subsequent two days deeper selling. That leaves us without the typical divergence that we see at a bottom. However, the extreme reading the Nymo reached suggests an important bottom will be forthcoming in the next few weeks, if this isn’t it.

Source: Alphahorn
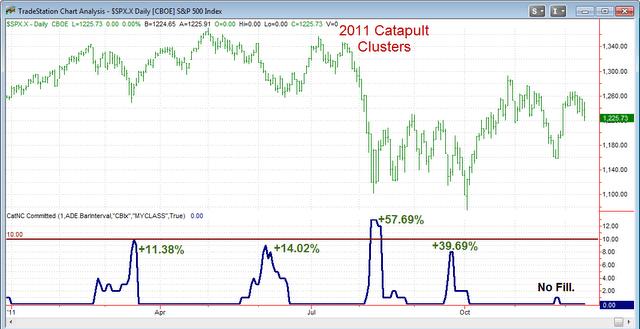
Capitulative Breadth (Rob Hanna’s CBI) hit on Thursday and Friday of last week. In the chart below for 2011 the lower blue line shows where this happened last year. The first occasion was in March, which produced a kind of V-bounce in stocks. The second was in June, where a more rounded bottom was reqired with some volatility around the basing, and the third was the Sept-Oct much longer, messier bottoming. That Sept-Oct period was a double bottoming, however, and buying the first CBI did lead to a v-bounce, only shorter lived.

Source: Quantifiable Edges
Percentage of stocks above the 50MA shows how extreme oversold we just reached, but again from that kind of level we have previously seen v-bounces or more extended basing, lasting from a couple of weeks to a couple of months.

Source: IndexIndicators
But there is an overarching message: from such extreme readings in Nymo, % stocks above 50MA and CBI (which hit 11 on Friday), the nominal bottom was close, and buy-side attack was the appropriate strategy.
My models show downward pressure into the end of next week. What happens the last couple of days of this week I therefore consider to be key. If stocks can rally further away from their lows then I would expect Euro and oil to reverse and join them and for a v-bounce low to be happening, with some consolidation only into the end of next week. If pro-risk alternatively falls and takes out last week’s lows then I will be looking to attack on the buy side again once we see the Nymo divergence and that would most likely after the end of next week once positive pressure emerges. My leaning is for Friday’s bottom to hold, but we will see.

I agree with that completely John. I bought it heavily at 1300 yesterday as my model says we should hit 1342 by the end of tomorrow.
short term I like to see how the swings in TICK behave (typically 3-4 day swings)
http://www.sibet.org/free/stockcharts.html
There seems to be buying-pressure expected next couple days (rising tick). Bearish opening gaps can sabotage this, but with flat or bullish open we should go up. So next two days into the weekend are imortant to gain hight. If sabotaged, we look very vulnerable after the 3-day holiday, when tick may point down.
Gold miners broke the 20 ma for the first time in months. A bear market rally from a v trough is now underway towards higher resistance levels. I am waiting for Silver to break above the 20 MA to add a little bit to my calls i bought last week. Emerging market equities and Australian Dollar are both very oversold, but still refuse to bounce. Eventually they should rally for awhile too. S&P should bottom either above or slightly below 200 MA. New highs in all risk assets are most unlikely, apart from US equities, where a marginal break above 1,420 (if it makes it that high) should be aggressively shorted into Fall of is year. Turmoil in Eurozone will escalate by then…
Tiho
1420 seems a long way off……I will be running for the hills if we take out 1296……..
In regards to the next few days, this may be of interest:
http://blog.stocktradersalmanac.com/post/Days-After-Memorial-Day-Bullish-for-SPX-SPY-ESF
Heed to the world’s uncertainties while waiting for the next QE. Until then,…stand down and relax.
And what if the next QE doesn’t work apart from a short term sugar rush?
Twist and LTRO failed to push risk assets to new highs. Another mild program, like Twist extension or LTRO 3, could actually disappoint investors and CRASH the markets!
Citi’s Economic Surprise Index for Major Economies (CESIG10) broke below the base it was trying to form, down to -33 at present time. Overnight EUR data was not pretty either. The CESI for the US has still flatlined/basing.
IF SPX does not go down tomorrow, I have a buy-signal that normally comes at a new ~70day cycle (or 15 week cycle) – or 6month cycle if that one is dominant now.
It could turn into a bearish cycle/wave, but regardless we should have at least 10-15 days upside and approx 5%. And could be much more (time/price)
First we have to confirm tomorrow or Monday (and not crash) 🙂
Minor’s look very sketchy right now, GDX hit a critical support around $40. In October 2008, the last wave down (what looks like wave 5, or a double zig zag) took one month to complete, and I see that we could have a potential selloff in the markets into the end of June/early July, which is plenty of time to get to “potential” channel support which I believe could be around $27.50 on GDX. (How can I post a chart?) SLV is trading in a triangle below broken support. If it cannot retake this support level with confidence, I still believe it’s headed to it’s next level of support around $25-25.65…
Should the market be in a trough around June 4-6 and a crest into June 10-12, then we could potentially get a pretty good sell-off into the end of June/early July period…which coincides with the Greek vote timing.
FXE is currently trading below a critical support at 125 today and in a potential bear flag. Should we get a sell off into the end of June/early July, and the Euro continues to break down, I have a potential support level of around 117 on the FXE….
Most indices and VIX related indicators are trading in a triangle which can usually indicate more down in a downtrend….we shall see which way it breaks out. If we don’t get a significant rally here in the next couple of weeks, we could definitely take out the 200dma.
What is concerning to me is the Russell 2000. A lower high on the index with a lower high on the TSI indicator has usually led to an immediate bear market or crash since 1996. Of course in an election year I don’t think that will be the case, but the bearishness in the chart is definitely concerning…
QE would most likely change the outcome and prolong the rally into 2013 as we are all expecting….
Thanks all.
Friday morning, not much to add. Markets appear to be shaping out a bottom with a bit of back and forth, but still tentative. CBI returned to 1, so that advantage is now over. Insiders are buying at the kind of levels that previously marked important bottoms (from TSP Talk). See how today shapes up.
John is it normal for CBI to fall that quickly?
It’s normally fairly swift. See the blue line on the Quant Edges chart above.
Over the past hour, gold has been trying impressively to assert itself as a safe haven (at last) in the face of stocks weakness and USD strength. Could mark an important turning point if it can continue through today…
By the way, for those who thought the Eurozone debacle could get no worse – try watching the Eurovision Song Contest tomorrow night!
I am toying with the thesis that the European powers that be have embarked on a stealth, controlled devaluation of the Euro (see Jeremy Siegel article in the FT a couple days ago) and the many that are short it per COT stats will turn out to be right this time. It also means Euro price action shouldn’t be viewed as a risk-on, risk-off barometer as it’s being manipulated by far stronger forces.
Equities have really tried to rally this last 24 hrs ….but they are really struggling
European powers have no control over anything, let alone a “controlled devaluation of the Euro”.
Nonetheless, since Euro short is the most overcrowded trade in the world, so I wouldn’t blindly short it right now. I’d rather expect a catalyst to create a short squeeze instead.
Tiho, perhaps controlled isn’t the right word – maybe intentional is more suitable. My point isn’t really whether such policy is controlled or intentional; rather it’s to raise the possibility the Euro could continue to decline and much more than people think – due to the benefits a devaluation provides. I’m suggesting those who are long the Euro strictly because it’s “contrarian” should carefully re-examine their premises.
I agree, but I think the answer is much more simple than that. I believe a currency cannot be controlled. How many times have you see Japan or Switzerland trying to stem currency appreciation? And how many times has it worked? Sometimes over the short term, but never over the long term.
The Euro is going lower because the recession in Europe is intensifying, which the market is discounting in form of further rate cuts by Draghi, lowering Euro’s yield advantage against the Dollar. Remember that ECB stands at 1% while Fed at 0.25%. The ECB could go as low as BoE, towards 0.5% rate. That would seriously hurt demand for Euros globally by major funds.
And if the European recession spreads globally, as some smart investors seem to think, we could have a powerful capital flow into United States as a safe haven just out of fear of Lehman repeating. This would create even higher demand for Dollars, and push up the price.
Finally, since majority of debt globally is still denominated in Dollars, a banking default of some kind similar to the Lehman event in 2008, could create shortage of US Dollars between banks internally, which would also be a catalyst for short term demand.
All in all, events exist where Dollar could go higher without a doubt. But as I said above, I wouldn’t blindly but Dollars right now. I’d rather expect some catalyst to create a Euro short squeeze instead, at least for awhile. Positioning is super extreme!
Tiho,
I am short both Yen and Swiss francs right now. I am long Canadian dollars, Australian dollars, and US dollars. I am long the euro against the franc as well (right at 1.20).
The BoJ and SNB have defended certain levels recently and I expect them to do the same for the near term and if nothing else, as price moves closer to their triggers, speculators will stand back and close positions. Of course, that is what both the BoJ and SNB would like first prior to them having to step in and stem the strength of their own.
Whether these hold in the future is another question, but right now it is working. Don’t fix it until it breaks.
Yep – agree with you. As I suggested to John, it’s all game theory now for markets. What is in everyone’s interest? I would argue the Euro moving lower is just that, helping Europe’s southern arc become more competitive, while at the same time forcing China to move away from its mercantilist policies and act to stimulate domestic consumption (which it needs to do in any event), and the U.S. accedes because a devaluation helps to stabilize a tenuous situation prior to the election in November. Simplistic, perhaps…we shall see.
2012 seems to be panning out quite similarly to 2010, at least for the FTSE 100, with the May crash due to uncertainty around election time. The second round of Greek elections are due in mid June. If an anti-bailout party wins, the markets would see a 2008-style crash probably, as we would deal with a Greek exit drama
Between now and those elections, maybe the markets will see a relief rally into mid June, and then after elections (hopefully with a pro-bailout party winning) we could see the FTSE endure lurch down to a 2012 low at the start of July at about 5150-5200, followed by a sharp rally back into year’s end, ending 2012 between 5950-6250