
It is a contrarian’s dream, right here right now. These are the opportunities that make me lick my lips: oversold and overbearish extremes. This morning I have added long Hang Seng, FTSE 100, silver, oil.
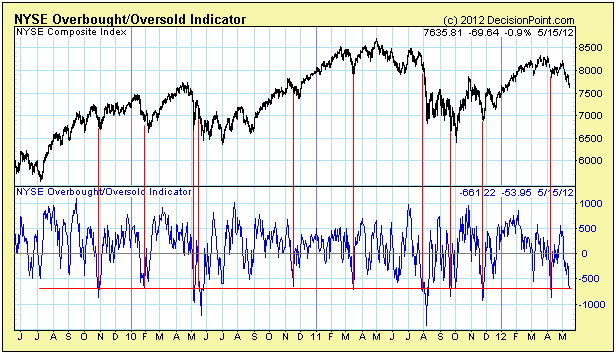
Starting with equities, NYSE oversold extreme has historically marked bottoms:

Source: DecisionPoint
Put/call ratios at levels that have historically marked bottoms:

Source: Decision Point

Source: Cobra / Stockcharts
AAII sentiment at bearish extreme, plus high percentage of II sentiment neutrals which has historically siginified a trend change. UBS here highlight the lack of high volume capitulation. Yesterday gave us a voluminous daily candle, but capitulative breadth only reached 3. It is possible today we could see that capitulation, followed by a hammer v-bounce. Let’s see.

Source: UBS
Nymo positive divergence. Again, UBS’s chart, with their interpretation that we will see a significant bounce then further downside. I repeat my point that whether you side with my longer term projections or not, a period of mean reversion will follow when pro-risk hits oversold and overbearish extremes.

Source: UBS
Sentiment is at bullish extreme for the US dollar. Euro-dollar RSI is in the extreme oversold zone.

Source: Profitimes / Sentimentrader
The USD longer term is now at horizontal resistance.

Source: James Craig / Stockcharts
Gold sentiment is extreme bearish.

Source: Profitimes / Sentimentrader
Silver sentiment also, levels that histrorically marked bottoms.

Source: Sentimentrader / Profitimes
Rydex precious metal allocations are at extreme lows.

Source: Jordan Byrne / Sentimentrader
Gold miners are at oversold and overbearish extremes.

Source: Jordan Byrne / Sentimentrader
Gold commercial and open interest is at contrarian extreme.

Source: Jordan Byrne
Commodities are at long term historic low valuations compared to treasury bonds.

Source: James Craig / Stockcharts
Treasury bonds are at all time highs, paying negative real returns.

Source: James Craig / Stockcharts
Various agri commodities are in the overbearish extreme sentiment zones, including orange juice, coffee, wheat and cocoa. The global temperature figures for April came in at the second warmest on land since records began. Dry weather gave agri commodities a push up yesterday, counter to the pro-risk sellling, as harvests are likely to be affected.

Source: NOAA
Lastly, the macro front. Leading indicators point to growth ahead, with the exception of Euroland.

Source: Conference Board
Economic Surprises have stablised in the last couple of weeks for the major economies. Leading indicators suggest we may see them turn up ahead.

Source: Bloomberg
But the overarching issue currently is Greece and Euro debt. Spanish CDSs are at a record and still climbing, plus Greece is going back to the polls with a probability of installing a government that does not agree to the bailout terms from the ECB. The fear is that Greece is expelled, makes a hard default and brings down major European banks.

Source: Acting Man / Bloomberg
I am not belittling the Greece and Euro debt issues. But we have been here before, the last 2 years. Politicians will take action, central banks will take action. The oversold/overbearish extremes scream opportunity, to me. If the Greece/Euroland saga rapidly spirals into the worst case scenario, and pro-risk plunges much further before reviving, then I will take some account pain. But I always keep powder dry. If we do plunge much more overbearish and oversold I will attack again lower down. But I believe the bottom is close at hand.

hmm not so sure about that… don’t get me wrong, I’m a contrarian myself but I also believe that one shouldn’t just watch oversold conditions and blindly jump in the market, remember 2008? The Dow crashed for about a YEAR until finally finding a lasting bottom. Many contrarians jumped in the market way to early on short bounces that eventually transformed into even more selling thus proving disastrous in the long term. Personally I’m seeing a lot of similarities between 2008 and today: massive flee from extremely oversold assets into an irrationally overevaluated dollar (deflationary spiral). Although most investors agreed that it was irrational, it still kept going on for MONTHS until a bottom was finally reached. IMO, until we don’t see some high-volume purge selling, and a significant increase in solar flares (remember those? 😉 ) any bounce we’ll have will be only short-lived so from a long term risk-reward perspective it’s just not worth going long now. Also, from an Elliott Wave perspective, this would be a 3rd wave down, necessarily implying a 4th-wave short bounce followed by a 5th wave down still. Personally I’m keeping my cash in my pockets and waiting for a better opportunity along the way.
Hi Lemmi. I see few similarities with 2008. Leading indicators went negative in the second half of 2007 and then fell away deeper and deeper negative into the end of 2008. Against that backdrop, oversold and overbearish incidences only meant relief rallies occurred. Now CB LIs are distinctly positive, ECRI LIs for the US are flat, PFS recession indicators point to none ahead. If all deteriorate meaningfully then I will take note, but right now they are nothing like 2008. In late 2007 we had stocks at extreme price ratio to bonds, and in H2 2008, commodities at extreme price ratio to bonds. Now, the opposite is true for commodities, whilst stocks are neutral to bonds. In 2008 we were heading into the solar minimum, reliably historically a time of a panic, crash or bottom. Now we are heaing into the solar maximum, reliably historically one of growthflation, with the emphasis on inflation, and a speculative peak. Lastly, at the 2007 peak we had various telltale signs of a major top (divergences, indicator extremes) that did not occur at the recent March 2012 highs. If we make a move up in stocks back towards the highs which delivers those signals then I would alter my stance, but I first expect that move up regardless.
You’ve hit upon a critical question Lemmi – is this a bull market correction, or the early stages of a cyclical reversal?
Karen made an interesting observation in her comments yesterday that this correction seems to be a hurry. Yet, the falls are not so violent that it could reasonably be called a panic. Its a bit like a fire alarm has gone off, but everyone believes that it is a drill – an orderly but sustained walk to the exits… In my opinion, things would have to get much worse to cause more QE or LTRO.
Gold has had its chance to shine recently – but it didn’t even turn up on stage! I can’t imagine that the markets will allow gold buying at $1500 without a fight – its just too obvious – so I think it will either not fall that far, or fall significantly below it. So I’ve added another spreadbet on it this morning, with a view to getting out quickly on any significant renewed weakness.
I agree that now is a time to be cautious about the risks involved in buying now (and John has obviously considered this carefully). And its worth remembering that although Jesse Livermore made a fortune buying on this type of dip, it also bankrupted him – more than once – when the dip turned into a change in direction.
Elliot Wave is a contrarian indicator.
One major difference between 2008 and today is that recent broad true US money supply growth (money TMS-2) stood at 14.5% year-on-year (as of April), whereas shortly before the 2008 crash, it had fallen to just above 2% year-on-year. Even euro area true money supply growth, which is still weak year-on-year (2.8% as of March) is recently accelerating, with the monthly increase in March amounting to a 12.8% annualized growth rate (the first significant money supply growth acceleration in the euro area in quite some time).
So the monetary backdrop was significantly more hostile shortly before the 2008 crash than it is today.
All short, medium, long and peakvpeak models updated. The messages are: sunspots continue their recent uptrend, geomagnetism is forecast to be less the next 3 weeks, which ties in with seasonal geomagnetism usually less now into July. We see the models flat to up in the next 3 weeks and they could gain an upward bias if seasonality fulfils. If sunspots continue to rise and geomagnetism is less, that’s a bullish set up, combined with commodities now below model.
I can see both of your points of view. I may be wrong(and please correct me) but I get the feeling what Lemmi is saying that this last bit of this current move smells of irrational behaviour – and once that gets grip then very unusual moves can take place.
My model suggests bull continuation. So provided certain things don’t happen I think we are most likely to mean revert back up to SP500 1400 and higher. This morning we have reached roughly the extreme that I would feel comfortable with if we are still in this bell-curve – Maybe a few more points 1318-1320, but not much more. If we break down from those levels then price is starting to move into unusual ground . If you take into account that Rydex leveraged bull ratio is still showing people are buying into this market, not capitulating,and CBI hasn’t triggered then this bottom line is looking potentially vulnerable. Now of course capitulation can take place in a few minutes so I am watching things very closely.
In the shorter term I have modelled upward pressure from 1342 until 25th May, so by history price should revert back to that point or higher by that date. This obviously supports the view that we at the bottom of the range.
Over the last week or two I have suggested that Gold would most likely trade down to roughly 1500 and that by doing this the US market in Gold terms has in fact risen, ( as happened in the summer of 2008). Taking todays low there is only a couple of percent to go. I believe there is much more upside in gold at some point and if I am right then 1485-1520 odd is most likely the bottom of the bell curve. If the gold price breaks down from 1485 level then I think that that is an early warning signal that, putting to one side the US administration’s obvious massaging of the economy,a major deflation loop is imminent. Now that hasn’t happened, at least yet, and for that reason you have to assume that this level is a good level to buy.
The caveat I would put in are those levels mentioned. Plus if the SP500 closes the month below 1320 I would be cautious.
A measured move could take us to 1295, and the H&S top could take us to the same level, not saying that is the bottom, in this kind of correction we will most likely bounce before another move down. I am assuming we at least test the triangle breakout around 1260-1270. The double top target for DJI is around 12,080.
Since we most likely have more to go in the market, that means risk assets will most likely fall with the market. I have a supporting trend line on SLV around $25-25.65, and below that around $22. SLV is sitting at a critical support zone because it is trying to maintain a higher low than the Dec 26th low, but it most likely will give way to lower prices. I see no positive divergence as of yet.
Preston, I see bull continuation as well into first quarter 2013 possibly to Dow 14,000, but not before we get to around 12,000. That is only a 9-10% correction. Do your models show this price level? I was thinking that we get to this level around the end of June possibly July 3/4…?? Do you have any timing should this scenario play out?
Karen, don’t get me wrong but you’re like a professor who is more into theory than practical. If you were sitting in an exchange or in a futures pit, I would bet you would be buying right now (in another words, directly in touch with traders). Some assets are getting sold less than cash on hand these days. While a crash could be anticipated, it’s really foolish to bet on it when we have plenty of safety nets and manipulated markets all over the world.
Tushar, forgive me if I am mis-understanding you, but I am not betting on a crash this year, a 9-10% correction is merely a correction these days. I agree with you, a crash is more than likely not coming during a year when the most important thing is “appearances” during an election year, and crashes don’t normally happen in even numbered years. But, at the same time the percent of Bears is still at only 23%, so more selling is most likely required to reduce this excessive bullishness.
Trading is practical, it is what is in front of you at the moment, and I don’t see a sign of bottoming yet. I also follow cycles and astro’s, and there have been many turns where we “should” have bounced (not bottomed), because of very bullish aspects, but the selling hasn’t stopped yet, and even in manipulated markets, traders are not going to try to catch a falling knife. Prices continue to fall because there is not enough desire to buy at current prices.
Because the market has not yet turned up during these positive aspects, this either seems to be a very bearish signal or we have not reached the alignment of time and price, or both.
I am not overly bearish for 2012, but 2013 could be a very different story. Next year if the market begins to sell-off in the 1st or 2nd quarter, then I would advise to sell, it may not bottom until later in 2014. If we see a correction of more than 20% in 2013, then there is a larger cycle that could follow and bring the indexes down at least 50% from the crest.
John,
The obvious question is……Is this a SIBO?
For me it is (stock indices buying opportunity). But I’d say more similar to the March 2011 bottom than the Aug/Oct bottom – i.e. a reversal at the bottom of an overall sideways range. I would rather label it a CBO, as commodities are at a more major oversold/overbearish bottom, and my conviction remains that it is the last CBO as we next push up to the secular commodities peak ahead.
Ah, it doesn’t take long for a politician or banking “elite” to sniff out the path of least resistance.
On the newswires already this morning – ECB spokesperson: “will continue to support Greek banks”, and German Government spokesperson: “Germany intends to stabilize Greece within the Eurozone”.
The last thing these people want is to attract any blame for possible chaos in Greece, or contagion to other countries, so they’ll have to appease Greece one way or another to keep it in the EZ – more money always goes down well…
John, all smart investors understand risk and reward, but also have balls to bet as emotions do not freeze them. This might be 2008 type of a reply that so many retail investors expect, but that is always an outside chance. If it is not, you will be paid handsomely for your bravering and following data, not emotions.
I’ll repeat this again, it seems to me that everyone is frozen right now. Even those who act like smart money contrarians are not acting. You on the other hand have proven to have the knack to just act on market price and risk reward setups, nested of gut feelins or emotions.
There is blood in the Precious Metals space. It might get bloodier, but you are acting as the Rothchild (the first contrarian did). Wrong or right, in my books you’ve earned some serious respect bro!
You got balls!
Thanks Tiho
Seems like today markets are waiting for the Fed notes
Interesting article today about George Soros quadrupling his Gold exposure:
http://etfdailynews.com/2012/05/16/billionaire-george-soros-spikes-gold-etf-position-yahoo-says-gold-in-bear-market-gld-slv-iau-phys-agq/
John,
Great blog. My plan had me buying more Gold and Silver ETF’s at these prices. (Pre-written plan). But fear got to me, and I only executed 1/4 of the number of shares pre-determined, while holding more dry powder for lower prices. However, I DID pull the trigger and buy something, and it took nuts to do it. I simply lowered my price points and will pull the trigger again if prices continue to go down. Decided to “scale in” rather than just one lump purchase. I already hold large positions and have resisted the emotion to bail out on them. Yes, dry powder remains. If we rally, I will kick myself for not following the complete plan, but will still be okay since I did buy some, and have held positions in tact. Good luck and thanks for the blog.
Thanks all
Karen hi
In reply to your post. My model only looks at the SP500 and it shows a rough low of 1340 – 1348. So we are below the model.
In timing terms as I said in my post we are in an up pressure until 25th. But that is the modeled price. As I posted the other day, and the graph won’t stay on the site, the actual price movement looks like for the moment that it may have shifted on a bit. I don’t change the modeled price because I believe price will revert to it eventually but I take note of possible “actual” timing patterns that may help execution.
Showing a graph is so much easier and more effective that describing a pattern or set up often and because my url links don’t stick, I think I will have to succumb and start a blog soon. I really didn’t want to but it might make life easier. I don’t want to duplicate lots of other “markets” sites and more to the point who can better this one. I have total respect for John on many levels. He is intelligent,inclusive,free- thinking, balanced and a good trader/investor. So I have been struggling with the basis of the site. Reading Tiho’s and seeing the cluster map of readers I came up with the idea of getting people to write contributions but to try to make it much more visual. i.e if you are logging in from San Fran why not have a pic of that great city at dawn with it. Also, maybe some video interviews. We’ll see.
Back to the market – the levels still stand 1320 odd is the bottom of the normal move – a move lower might start fireworks. Rydex leveraged traders went even longer last night so still no capitulation using that metric.
Gold showing some rel strength which is potentially a good sign as the read-through on what I have been saying over the last few days is that Gold/Equity positive divergence would be a good sign for equities.
Thanks Will
One to what out for……it looks like the Dow/Gold rising wedge with the bottom line at about 7.94. John you may want to take a look and see what you think …a break below that might show some confirmation for PM out-performance.
Thanks, looks a critical horizontal level to reverse at too, if it’s going to. Silver appears to have bounced at critical support. They need to reverse trends here, and they should. Let’s see.