
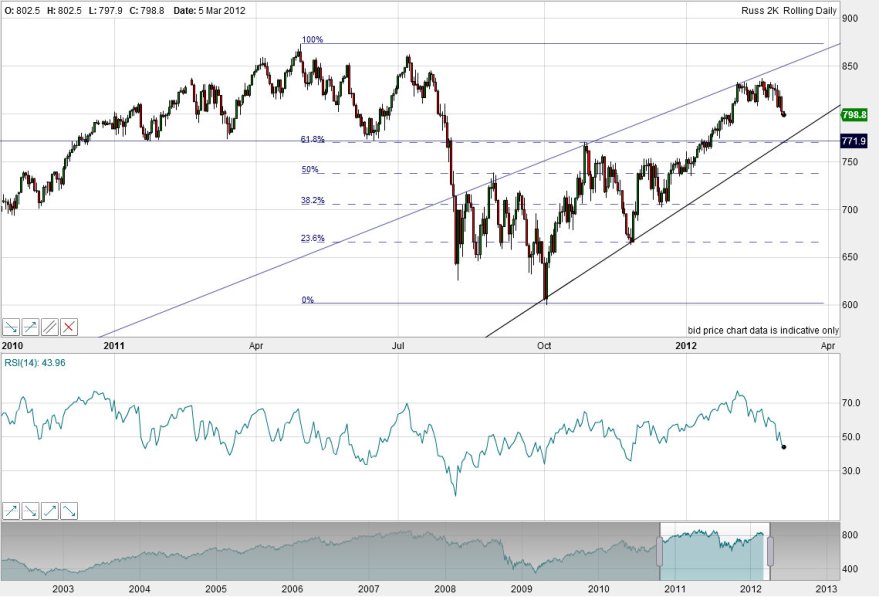
Will we finally see a downside break for equities this week? The Vix is still trying to make a rounded bottom, CS fear remains excessively high, Market Breadth has weakened, certain indicators remain overbullish and overbought. There is still no ‘screaming sell’ but note that US small caps have already broken:

I have highlighted on that Russell 2000 chart the confluence of horizontal support and the 61 fib, and the large rising wedge, which should act as support if downside in the other indices materialises. Large caps, currently outperforming, may correct less.
The full moon takes place this Thursday and the bottom by my models is around Friday. Due to some persistent geogmagnetism, my short term model has now tipped over a little. Here is it versus the CRB commodity index and around the lunar oscillations lower highs and lower lows can now be seen:

We see silver, the US dollar and stocks all at important junctions:


Source both: Chris Kimble
So might we see the US dollar resuming an uptrend here, silver dropping to the bottom of its downward channel in a continued correction, and the stocks rally ending?
Well, by history, it is unlikely that the strong rally in equities of the last few months suddenly reverses here. We should expect a drawn out topping process as a minumum. In other words, if equities pull back here, we should expect them then to revisit the highs, or make new highs, whilst seeing internals weaken and greater divergences come to light.
There is an extreme in bullishness in energy, particularly oil. That suggests a pullback in crude is imminent. But there is likely to be demand-supply and geopolitical support from the underside. Pro-risk typically moves together. So as it is unlikely that equities enter a significant downtrend here, it is also unlikely for commodities. Neither precious metals nor agriculture display overbought or overbullish readings like energy.
On the macro front, ECRI leading indicators rose again in Friday’s reading, but China data today surprised to the downside. Euro debt and CDSs remain well contained, with the exception of Greece. Credit markets continue to improve. Some key analysts still expect the Fed to announce QE3 or some kind of new balance sheet expansion in the next 6 months. Goldmans expect it already in the first half of the year. I can’t see it on the current improvement in data, but given their expectations I will keep it on the radar. Next FOMC is 13 March.
To sum up, my personal expectation is that pro-risk markets retreat this week, into my model bottom around 9 March. I don’t see it as an opportunity to short or to pull out of commodity longs, as I expect we have not marked a major top, and that this will be digestion. Rather, we should at least be revisiting the highs, or more likely exceeding the highs, after a consolidation, and in doing so we will be able to judge better whether a topping process is unfolding. Treasury yields continue to display a potential rounded bottoming, which could signify much more pro-risk appetite ahead, fitting with a secular commodities bull conclusion, and would support only digestion of gains here.

Last Feb to Jul looks like the 3 peaks of three peaks and a domed house for the stk mkt. Thus we could be close to a correction to pt 22 which begets the final high pt 23 corresponding to Mamis’ Enthusiasm top.
China had a significant sell signal last Nov. The cover of Time was “The China Bubble”. By the end of this year, today’s subtle warning of less than expected China growth should have given way to panic per Mamis again.
I think you are mixing it all up Kent. Technical patterns like 3 peaks and a house sound like some Amazon Jungle Voodoo Magic and are best left to those who are interested in losing money. As for cover of Time magazine, those are used as contrarian signals, therefore it was not a SELL signal, but a BUY signal. Hence why Shanghai bottomed within the next two weeks…
Tiho, if solarcycles work, I like it. The 3 peaks is from George Lindsey, one of the few great stock market prognosticators. He is said to have predicted the market with remarkable accuracy for over 20 years. It’s like an early version of fractals. The title on Time did (does) concern me, but it was about their great boom. I am bearish on China based on Chanos’ fundamental approach. The Time cover was an attempt to time the top (real estate not stocks but they should follow). In the US a general recession/depression follows 2 yrs after the peak in real estate like 2006-2008. So I Iike for fundamentals (supply/demand), sentiment, cycles(solar cycles), credit cycle, technicals to be lining up indicative of a top or a bottom.
I checked out your site, it is excellent.
Am really impressed with your new site (and analysis) John.
Thanks Fiona